- | Corporate Welfare Corporate Welfare
- | Data Visualizations Data Visualizations
- |
Changes in Occupational Licensing Burdens across States
Over the past six decades, occupational licensing has expanded rapidly. In 1950, just 5 percent of all US workers needed a license to do their jobs. Today, one in four Americans must be licensed by a state to do his or her job. When federal licensing requirements are included, the number approaches 30 percent.
As we documented in a recent public interest comment filed with the Federal Trade Commission, a consensus among economists and policy experts on the left and the right has emerged in recent years. That consensus suggests that licensure in the United States is excessive, limits competition, raises consumer prices, has a disparate impact on certain communities, and has little or no effect on either quality or public safety.
In two reports compiled in 2012 and 2017, the Institute for Justice (IJ) measured each state’s licensing requirements for 102 low-income occupations. Each report uses a slightly different methodology, so it is not valid to compare them side-by-side, but IJ has also released a comparison dataset with 46 occupations that spans both years. This dataset allows us to see recent changes in occupational licensure burden across all 50 states and the District of Columbia. We have analyzed the raw data in this companion dataset to recreate IJ’s “breadth and burden” measure for each state for both years.
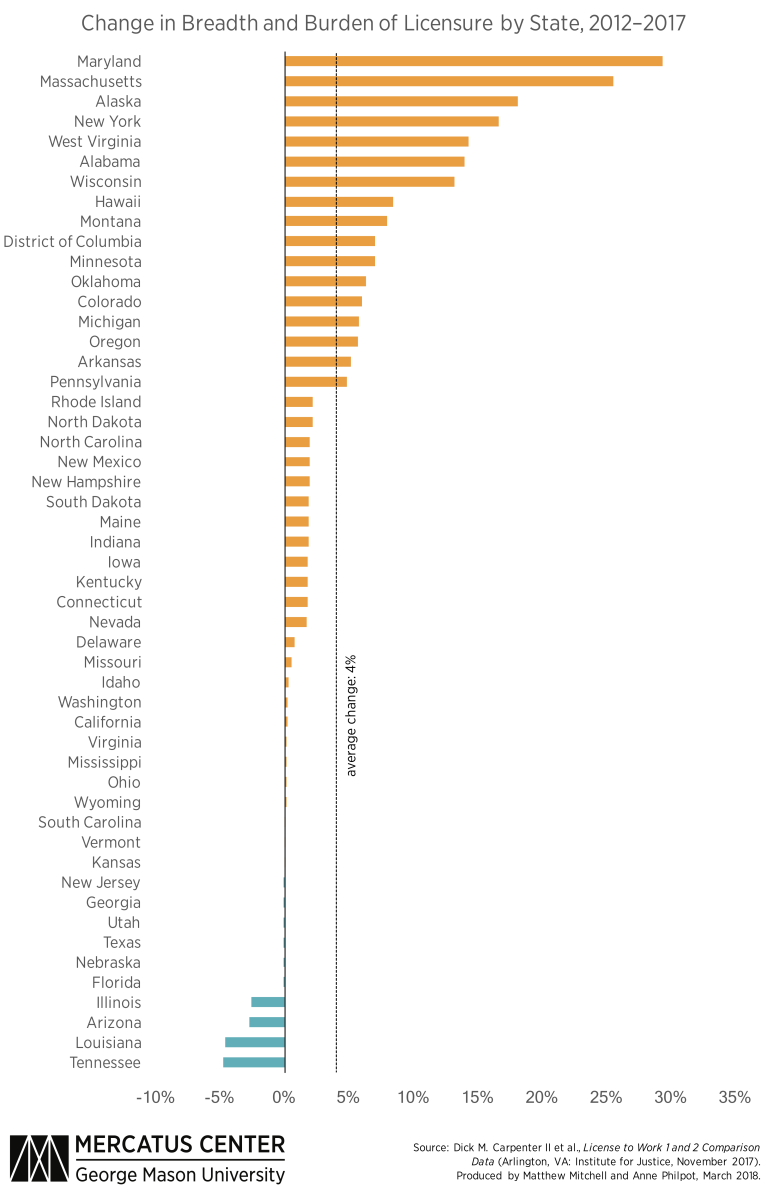
Note: Raw data were collected by the Institute for Justice in 2012 and prior years and in 2017 and prior years and is available in Dick M. Carpenter II et al., License to Work 1 and 2 Comparison Data (Arlington, VA: Institute for Justice, November 2017). The “breadth and burden” measure and its change over time was calculated by the authors following IJ’s methodology in its 2017 report. For details on that methodology, see Dick M. Carpenter II et al., License to Work: A National Study of Burdens from Occupational Licensing, 2nd ed. (Arlington, VA: Institute for Justice, November 2017), 201–202.
This breadth and burden measure accounts for both the stringency of occupational licensing requirements in each state (the burden), as well as the number of occupations that the state licenses (the breadth). The burden, in turn, encompasses five factors: (1) the minimum required grade level, (2) the minimum required age, (3) the required number of exams, (4) the required fees, and (5) the required number of days in training and experience. The figure indicates each state’s percentage change in breadth and burden of licensure across the IJ dataset’s 46 occupations over the 2012–2017 time period. Among the 50 states and the District of Columbia, 41 saw an increase in the breadth and burden of licensure over this time period, though for many of these, the change was negligible. Only 10 states decreased the breadth and burden of licensure among these occupations over this time period, and among only 4 of these states was the change significant. The average state increased the breadth and burden of licensure of these occupations by 4 percent over this time period.
Net Increases
Next we discuss the states with the largest changes over these five years and explore the sources of these changes.
The following five states had the biggest net increases in the breadth and burden of licensure:
- Maryland’s breadth and burden of licensure increased 29 percent over the past five years. The state now regulates five more occupations than it did in 2012: animal breeders, athletic trainers, and three types of gaming occupations. Fees for existing licenses rose by an average of 6 percent, and days lost to education or experience requirements increased by 3 percent.
- Massachusetts added four licenses, including those for dental assistants and funeral attendants, professions that are rarely licensed.
- Alaska added two new licenses since 2012: athletic trainers and massage therapists. By raising fees 7.5 percent, it also imposed greater burdens on the occupations it already licensed.
- New York now licenses three more occupations—gaming supervisor, gaming dealer, and gaming cage worker—growing its overall breadth and burden by 17 percent.
- West Virginia added athletic trainer and sign language interpreter to the list of licensed occupations. On average, the state’s existing occupations saw steady increases in minimum age (3 percent), exams (2 percent), fees (5 percent), and days lost to education and experience (4 percent).
Net Decreases
By comparison, some states made small improvements to their licensing practices in the last five years:
- Tennessee reduced the breadth and burden of its licensing by 5 percent, including the repeal of its animal breeder license requirement.
- Louisiana dropped its license requirement for home entertainment installers, but it still leads the nation in total number of low-income occupations licensed (77).
- Arizona eliminated one license requirement (packer) and reduced exam and minimum age requirements in select occupations. Overall, it reduced its breadth and burden by 3 percent, but it still ranks among the most burdensome licensing regimes.
- Illinois also decreased its breadth and burden by 3 percent, eliminating its license requirement for farm labor contractors.
While some states show promise for reform, the past five years indicate that licensing continues to grow. Advocates claim that licensing increases quality of service, but there is little to no evidence of this effect. Instead, licensing imposes high regulatory burdens that create barriers to employment and increase prices for everyone. Far more can be done to reduce these hurdles for both workers and consumers.