- | Corporate Welfare Corporate Welfare
- | Data Visualizations Data Visualizations
- |
The State of Certificate-of-Need Laws in 2016

Since they were first instituted in 1964, certificate-of-need (CON) laws have experienced a number of changes over the past 52 years—from the mild growth in the 1960s and the federal mandate that every state enact CON laws in the 1970s to the federal reforms and subsequent repeals of the 1980s, along with more recent reform efforts. Recent efforts to compile these laws have been conducted by the American Health Planning Association (AHPA) in 2011 and the National Conference of State Legislatures (NCSL) in 2016. Using the most up-to-date data, we improve upon these efforts by providing a single, comprehensive resource to understand the current status of CON laws in the 50 states and the District of Columbia—and to note how states compare with each other.
Our 2016 data has been compiled from state laws, current regulatory documents, agency forms, and direct communication with regulators in each state.
Comparing our current data with the NCSL's 2011 data sheds some light into how these laws have changed (or not) over the past five years. In 2011, CON laws were enforced in 37 states and the District of Columbia. In 2016, CON laws are enforced in 35 states and the District of Columbia. Both Wisconsin and New Hampshire no longer enforce CON laws.
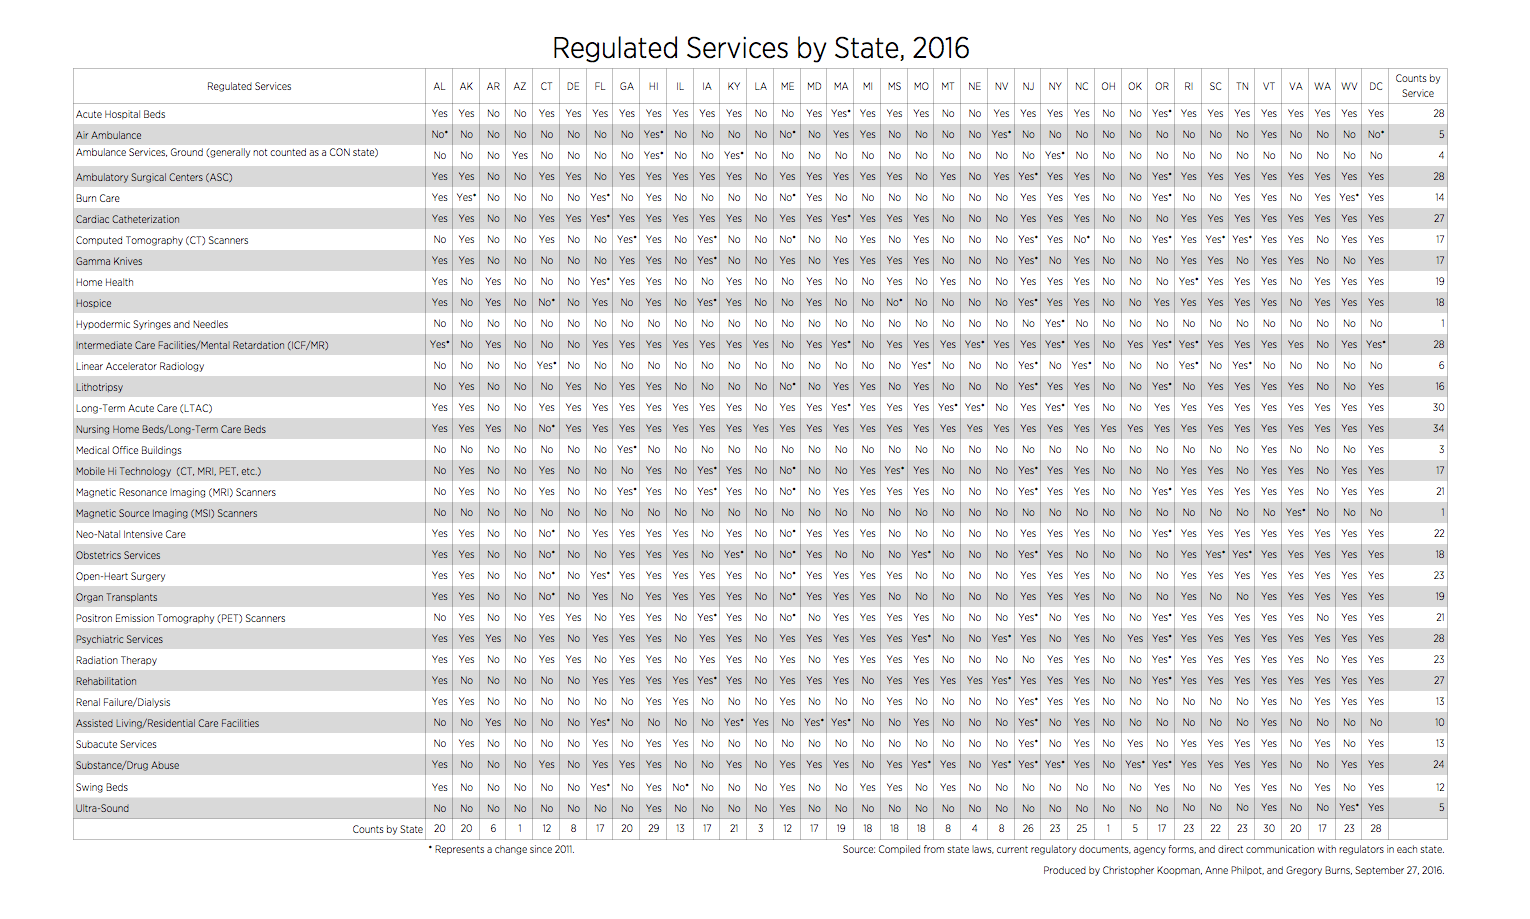
While there are two fewer states with CON laws, the first table (“Regulated Services by State, 2016”) shows there has been a net increase in the number of items that require a certificate of need. In 2011, 538 total items required a CON. In 2016, 589 total items require a CON.

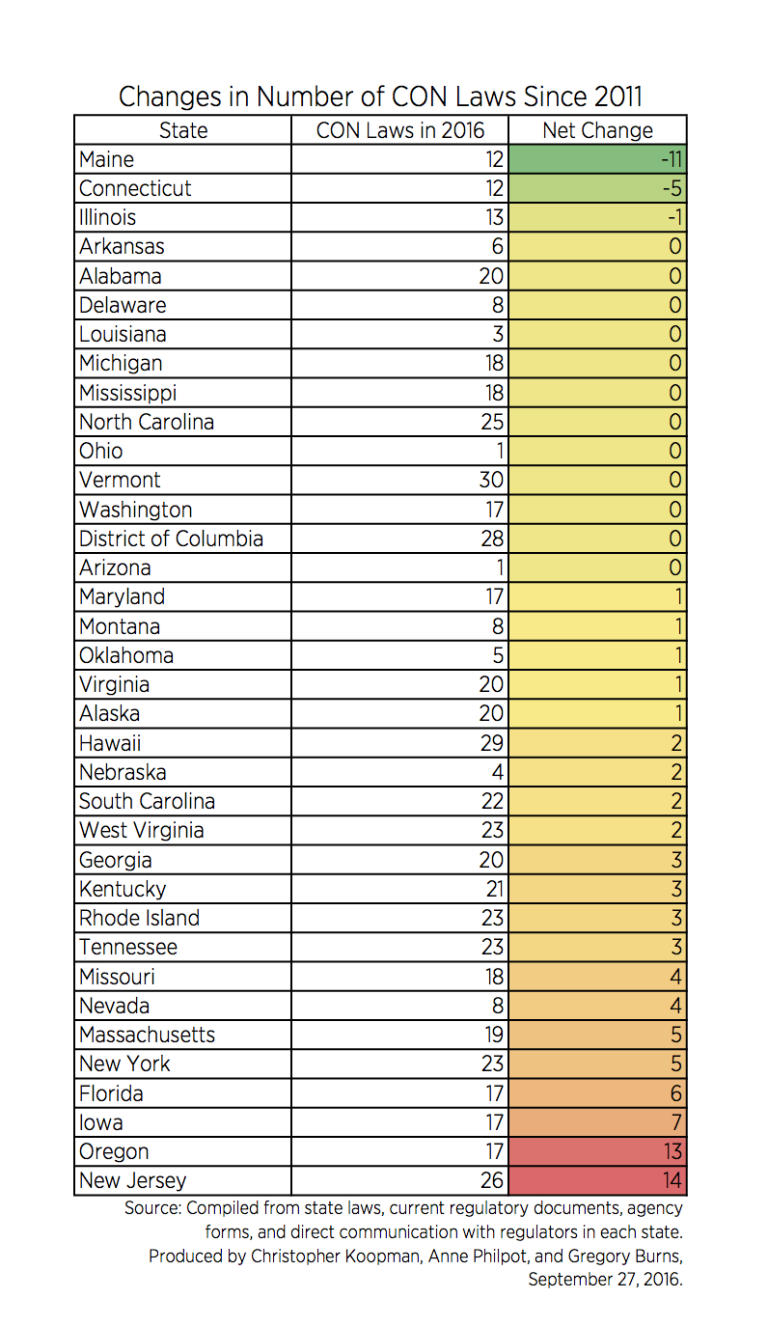
As the second table (“Changes in Number of CON Laws Since 2011”) shows, the increase in covered items is primarily driven by five states—Massachusetts, New York, Florida, Iowa, Oregon, and New Jersey—which accounted for an increase in 50 covered items combined. Only three states—Maine, Connecticut, and Illinois—have seen a reduction in the number of covered items since 2011. Of the remaining 27 states, 13 states went unchanged and 14 states added four or fewer items.
Two factors seem to be driving these changes. The first is simply changes in the law, which would not be surprising given the amount of attention CON laws have received in a number of states over the past five years. The second is differences in the way the data have been compiled. The AHPA data was collected using surveys of state CON regulators. Our data was primarily sourced using what the laws say in each state. As a result, the current increases (and decreases) could represent the difference between what regulators believed their program covered and what the law actually stated.
Regardless of the reasons, this finding is disappointing. In particular, while these laws are justified by a number of claims, the evidence demonstrates these laws have failed to achieve their goals and have a number of negative, unintended consequences for competition, innovation, and patient welfare.
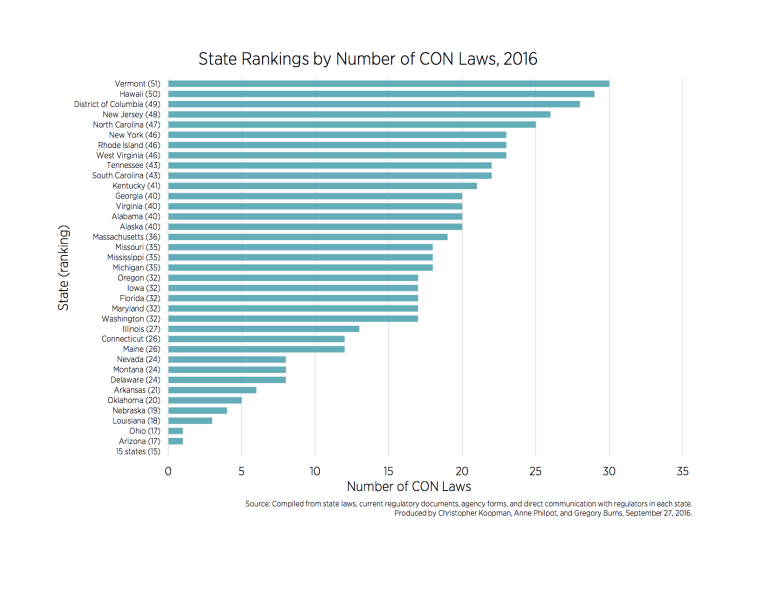
Where do the states rank according to this new data? There are now 15 states that no longer regulate health care via a CON program. For those states that continue to regulate via a CON program, some states have seen their ranking change dramatically. As the updated ranking (“State Rankings by Number of CON Laws, 2016”) shows, Maine makes the biggest jump: it was ranked 47th in 2011 and is now ranked 25th. New Jersey took the biggest step backward: it was ranked 28th in 2011 and is now ranked 48th. Vermont, Hawaii, and Washington, DC, have held on to their positions as the three most restrictive states, and finished the 2016 ranking ranked 51st, 50th, and 49th, respectively.
While there is some evidence of change in the right direction, the fact remains that nearly two-thirds states continue to restrict entry, expansion, and competition in healthcare through CON laws. Clearly there is more work to be done in explaining to legislators and healthcare policymakers about the potential limiting effects these laws have on achieving high-quality, low-cost healthcare.
Related Content
- | Corporate Welfare Corporate Welfare
- | Data Visualizations Data Visualizations
40 Years of Certificate-of-Need Laws Across America

- | Corporate Welfare Corporate Welfare
- | Working Papers Working Papers
Certificate-of-Need Laws and Hospital Quality
- | Corporate Welfare Corporate Welfare
- | Expert Commentary Expert Commentary