- | Housing Housing
- | Policy Briefs Policy Briefs
- |
Beyond Unemployment: Pennsylvania's Sluggish Labor Market
While the Great Recession had a moderately less severe impact on Pennsylvania than on the nation as a whole, the state’s recovery since the height of the recession has been slower than the national average. Sluggish economic growth is slowing the pace of the state’s labor market recovery.
While the Great Recession had a moderately less severe impact on Pennsylvania than on the nation as a whole, the state’s recovery since the height of the recession has been slower than the national average. Sluggish economic growth is slowing the pace of the state’s labor market recovery. Most sectors in Pennsylvania have yet to rebound to prerecession levels. Employment in one sector—mining and logging—has experienced massive growth from a surge in oil and gas drilling, extraction, and support jobs. Lowering or eliminating Pennsylvania’s corporate tax rate, implementing a right-to-work law, and streamlining the state’s drilling regulations could stimulate more economic growth and job creation in the Keystone State.
THE GREAT RECESSION’S IMPACT ON PENNSYLVANIA’S LABOR MARKET
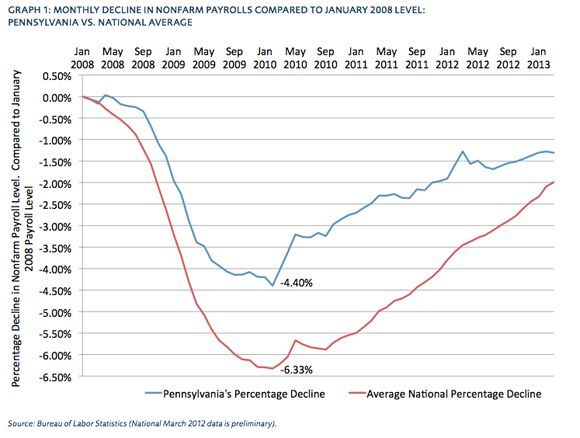
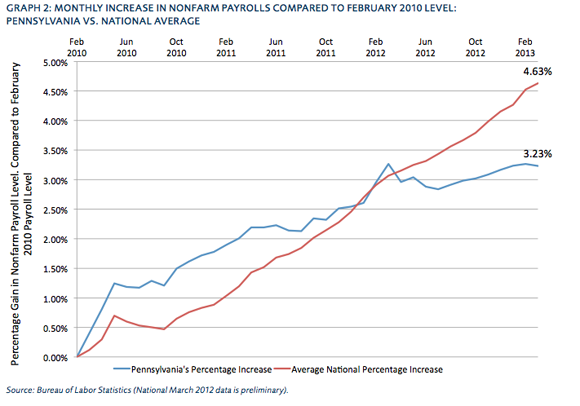
During the Great Recession, Pennsylvania experienced a lower peak unemployment rate than the nation as a whole—8.7 versus 10.0 percent.[1] Between the end of 2007 and early 2010, Pennsylvanian nonfarm payroll jobs declined by 4.40 percent, compared to a 6.33 percent decline nationwide (see Graph 1). However, between February 2010, when nonfarm payroll jobs were at their lowest recession level, and March 2013 the number of nonfarm payroll jobs in Pennsylvania grew only 3.23 percent (see Graph 2). Nationally, total nonfarm payroll jobs increased 4.63 percent—noticeably faster than the pace of Pennsylvania’s recovery.
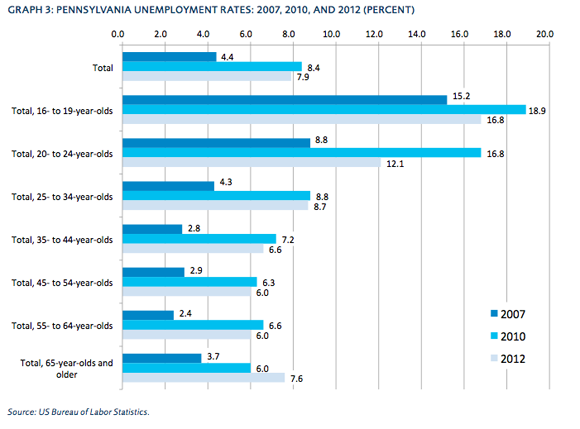
Pennsylvania’s postrecession rate of job loss is now approaching the national average (see Graph 1). Pennsylvania has recovered only about 70.2 percent of the nonfarm payroll jobs it lost during the recession[2] while nationally only about 68.6 percent of lost nonfarm payroll jobs have been recovered.[3]Pennsylvania’s 7.9 percent 2012 unemployment rate has not improved significantly since 2010 and still rests well above the prerecession 2007 rate of 4.4 percent (see Graph 3). Unemployment rates for all age groups exceed prerecession levels.
AN UNEQUAL RECOVERY
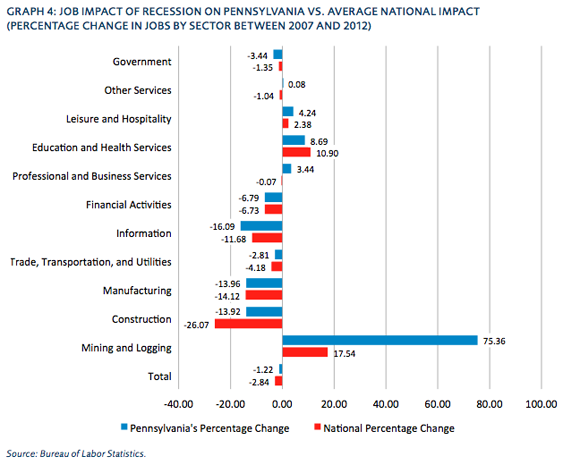
Pennsylvania’s labor market recovery has been unequal between different sectors (see Graph 4). The state’s trade, transportation, and utilities sector—which makes up almost one-fifth of the state’s nonfarm payroll jobs[4]—has still not fully recovered to 2007 levels of employment. There are roughly 14 percent fewer jobs in Pennsylvania’s construction and manufacturing sectors, which before the recession made up almost 16 percent of the state’s total nonfarm payroll jobs.[5] However, these three sectors are outperforming the national rate of recovery, and the state’s construction sector has lost jobs at a significantly lower rate than the national average.
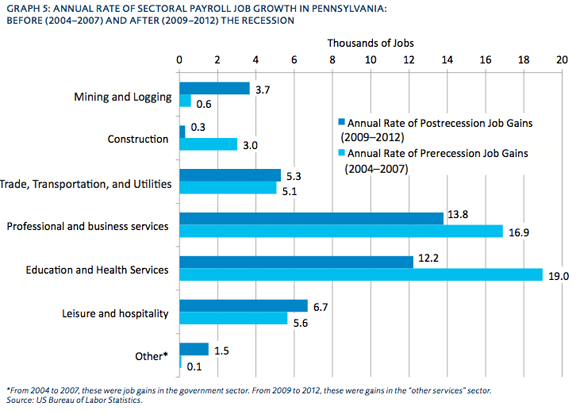
Over half of Pennsylvania’s nonfarm payroll jobs exist in its three largest sectors—trade, transportation, and utilities; professional and business services; and education and health services.[6] Before the recession (between 2004 and 2007) almost 82 percent of the state’s annual job gains, approximately 41,000 jobs per year, were created in these sectors (see Graph 5). From 2009 to 2012 just under 72 percent of annual job gains, approximately 31,300 jobs per year, were created in these sectors. The annual rate of job gains in Pennsylvania’s three largest sectors has slowed almost 25 percent since before the recession.
Just four sectors in Pennsylvania—education and health services; leisure and hospitality; professional and business services; and mining and logging—have realized significant net job gains since 2007 (seeGraph 4). Three—leisure and hospitality, professional and business services, and mining and logging—are outperforming the national sector rate of job gains. Mining and logging is by far Pennsylvania’s fastest-growing sector. In 2012, there were about 75 percent more mining and logging jobs in the state than existed in 2007.
THE SHALE SURGE
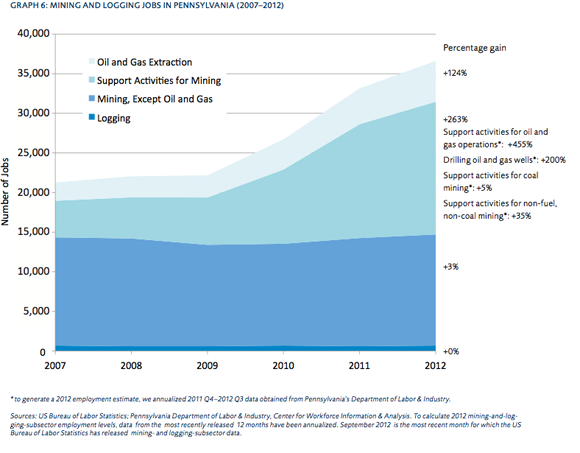
Mining and logging job gains in Pennsylvania have been primarily driven by increases in oil and natural gas extraction, drilling, and support activities jobs (see Graph 6). Since 2007, the rapid growth in drilling and extraction jobs—200 and 124 percent gains, respectively—has facilitated a massive 455 percent increase in support activity jobs for oil and gas operations. Pennsylvania’s mining and logging sector job gains made up approximately 12.5 percent of all new mining and logging jobs created in the United States between 2007 and 2012.[7]
These gains have in large part occurred because of the introduction of horizontal drilling technology and hydraulic fracturing to shale oil fields.[8] Increased drilling activity in the Marcellus shale formation, which covers northern and southwestern Pennsylvania, has helped increase Pennsylvania’s daily natural gas production over 500 percent since 2009.[9] A recent study conducted by a team of researchers at Pennsylvania State University finds that by 2020, daily natural gas output from the Marcellus Shale could likely grow an additional 175 percent and as many as 75,000 new Marcellus-supported jobs are estimated to be created in Pennsylvania.[10]
EXPLAINING THE SLOW RECOVERY AND ACCELERATING ITS PACE
Despite growth in the mining and logging sector, Pennsylvania’s real GDP grew just 1.2 percent in 2011, and Pennsylvania’s average state personal income grew just 1.5 percent in real terms in 2012—the 27th lowest rate of state personal income growth in 2012.[11]
This slow economic growth is impeding Pennsylvania’s labor market recovery. Comparatively high tax rates may be stifling the state’s economic growth.
Pennsylvania’s statutory corporate income tax rate is the second highest in the country at 9.99 percent.[12] Its effective corporate tax rate (the statutory rate minus deductions) is higher than all other states’.[13] Combined with the federal rate, Pennsylvania’s corporate tax rate may be, according to Pennsylvania’s secretary of revenue, the highest in the world.[14] Policymakers should consider lowering or eliminating the state’s corporate income tax. Corporate income taxes have a highly negative effect on economic growth and reducing the rate by just 1 percent can increase annual GDP growth by 0.1 to 0.2 percent.[15] Lowering or eliminating the corporate tax rate would make Pennsylvania more competitive with neighboring Ohio—which has no corporate income tax—and Maryland, New York, and New Jersey—which all have lower rates.[16] In 2010, the state’s corporate income tax accounted for just 3.7 percent of total state and local revenue.[17] Eliminating or reducing the corporate tax rate is fiscally feasible for the commonwealth.
In the Mercatus Center’s recent Freedom in the 50 States report, William Ruger and Jason Sorens score Pennsylvania’s regulatory environment below the national average.[18] One reason for their score is Pennsylvania’s lack of a right-to-work law. Studies show that these laws are likely to increase economic growth and are associated with higher employment levels.[19] To improve the state’s labor market, policymakers should consider adopting a right-to-work law in the Keystone State.
Complicated, expensive drilling regulations may be holding back job creation in Pennsylvania’s high-growth drilling sector. Drilling fees alone cost firms roughly $204 million in 2012.[20] Seven agencies regulate drilling in Pennsylvania through a maze of about 50 separate state regulations.[21] Experts claim that the cost to develop natural gas is made higher in Pennsylvania because of the state’s comparatively more complex regulatory environment.[22] Fortunately, Pennsylvania does not impose a natural gas severance tax, and the absence of such a tax offsets some of the costs associated with Pennsylvania’s comparatively complicated regulations.[23] Policymakers should avoid implementing a severance tax and focus on streamlining Pennsylvania’s complicated drilling regulations, which, according to one estimate, are a large reason why drilling is 20 to 30 percent more expensive in Pennsylvania than in other states.[24] These policies would likely stimulate even more drilling in Pennsylvania, and research links increased municipal drilling activity with less unemployment.[25]
CONCLUSION
Some of Pennsylvania’s largest sectors are still struggling to recover from the Great Recession. The annual rate of job growth for the state’s three largest sectors has slowed almost 25 percent since before the recession. Job gains in historically smaller sectors of the state’s labor market are helping drive Pennsylvania’s recovery. Gains in mining-and-logging-sector employment have added about 15,900 new jobs to the state since 2007, and studies estimate that by 2020 as many as 75,000 additional jobs may be created due to growth in this sector. Nevertheless, slow economic growth in Pennsylvania is preventing a more rapid recovery. Streamlining drilling regulations, implementing a right-to-work law, and—most importantly—lowering or eliminating the state’s extraordinarily high corporate tax rate could accelerate economic growth and facilitate a more rapid labor market recovery.
ENDNOTES
- US Bureau of Labor Statistics. The national, seasonally adjusted unemployment rate peaked in October 2009 at 10.0 percent while Pennsylvania’s seasonally adjusted unemployment rate peaked in February and March 2010 at 8.7 percent.
- US Bureau of Labor Statistics. In January 2008, there were 5.8225 million nonfarm payroll jobs (seasonally adjusted) in Pennsylvania. The number of nonfarm payroll jobs bottomed out in February 2010 at 5.5664 million nonfarm payroll jobs. By March 2013, there were 5.7463 million nonfarm payroll jobs in Pennsylvania.
- US Bureau of Labor Statistics. In January 2008, there were 138.056 million nonfarm payroll jobs (seasonally adjusted) nationwide. The number of nonfarm payroll jobs bottomed out in February 2010 at 129.320 million nonfarm payroll jobs. By April 2013, there were 135.309 million nonfarm payroll jobs in the United States.
- US Bureau of Labor Statistics.
- Ibid.
- Ibid.
- Ibid.
- US Energy Information Administration, “Horizontal Drilling Boosts Pennsylvania’s Natural Gas Production,” May 2012, http://www.eia .gov/todayinenergy/detail.cfm?id=6390.
- See US Energy Information Administration, “Pennsylvania Drives Northeast Natural Gas Production Growth,” August 2011, http://www.eia.gov/todayinenergy/detail.cfm?id=2870. See also US Energy Information Administration, “Pennsylvania Natural Gas Production Rose 69% in 2012 Despite Reduced Drilling Activity,” March 2013, http://www.eia.gov/todayinenergy/detail.cfm?id=10471.
- For 2012 daily natural gas output levels, see ibid. For 2020 estimates, see Timothy J. Considine et al., “The Pennsylvania Marcellus Natural Gas Industry: Status, Economic Impacts and Future Potential,” July 2011, 31, http://marcelluscoalition.org/wp-content/uploads/2011/07/Final-2011-PA-…;
- Bureau of Economic Analysis, US Department of Commerce.
- See Tax Foundation, State Corporate Income Tax Rates, 2000–2013, http://taxfoundation.org/article/state-corporate-income-tax-rates-2000-….
- See Public Hearing on Governor Corbett’s Tax Reform Proposal Before the Pennsylvania House Finance Committee (April 2013) (testimony of Tom Bowen, on behalf of the Pennsylvania Chamber of Business and Industry), 5n2, http://www.legis.state.pa.us/cfdocs/legis/TR/transcripts/2013_0072_0009…
- The top federal corporate income tax rate is 35.0 percent. Ibid. See Pennsylvania Department of Revenue, “Tax Reform Initiative Focuses on Creating Jobs, Improving PA Business Climate, Growing Personal Income,” April 11, 2013, 2, http://www.portal.state.pa.us/portal/server.pt/document/1331485/tax_ref…;
- Åsa Johansson et al., “Taxation and Economic Growth,” (OECD Economics Department Working Papers, No. 620, 2008), Table
- Tax Foundation, Tax Rates, n12.
- Elizabeth Malm and Ellen Kant, Tax Foundation, “The Sources of State and Local Tax Revenues,” http://taxfoundation.org/article /sources-state-and-local-tax-revenues.
- William Ruger and Jason Sorens, Freedom in the 50 States (Arlington, VA: Mercatus Center at George Mason University, March 2013).
- See Richard Vedder, “Right-To-Work Laws: Liberty, Prosperity, and Quality of Life,” Cato Journal 30 (2010), http://papers.ssrn.com /sol3/papers.cfm?abstract_id=2256469. For a review of various studies on the effects of right-to-work laws on industrial growth and employment, see William J. Moore, “The Determinants and Effects of Right-To-Work Laws: A Review of Recent Literature,” Journal of Labor Research 19 (1998): 445. For a study on the relationship of right-to-work laws and employment, see Paul Kersey, Mackinac Center for Public Policy, “The Economic Effects of Right-To-Work Laws: 2007,” 2007.
- Pennsylvania Public Utility Commission, Annual Report of Fund Revenue and Disbursements, December 2012, 4, http://www.puc .state.pa.us/NaturalGas/pdf/MarcellusShale/Gas_Well_Admin _Rpt_123112.pdf.
- Governor’s Marcellus Shale Advisory Commission, Report, July 2011, 49–55, http://www.marcellus.psu.edu/resources/PDFs /MSACFinalReport.pdf.
- Considine, “Marcellus Natural Gas Industry,” n10.
- Ibid., 3.
- Katrina M. Currie and Elizabeth B. Stelle, “Pennsylvania’s Natural Gas Boom: Economic & Environmental Impacts,” Commonwealth Foundation, June 2010, 3, http://www.commonwealthfoundation .org/doclib/20100607_marcellusshaledrilling.pdf.
- Diana Furchtgott-Roth and Andrew Gray, “The Economic Effects of Hydrofracturing on Local Economies: A Comparison of New York and Pennsylvania,” Manhattan Institute, May 2013, http://www .manhattan-institute.org/pdf/gpr_1.pdf.
Related Content
- | Government Spending Government Spending
- | Data Visualizations Data Visualizations
Government-Financed Employment and the Real Private Sector in the 50 States

- | Government Spending Government Spending
- | Policy Briefs Policy Briefs
A Tale of Two Labor Markets: Government Spending's Impact on Virginia
- | Housing Housing
- | Policy Briefs Policy Briefs
Beyond Unemployment: The Full Labor Market Picture of Ohio
- | Data Visualizations Data Visualizations
Better Measures of Unemployment
