- | Government Spending Government Spending
- | Working Papers Working Papers
- |
Controlling Federal Spending
Using Past Budgets as Guides for Spending Restraint
This paper considers using the 2000 and 2008 federal budgets to (i) understand how and where spending rose and is projected to rise and (ii) how spending might be checked in order that future budgets

Abstract
This paper considers using the 2000 and 2008 federal budgets to (i) understand how and where spending rose and is projected to rise and (ii) how spending might be checked in order that future budgets resemble the 2000 or the 2008 budget. These are significant benchmark budgets since fiscal 2000 was one of the last years of an approximately balanced budget and fiscal 2008 was just prior to the rapid run up in spending and deficits beginning in fiscal 2009. In other words, we consider whether the rise in spending from 2000 to 2008 and then again from 2008 and beyond can be prudently rolled back. Naturally, various exigencies that have occurred since 2000 must be considered in this analysis. The goal is to develop simple and straightforward ideas in this regard that are focused on short-term budget restraint. Long-term budget restraint will likely require more fundamental reforms.
The focus is on spending reductions from the Office of Management and Budget's (OMB) projected 2012 budget. Several simulated budgets for 2012 are presented, based on either the 2000 budget or the 2008 budget and allowing for the growth in the economy, for inflation, and for population growth. Emulating the 2000 budget (as a share of GDP or in real per capita terms) for non-defense discretionary spending and "other mandatory" spending (excluding Social Security, Medicare, and Medicaid) yields a significantly lower budget than OMB's 2012 projection. Restraining real per capita spending to their 2008 levels for Social Security, Medicare, and Medicaid also leads to a substantially lower 2012 budget. These and other simulations are presented, with one simulation resulting in a nearly balanced budget, with simulated spending and OMB projected tax revenue for 2012 both under 19% of GDP.
The feasibility of reducing spending significantly below the 2012 OMB projections is discussed, with reference to related literature and the experiences of other countries in dealing with budget crises.
I. Introduction
The rapid rise in federal spending and the associated increase in federal deficits have caused great concern in many quarters. This concern is heightened by the administration's projections of continued higher than normal spending and deficits, with the further accumulation of federal debt.1 Practical people of all political persuasions understand that this state of affairs is problematic. As the federal debt amasses, credit markets are expected to be increasingly wary of U.S. Treasury securities, with the possibility of debt downgrades and the associated unwelcome events. Also, it is well recognized that there are limits to the effectiveness of raising taxes to close deficits. Higher levels of taxation generate incentives that lead to reductions in economic activity and a shift toward tax-favored activities. These distortions lead to reduced economic welfare and smaller increases in tax revenue.2 To avoid these undesired outcomes, this paper addresses the control of federal spending as a means of deficit reduction.3 It seems that this is an issue of some urgency, so we focus on simple and straightforward ideas that might be implemented in the short term.
In particular, we look to selected past budgets as possible templates for understanding and for restraining projected high levels of spending in the near future. Specifically, the years we focus on are 2000, 2008, and 2012. Fiscal 2000 was one of the last years with a budget surplus. Spending rose rather steadily through fiscal 2008, but this was the last year before the recent rapid increase to historically high peacetime levels of spending and deficits. We use 2000 and 2008 for guidance in how spending might be restrained in fiscal 2012. We examine where spending rose so rapidly from 2000 to 2008 and then after 2008 and consider whether those increases can be prudently rolled back. Thus, for example, we determine what spending in fiscal 2012 would be like if we replicate the 2000 budget as a share of GDP or in real per capita terms. Also, we do so for all and for parts of the budget. A similar exercise can be done using the 2008 budget as a baseline.
Projections for the 2012 budget continue to show an elevated level of spending. This is true even though a number of somewhat exogenous factors often cited to explain the unusually high spending of recent years will be absent or diminished by 2012. Spending on TARP and the stimulus package will have ended and defense spending is scheduled to wind down. Also, it is anticipated the economic recovery will have taken hold by then, thus elevated levels of certain types of spending associated with recessions (e.g., unemployment insurance, food stamps, Medicaid) will have concluded. Thus, fiscal 2012 seems ripe for consideration of significant budget restraint.4
Various budget scenarios for 2012 are simulated using both the 2000 and 2008 budgets as guidance, with adjustment for events since 2000 that have significant budgetary impacts. The simulations generate substantially less spending than the 2012 Office of Management and Budget projection, with much smaller deficits, and one of the simulations nearly eliminates the deficit.
Economic forecasts predict a recovery continuing through 2012, and, by nature of an economic recovery, tax receipts will rise even without any tax rate increases. We consider the recovery to be an exogenous factor, but one which contributes to deficit reduction.5 However, the exercise of this paper is not simply to consider deficit reduction, but rather spending restraint. The true cost of government to the private sector is the level of government spending, regardless of how it is financed. If the government spends $3 trillion, that means it acquires and allocates $3 trillion worth of resources that come from the private sector. Regardless of its method of finance, its opportunity cost is $3 trillion of privately produced goods and services.6 Thus, we consider deficit reduction via spending restraint with tax revenue increasing simply by virtue of recovery from the recession and without tax rate increases.
Though this essay is addressed to practical people of all political stripes, those who embrace a limited-government view also will find the analysis useful. Those of this viewpoint want more fundamental reform in federal spending, with careful consideration of the appropriate role of government in any expenditure decision. But suggestions here can be viewed as a short-term fix to controlling federal spending, with fundamental reform dealing with long-term spending restraint.
The organization of the rest of the paper is as follows. Section II gives some background, with a review of the time path of federal spending, having particular focus on recent years and comparisons of 2000, 2008, and 2012. Spending increases relative to the size of the economy from 2000 to 2008 are shown, as are projected increases from 2008 to 2012.
Section III presents the main simulations and analysis. We show how the 2000 budget, if moved forward to 2012 either as a constant fraction of GDP or as the same real value per capita, would result in dramatically lower spending than the Office of Management and Budget (OMB) projection. We also consider events since 2000 that might make it infeasible to restore a version of the 2000 budget, including the defense buildup relating to the wars in Afghanistan and Iraq, greater commitments to entitlement programs due to the aging of the population, and the enactment of the Medicare prescription drug benefit. Other simulations that allow for budgetary growth for these reasons, yet still retaining guidance from the 2000 and 2008 budgets, are presented. They show spending lower than the 2012 OMB projection of $3,755.0 billion by $370 billion to $685 billion. The latter simulation nearly eliminates the projected deficit based on OMB's tax revenue projection.
This section also discusses the feasibility of attaining spending as indicated by the simulations. It is pointed out that many of the spending categories would continue to spend as in fiscal 2008 or 2009, while others would have spending similar to years earlier in the 2000s. None of this could be called draconian spending levels. Lastly, section IV concludes the paper. It is noted that though the paper is addressed to short-term budget issues, long-term budget problems will be need to be dealt with by more fundamental reform. Nevertheless, short-term budget restraint can provide a strong signal that the U.S. is serious about dealing with deficits and provide a bridge to deeper reform.
II. Some Background
A. A Brief Historical Perspective
A common way to measure federal spending is to express it as a share of GDP. Though this is not the only sensible measure of federal spending, it is quite informative. During the forty years from 1969 through 2008, federal spending averaged 20.6% of GDP. Though there was variation around this mean, most fiscal year spending during this time period was between 19% and 23% of GDP. The highest level of federal spending in the postwar era was in the war builddown year of 1946 when spending was 24.8% of GDP. In the late 1940s, the 1950s, and the 1960s, federal spending remained below the 1969-2008 average noted above.
Figure 1 presents the more recent history of federal expenditures, along with projections of future spending shares. This figure charts the trends from 1990 forward, with both Office of Management and Budget (OMB) and Congressional Budget Office (CBO) projections for 2010 to 2020. As one can see, there was a downward trend in the 1990s of federal spending as a share of GDP, falling from around 22% of GDP at the beginning of the decade to about 18% in 2000. From 2001 forward, spending went steadily upward until it was nearly 21% in 2008.
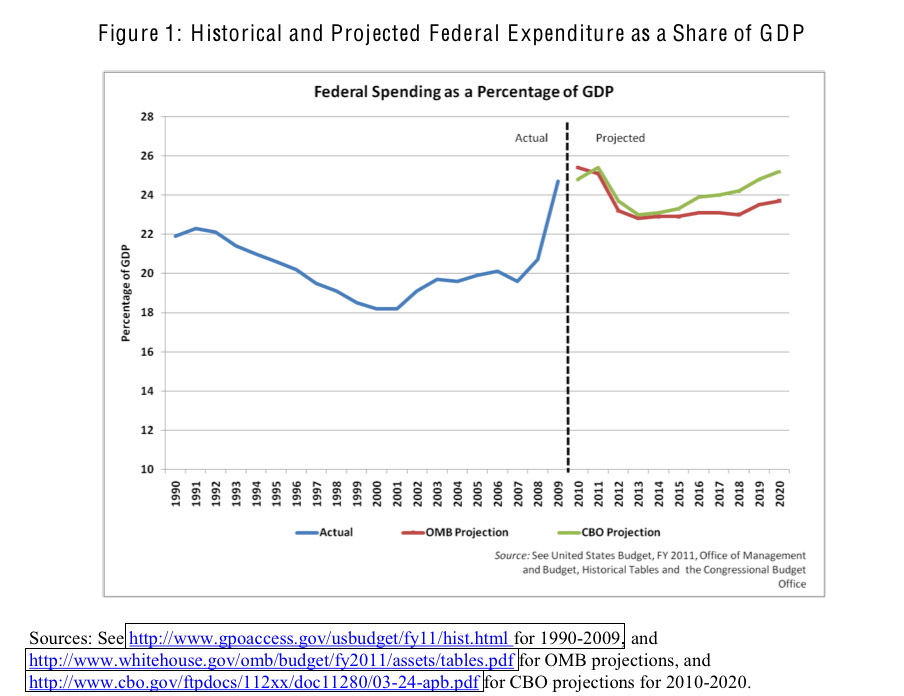
The year 2009 represents a major break in the path of federal expenditures. That year spending rose sharply to 24.7% of GDP and is forecast by OMB to remain near that level at 25.4% for 2010 and 25.1% in 2011. These are historically high levels of spending, matched in peacetime only by 1946. From 2012 forward, OMB's projection is for spending to be consistently around 23% of GDP, with CBO projecting it to be somewhat higher. Thus, if these projections come to 6 fruition, we will see a major run up in federal spending for three years, followed by a reduction, but to a level substantially above the previous trend.
B. Specific Years for Comparative Analysis
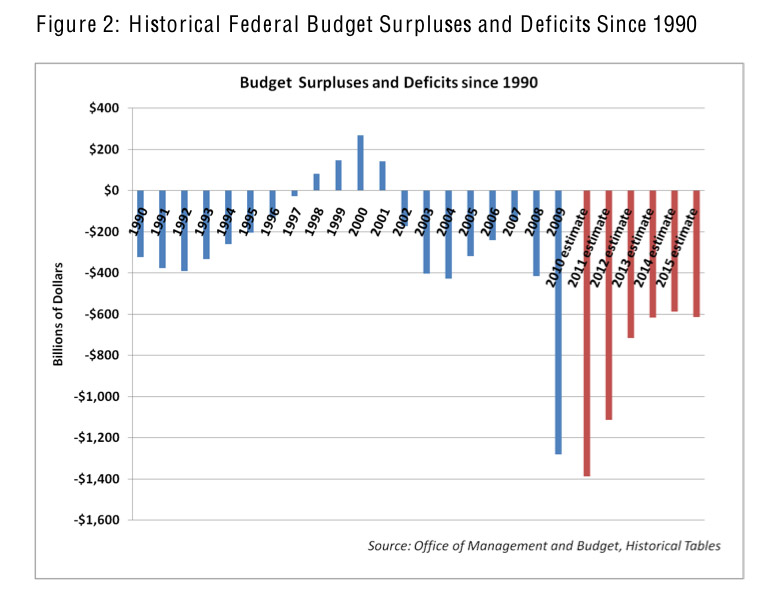
For more detailed analysis, three years are selected for specific focus. The years we select are 2000, 2008, and 2012. As we can see from Figure 2, which shows historical deficits in constant 2005 dollars, fiscal year 2000 was one of the last years with a budget surplus.
We compare spending in that year to both 2008 and 2012 to see how the replication of spending patterns can be instructive in determining why spending has risen and if it can be restrained simply by reverting back to previous budgets. Though fiscal 2008 showed substantially more spending than in 2000, it was the last year before the rapid upturn in federal spending, and comparison to projected spending for 2012 can be similarly informative. An advantage of this approach is that these are budgets actually enacted, implemented, and experienced in the recent past, one by a Democratic administration and another by a Republican administration. Though budgetary needs change over time, it would be difficult to label either budget as draconian or this approach as partisan.
Fiscal 2012 seems an appropriate year to target for comparisons and for serious budgetary reductions. Spending projections for 2012 still show a level of spending elevated beyond the historic norm, though below that of 2009, 2010, and 2011. The ramp up of federal spending due to TARP and the stimulus package will have concluded and defense spending is scheduled to wind down. Also, it is anticipated the economic recovery will have taken hold by then, thus elevated levels of certain types of spending associated with recessions (e.g., unemployment insurance, food stamps, Medicaid) will have concluded. Thus, by fiscal 2012 the justifications often given for unusually high spending of recent years will be absent and this year seems ripe for consideration for significant budget reductions.
Moreover, though it is possible that the 112th Congress (to be elected November 2010) can affect the 2011 budget, fiscal 2012 may be the first budget that it can have a major role in shaping. Also, fiscal 2012 is far enough in advance to plan for and implement, yet soon enough to send a strong signal to credit markets of the U.S. government's commitment to the soundness of its securities. This can have an immediate effect on the market prices of these securities.
C. Some Basic Comparisons
Table 1 below presents some basic data that will form the source of our comparisons of the three years' federal budgets. Budget totals are shown, along with four major categories of expenditure. These four categories are the following:
Mandatory. This is the largest of the categories and is spending required by a previously existing law. It is not controllable through the Congressional appropriations process, but only by enacting new legislation that alters current law. This category is predominantly comprised of "entitlement" programs, i.e., Social Security, Medicare, Medicaid, and income security programs.
Discretionary: Defense and Non-Defense. Discretionary spending is budget items that are controlled through the appropriations process. This is divided into two categories: spending on national defense and spending on non-defense programs. While national defense obviously is spending on defense programs, discretionary non-defense programs cover a wide range of activities. The largest of these include: education and training; international affairs; transportation; science, space, and technology; administration of justice; and non-mandatory health, income security, and veterans' benefits. Smaller parts of this budget category include spending on energy, natural resources, and the environment; agriculture, commerce, and housing; and community and regional development.
Net Interest. The final major category is net interest expense on the national debt. This is interest payments on U.S. securities held by parties outside the U.S. government.
An examination of Table 1 gives a sense of the changes in spending between 2000 and 2008 and the projected changes to 2012.7 The first three columns of this table show the nominal dollar budget (and major categories) for each of those years. The next three columns express those figures in constant 2009 dollars, using the GDP price index. The last three columns present the budget numbers as a share of GDP.
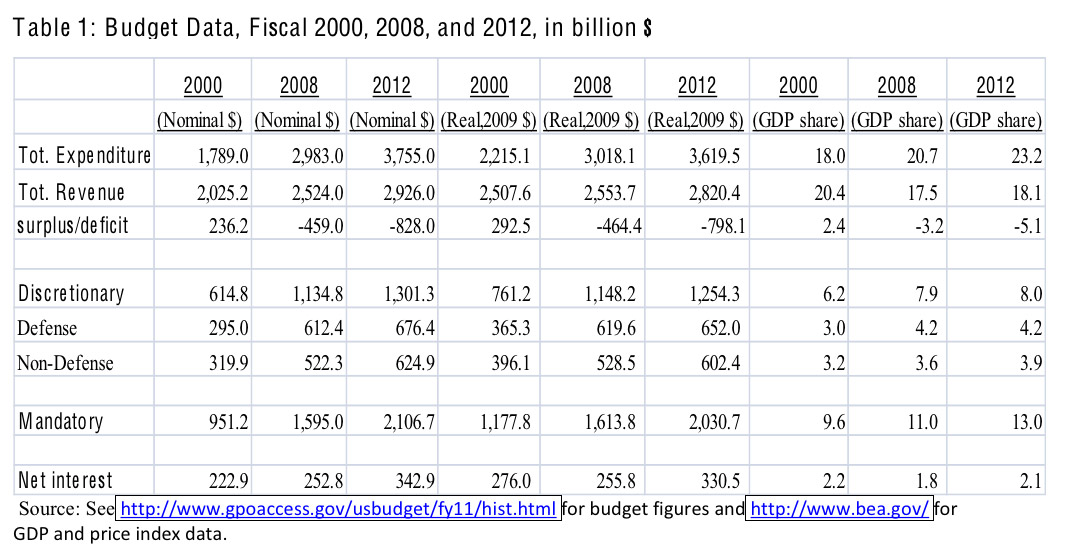
As is evident, total federal spending rose substantially from 2000 to 2008, both in nominal and real terms. In nominal terms, it rose by about $1.2 trillion and in real terms, the increase was $800 billion. OMB projections indicate a large increase in spending from 2008 to 2012. In nominal terms, this increase is projected to be almost $800 billion and in real terms, $600 billion.
Though spending grew substantially over these periods, the economy also grew (or is forecast to grow). This is one reason why it is informative to express the spending figures as a share of GDP. As one can see from the final three columns of Table 1, spending is growing substantially by this measure, from 18.0% of GDP in 2000, to 20.7% in 2008, to 23.2% in 2012. Mandatory spending, defense spending, and discretionary non-defense spending all rose in nominal and real terms, and as shares of GDP from 2000 to 2008.
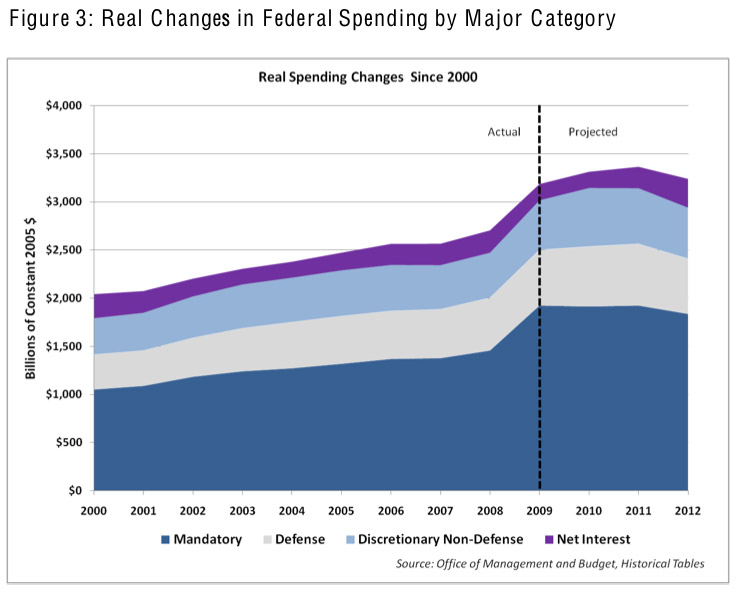
Spending in each of these categories is projected to continue to rise from 2008 to 2012, in nominal and real terms. Figure 3 illustrates this in constant 2005 dollars. Spending also rose from 2000 to 2008 as shares of GDP. The only exception is defense spending, which is projected to remain constant as a share of GDP.
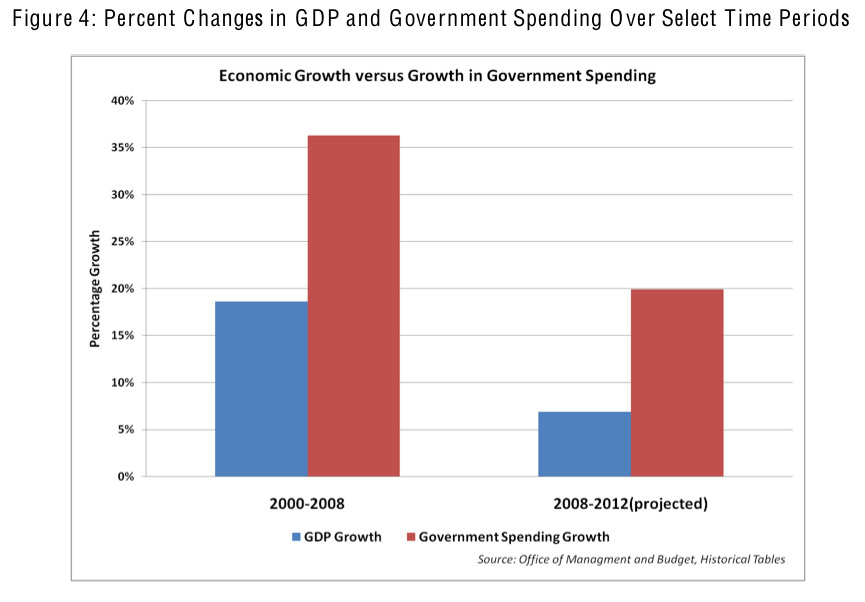
Table 2 presents another way to gain a sense of the rise in federal spending illustrated above. The first two rows of this table show what happened to real GDP during this time. Real GDP grew by 18.6% from 2000 to 2008 and is forecast by OMB to grow another 6.9% by 2012. The next two rows show that real spending grew by 36.3% from 2000 to 2008. Spending grew twice as fast as GDP during this time. Also, real federal spending is projected to grow by 19.9% from 2008 to 2012. This is nearly three times the growth of GDP.
The last four rows of Table 2 present similar figures on a per capita basis. They show that real GDP per capita rose by 9.9% from 2000 to 2008 but real per capita spending rose by 26.3%, over two and one-half times as fast. For 2008 to 2012, real per capita GDP is forecast to increase by 2.9%, but real spending per capita by 15.4%. Spending per capita is projected to grow over five times as fast as GDP per capita.

It is worth noting once more that the spending increases discussed here are up to 2012, which is past the peak in spending (or projected spending) for 2009, 2010, and 2011. Thus the reise described here is after the even larger increases in spending have passed.
III. Simulating Budget Reduction Scenarios
It is clear that current budgetary plans call for substantially more spending in 2012, despite absence of TARP or stimulus spending and the anticipated economic recovery and wind-down of defense spending. A natural question to ask is why spending levels are not budgeted to return to more normal levels. To address this, we make a simple comparison of 2000 spending patterns to 2012, consider events that lead to the spending increase between 2000 and 2008 and between 2008 and 2012, and given this, look for feasible budget restraint strategies.
A. A Simple Comparison of 2000 and 2012
We first consider what spending in 2012 would be like if the spending patterns of 2000 were replicated. Table 3 presents an illustration of this. The first column shows the 2012 OMB budget forecast for major expenditure categories, expressed in 2012 dollars. All values in this table are in 2012 dollars. Slightly more disaggregation is presented for mandatory spending because it will be useful for later discussion. This category is disaggregated into spending on Social Security, Medicare, Medicaid, and other mandatory, the latter of which is largely income security expenditures. Column 2 of Table 3 simulates the expenditure levels in 2012 if spending as a share of GDP becomes as it was in 2000. This is equivalent to the federal budget growing exactly as the economy grows from 2000 to 2012. As one can see, the simulation shows substantially lower values than the OMB projection.
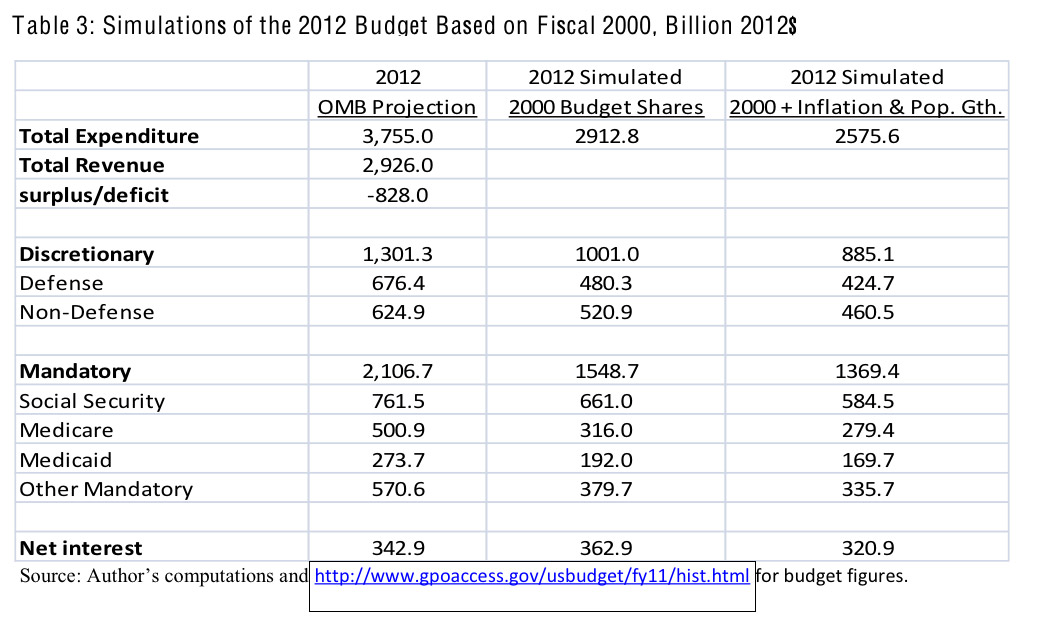
The overall level of spending in the simulation is $2,912.8 billion, over $800 billion lower than the $3,755.0 billion projection. If tax revenue were to remain as projected by OMB at $2,926.0 billion, this simulated level of spending would virtually eliminate the budget deficit. The simulated spending is substantially below the OMB projection for each major budget category except for net interest. The simulation shows about $200 billion less in defense spending, $100 billion less in discretionary non-defense spending, and over $550 billion less in mandatory spending. Before going further, consider another simulation.
Column 3 of Table 3 shows spending levels attained if the 2000 budget had grown only by inflation and population growth. This keeps real federal spending per capita at the same level as 2000. The differences between this simulation and the OMB budget are even more striking. Maintaining real per capita spending at 2000 levels entails total federal expenditure of $2,575.6 billion, compared to the $3,755.0 billion projection. Such large differences exist for each major expenditure category except for net interest.
B. Why Are We Spending More? Events Affecting Spending
Are either of these simulations useful guides for thinking about short-term spending restraint? To put this another way, is it feasible to return to spending levels based on the 2000 budget? To answer, consider events that have taken place between that affected spending and the ability and likelihood of attaining a budget as in the simulations.
Between 2000 and 2008, many events and occurrences had significant effects on federal spending. Most of this time period was in the post-9/11 period with the initiation and continuation of the wars in Afghanistan and Iraq. Naturally, this generated large increases in defense spending. The Medicare prescription drug benefit was passed during this time period, causing a major increase in spending on this program. The aging of the population added to this growth in expenditure, as a well as to that of Social Security outlays. The onset of the recession during 2008 also swelled the income security portion of the budget.
These increases can be seen in Table 4. Table 4 does not trace out the exact influences of these events, but conducts an exercise similar to that in Table 3 in that it projects the 2000 budget forward to 2008 to see how spending differs. Column 1 of Table 4 shows the 2008 expenditures. Column 2 is the level of expenditures that would have been attained if expenditures had been the same as shares of GDP as in 2000. Column 3 is the simulated 2008 budget if the 2000 budget had grown only by inflation and population growth.
Comparing columns 1 and 2, it is quite evident that federal spending grew faster than the economy. Figure 4 illustrates the dominance of spending growth over economic growth during 2000 to 2008 as well as from 2008 to 2012.
Growth as the same rate as the economy would have resulted in total spending of $2,596.2 billion (column 2) instead of the actual value of $2,983.0 billion. Growing spending by only inflation and population growth would have resulted in an even lower level of spending of $2,361.7 billion (shown in column 3).
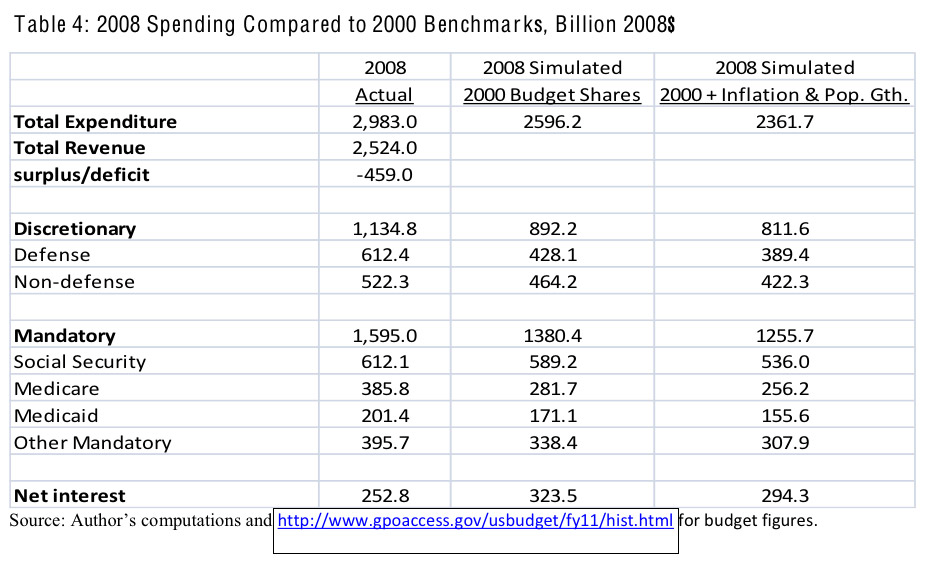
Looking at the components of spending, one can see how the above discussed events affected spending in 2008 relative to 2000 at a more disaggregated level. Using the simulated budget in column 2 as a benchmark, the defense spending build-up raised this component of spending by over $180 billion. Regarding mandatory spending, the Medicare expansions and the again of the population pushed Medicare spending up by over $100 billion relative to the benchmark. Social Security spending was $23 billion higher. Medicaid and other mandatory spending are collectively about $88 billion above the benchmark, likely pushed up due to the beginning of the recession in 2008. Also, discretionary non-defense spending was nearly $60 billion above the benchmark, due to an upward drift in spending on an assortment of programs. Note that the spending discussed is above the benchmark, which means that spending grew faster than the economy.
Defense spending and the Medicare expansion were the two biggest reasons that spending grew faster than the economy from 2000 to 2008, but all parts of the budget grew relative to the economy during this period (aside from net interest).
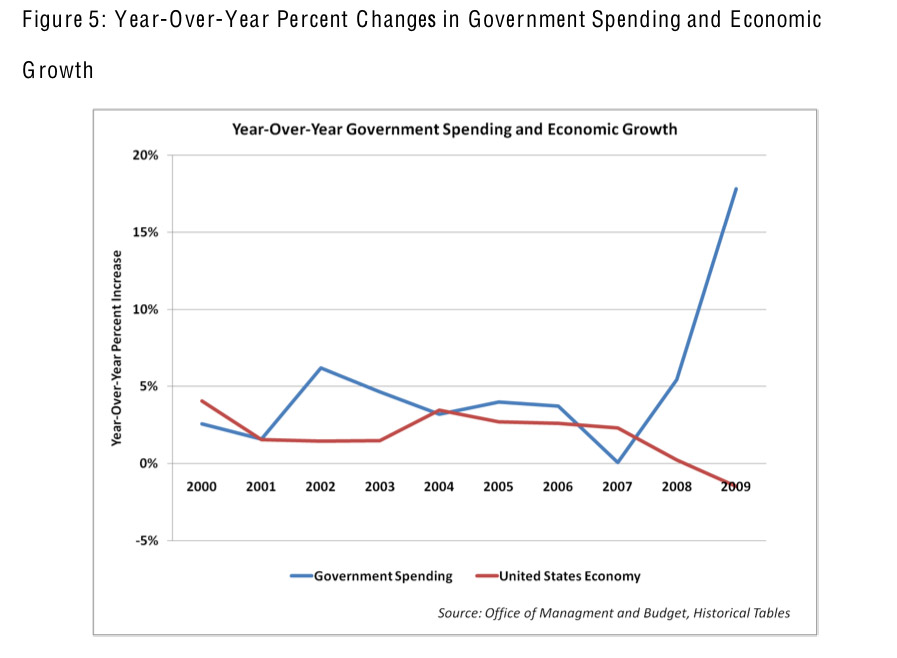
Using column 3 as the benchmark perhaps illustrates the growth in spending more emphatically. The figures in this column are what the 2008 budget and its components would have been if real spending per capita remained as it was in 2000. Actual spending exceeds this benchmark by an even greater amount. Figure 5 illustrates the real growth of government spending over GDP in recent years.
Beyond the events during 2000 to 2008, consider what other occurrences may have generated the continued increase in (actual and projected) spending from 2008 to 2012. As noted previously, the financial markets crisis and the recession spurred Congress to enact the TARP legislation and subsequently the fiscal stimulus. However, by fiscal 2012 these programs will have concluded and government employment associated with those programs will have to be absorbed by the private sector. Also, the healthcare reform was passed in 2010, but nearly all of the expenditure associated with it will not be until after 2012. The conflicts in Afghanistan and Iraq have continued, though they are expected to begin winding down soon, presumably relieving upward pressure on defense spending. Economic recovery is expected, reducing unemployment and poverty, thus requiring less federal spending on unemployment insurance and income-support programs. The population continues to age, which implies more entitlement spending on Social Security and Medicare.
To help illustrate how these affect the budget, Table 5 presents an analysis to Table 4 only comparing 2012 to 2008 benchmarks. Column 1 of Table 5 shows the 2012 projected expenditures, column 2 is the level of expenditures that will be attained if expenditures are the same as shares of GDP as in 2008, and column 3 is the simulated 2012 budget if the 2012 budget grows only by inflation and population growth from 2008. Because there is expected to be very little real economic growth from 2008 to 2012, column 2 and 3 are nearly the same.
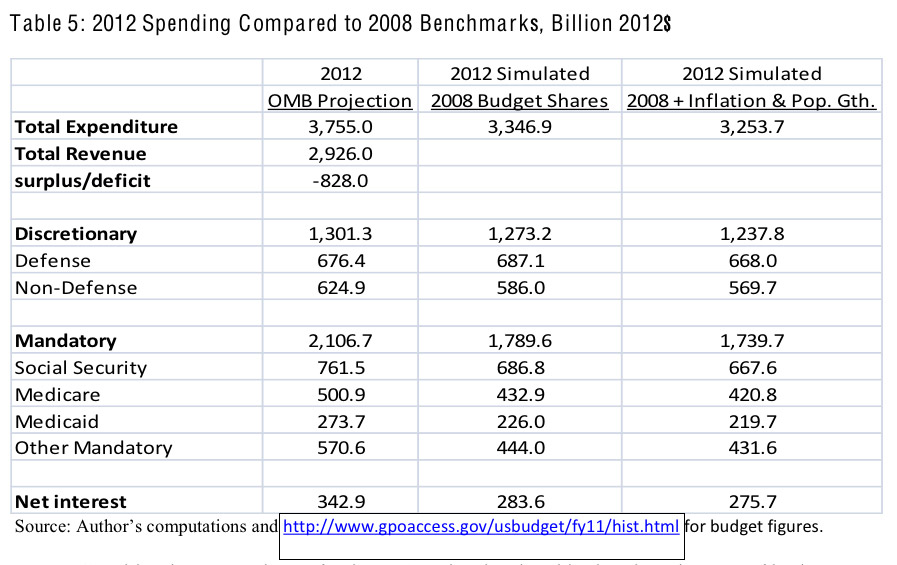
Consider the comparison of column 1 to the simulated budget in column 2. If budget shares of 2008 are replicated for 2012, spending would be $3,346.9 billion instead of $3,755.0 billion, lower by about $400 billion. This difference is not due to defense spending. About $155 billion of this difference is from Social Security and Medicare growing faster than the economy. However, another $215 billion of the difference is due to the combination of non-defense discretionary, Medicaid, and other mandatory spending projected to grow faster than the economy. Many items in these categories should decline as the economy recovers from recession.
C. Reasonable Scenarios for Budget Restraint
The above occurrences between 2000 and 2012 place some contraints on the replication of the 2000 budget shown in Table 3 for fiscal year 2012. Here, we consider these constraints and how they may be reasonably dealt with.
Though defense spending is projected to diminish, it is probably infeasible to cut it to the level of the simulations in Table 3. Specifically, defense spending was 3.0% of GDP in 2000 and is projected to be 4.2% in 2012. If 3.0% of GDP is devoted to defense spending in 2012 (as in the Table 3 simulation), that entails $480.3 billion, which is about $200 billion less than the OMB projection. Regardless of how one feels about the conduct of the wars in Afghanistan and Iraq, it is prudent to wind down the wars in a sensible way. While this may be able to occur with some reductions in defense spending, it is unlikely that it can be done with $200 billion less than projected.
Regarding mandatory spending, it was 9.6% of GDP in 2000 and OMB projects it to be 13.0% in 2012. Much of this increase is due to the aging of the population and the Medicare prescription drug benefit which greatly expand Social Security and Medicare payments. Fundamental reform in these programs can bring about significant long-term spending reductions, which is important.8 But the issue here is restraining spending in the short term. There are many retirees and near-retirees whose lives and plans are at least partly reliant on maintaining these programs in a significant measure. Thus, caution must be used in determining how to restrain spending in this regard. Related comments may apply to Medicaid.9 Nevertheless, control of mandatory spending, even in the short term, is important in attaining spending restraint. Mandatory spending is over half of the federal budget and walling it off from restraint makes overall control of spending highly problematic.
With these thoughts in mind, Figure 6 and Table 6 summarize selected other scenarios for budget restraint.
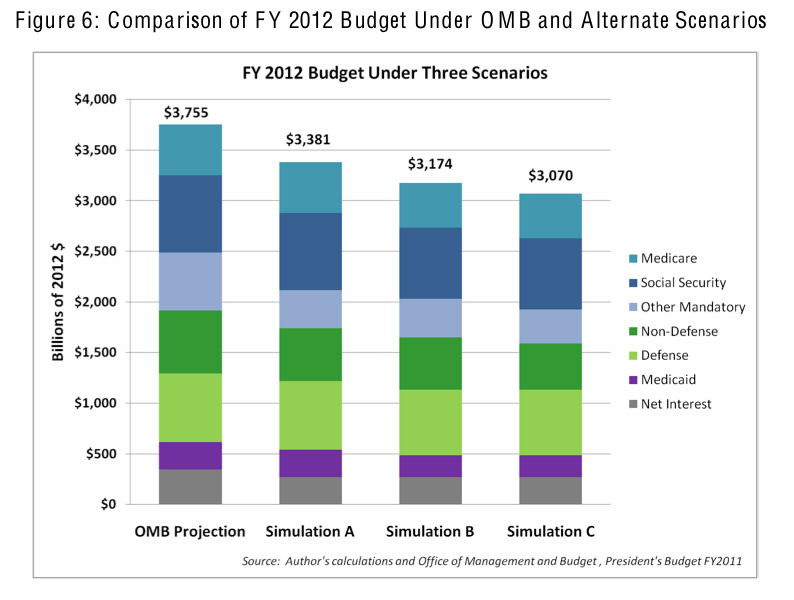
All figures are in billions of 2012 dollars. Column 1 is the OMB projection for 2012. The figures in column 2, denoted simulation A, show the following (for convenience, Table 7 below summarizes this and the other simulation descriptions):
Defense spending as in the 2012 OMB projection.
Discretionary, non-defense spending the same as its share of GDP in 2000.
Social Security, Medicare, and Medicaid spending as in the 2012 OMB projection.
Other mandatory spending the same as its share of GDP in 2000.
Net interest spending as the CBO forecast rather than OMB's.10
This simulation results in a spending level of $3,381.3 billion, over $370 billion less than OMB's projection. Non-defense discretionary spending is about $100 billion less and other mandatory spending is nearly $200 billion less. The CBO forecast for net interest expense is a little over $70 billion less than OMB's.
The third column of Table 6 presents simulation B. This simulation considers deviations from OMB's projections regarding defense, Social Security, Medicare, and Medicaid. In particular, it shows:
Defense spending in 2008 plus projected inflation, i.e., real defense spending as in 2008. Same as simulation A — discretionary non-defense spending the same as its share of GDP in 2000.
Social Security and Medicare spending in 2008 plus inflation plus population growth in the 65 and over age group. This maintains 2008 real spending per person 65 and over for these programs.
Medicaid spending in 2008 plus inflation plus population growth (all ages). This maintains 2008 real spending per person for this program.
Same as simulation A — other mandatory spending the same as its share of GDP in 2000.
Same as simulation A — net interest spending as the CBO forecast rather than OMB's.
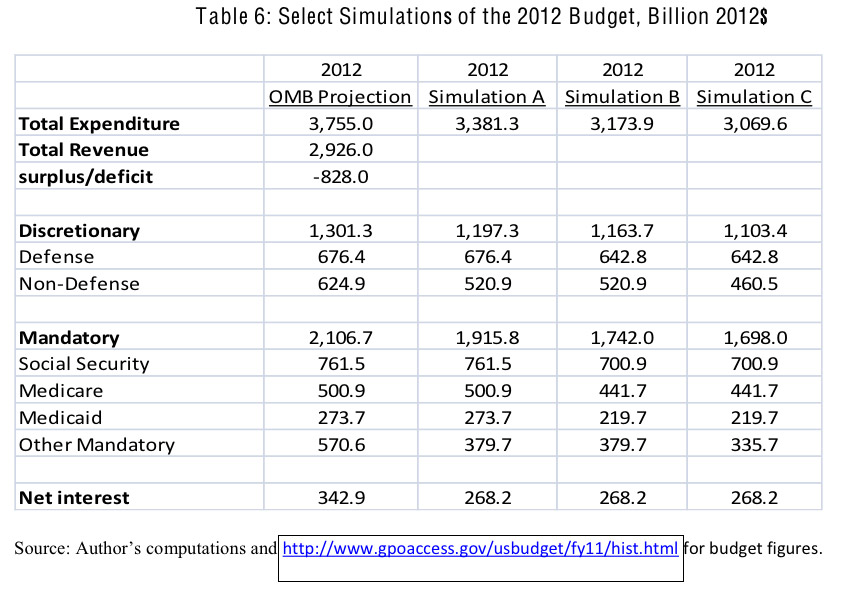
This simulation results in defense spending about $34 billion less than the 2012 OMB projection, with Social Security and Medicare spending each about $60 billion less, and Medicaid spending about $50 billion lower. The total simulated budget is $3,173.9 billion, almost $600 billion less than total OMB-projected federal expenditures.
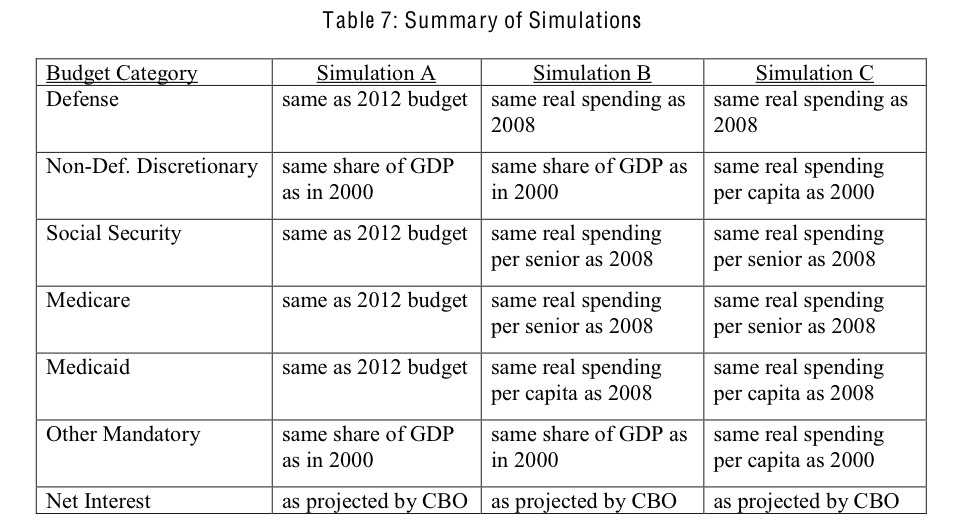
The last column of Table 6 shows one further simulation, denoted simulation C. This alters simulation B by having discretionary non-defense spending and other mandatory spending grow by inflation and population growth since 2000. In particular, it shows:
Same as simulation B — defense spending in 2008 plus projected inflation, i.e., real defense spending as in 2008.
Discretionary non-defense spending as in 200 plus inflation plus population growth, i.e., the same real spending per capita as in 2000.
Same as simulation B — Social Security and Medicare spending in 2008 plus inflation plus population growth in the 65 and over age group, i.e., maintaining 2008 real spending per person 65 and over for these programs.
Same as simulation B — Medicaid spending in 2008 plus inflation plus population growth (all ages), maintaining 2008 real spending per person for this program.
Other mandatory spending as in 2000 plus inflation plus population growth, i.e., the same real spending per capita as in 2000.
Same as simulations A and B — net interest spending as the CBO forecast rather than OMB's.
This lowers discretionary non-defense spending another $60 billion lower than the OMB projection and other mandatory around another $40 billion. Total projected spending in this simulation is $3,069.6 billion, nearly $700 billion less than the OMB projection.
Regarding the federal deficit, each of the above simulated budgets have markedly lower deficits than the OMB projection. OMB projects a 2012 deficit of $828.0 billion, or 5.1% of GDP. Simulation A generates a deficit of $455.3 billion, or 2.8% of GDP. Simulation B yields a $247.9 billion deficit, which is 1.5% of GDP. Simulation C shows a deficit of $143.6 billion, or 0.8% of GDP. Note that these lower deficits of the simulations are without any changes in projected tax collections, i.e., they assume the 2012 OMB-projected tax revenue of $2,926.0 billion.
D. The Reasonableness and Attainability of the Simulations
The above simulations, if implemented, would call for substantially lower spending than projected by 2012. Simulation A entails 11% lower spending and simulations B and C imply 18% and 22% lower, respectively. These are quite large differences. However, bear in mind that OMB projects a very large ramp upward in spending from 2008 to 2012. Recall from Table 2 that real spending is projected to rise by 19.9% between these years. A ramping down by a similar magnitude can hardly be called draconian. Basing the simulations on recent budget years, 2000 and 2008, adds to the credibility. Nothing is discussed that has not been done before. One way of looking at the above simulation is to take the 2008 budget as the base, allow parts of that budget to increase, and restore parts of it to resemble the 2000 budget.
Consider the various categories of the simulated 2012 budgets in more detail.
Defense
It is difficult to determine the level of spending that sensible conclusions of the wars in Afghanistan and Iraq entail. Fiscal 2008 was during the time period of the military surge in Iraq and defense spending that year had risen substantially from prior years. Continuing to maintain this (high) level of spending in real terms may seem quite prudent to some and this is what simulations B and C do. However, actual spending in real terms was higher than this in 2009, is expected to exceed the 2009 level in 2010, and is projected to rise beyond that in fiscal 2011. OMB projections for 2012 show a decline from 2011 but are still above the 2008 level in real terms. Simulations B and C imply 4.0% of GDP to be devoted to defense in 2012. Though the same in real terms as in 2008, the share of GDP is lower than the 2008 share of 4.2% but much higher than the defense share of 3.0% in 2000.
Social Security and Medicare
Regarding Social Security, the OMB projection shows $761.5 billion in spending while simulations B and C show spending of $700.9 billion. Though the simulations are about $60 billion below the OMB projection, the $700.9 billion is very close to actual spending in real terms in 2009. Fiscal 2010 Social Security spending is budgeted to be little above this. A similar story holds for Medicare spending. Projections show $500.9 billion of Medicare spending and simulations B and C show $441.7billion, about a $60 billion difference. However, the $441.7 billion figure is approximately the level of Medicare spending, in real terms, in fiscal 2009. Fiscal 2010 is expected to have a slightly higher level of spending. Table 8 below shows the year that actual spending, in real terms, approximates spending in the simulations.
Thus, attaining the level of Social Security and Medicare spending in simulations B and C does not entail draconian cuts. It does, however, require measures to contain their growth.
Simulations B and C entail spending shares of 4.3 % of GDP and 2.7% of GDP in 2012 for Social Security and Medicare, respectively. These are nearly the same as their shares of GDP in 2008, but below the OMB-projected shares of 4.7% and 3.1%.

Medicaid
Medicaid spending is projected by OMB to be $273.7 billion in 2012, while simulations B and C show $219.7 billion, a difference of $54 billion. Medicaid spending rose quite rapidly at the onset of the recession during 2008 and the following year, and OMB projects further increases in 2010 and 2011, followed by a decline in 2012. The simulations imply a return to a level of real Medicaid spending slightly above that in 2008. This is essentially the same share of GDP as in 2008, of 2.7%.
Other Mandatory
Simulated spending for the other mandatory sub-category is more sharply below its OMB projection. Simulation B shows spending about $190 billion lower than the OMB projection, with simulation C an additional $45 billion lower. Approximately 85% to 95% of other mandatory spending is income security, comprised mostly of unemployment insurance, food assistance, other income support, and federal employee retirement. Much of this is sensitive to the business cycle (with the exception of federal retirement) and normally is expected to ramp down as economic recovery takes hold. OMB projections indicate that this will be the case, but not to the degree that would return spending to pre-recession levels. While the differences in the simulated spending and OMB projections seem quite large, the amount in simulation B would return spending in real terms to about its level in 2005. The simulation C spending level is about that of 2002. As shares of GDP, these spending levels are 2.3% and 2.1%, respectively. For reference, OMB's projections for 2012 show this spending category to be 3.5%, for 2008 it was 2.7%, and it was 2.3% in 2000.
Non-Defense Discretionary
Non-defense discretionary spending also shows a sharp difference between the projected and simulated spending levels. Simulations A and B show spending about $100 billion below the $624.9 billion OMB projection, and simulation C is another $60 billion below that. However, this category of spending grew quite substantially between 2000 and 2008. It continues to grow, though OMB projects reductions in 2011 and 2012, but not to pre-recession levels. Attaining a spending level in simulation A or B would be about that of fiscal 2007 (in real terms). Real spending in fiscal 2002 is about the same spending as in simulation C. As a share of GDP, simulation A or B entails 3.2% and simulation C is 2.8%. The spending share of GDP in 2008 was 3.6% and it was 3.2% in 2000.
Consider steps that might be taken to implement the simulated budgets. Several of the simulations are similar in nature to those discussed in National Research Council (2010), though the latter takes a longer term perspective. One of the long-term budget paths discussed in National Research Council (NRC) (2010) is the low-spending path. Kling (2010) uses the NRC baseline to spell out a plan for long-term spending restraint for Social Security and Medicare. The idea is to maintain entitlement spending below a specified level of GDP. Though having a long-term perspective, many of the ideas in Kling (2010) and NRC (2010) to restrain entitlement spending can be utilized in the shorter term. For Social Security, doing so involves things such as slowly increasing the age for full eligibility, changing the formula for cost-of-living adjustment, and reducing the additional benefits for spouses. Regarding Medicare, limiting spending also might involve increasing the age for full eligibility, but also things such as modestly increasing premiums, co-pays, and deductibles. Similar reforms to the latter three also might be instituted for Medicaid, along with moving to more extensive use of managed care.
These sorts of changes can be designed to reduce the budget pressure on entitlements, both in the short term and the long term. For those interested in deeper reform, these ideas can serve to relieve budget pressures during a transition period to more fundamental reform.11
The non-defense discretionary spending in simulated budgets B and C calls for substantially lower spending than the OMB projection. The discussion of the low-spending path in NRC (2010) contains numerous ideas on how a lower spending trajectory for this budget category might be attained. These ideas include: devolving a number of federal functions to states and localities (though this would put more budget pressures on state and local governments); devolving other functions, but with block grants of lower budgetary amounts; eliminating commercial subsidies; applying user fees to federal services; and identifying and reducing or eliminating low-value projects. A prospective list of the latter also is included in NRC (2010).
The simulated budgets also imply much lower spending in the other mandatory category than the OMB projection. The largest part of these programs relates to income security and includes unemployment compensation, food assistance, housing assistance, disability, Supplemental Security Income, federal employment retirement, family assistance, and the earned income tax credit. Aside from federal employee retirement, these are poverty related and also sensitive to the business cycle. Substantially lower spending on these items happens nearly automatically in an economic upturn. Any reduction beyond this requires new legislation.
The experience of other countries in dealing with budget crises is informative regarding dealing with the present budget difficulties in the U.S. Alesina and Ardagna (1998) document the events for a number of budget crises in OECD countries in the 1980s and early 1990s. These crises typically involve large government deficits and high debt to GDP ratios. Many were resolved by significant spending reductions in short periods of time. For example, Australia's primary budget went from 34.6% of GDP to 30.6% during the late 1980s. During the mid 1980's, Belgium's spending was cut by 4% of GDP. In the late 1980s, Ireland reduced its primary spending from over 42% of GDP to under 35% over the course of about four years. Ireland maintained strong economic growth during this period, which also occurred in a number of other episodes where countries cut their spending. In most cases, spending restraint included reducing transfer spending as a share of GDP.
In the case of the U.S., serious short-term spending reform likely requires reductions in transfer payments (which are mostly mandatory spending) and reducing spending as a share of GDP by 3% to 4%. That other countries have done this suggests that it is well within reach.
IV. Conclusion
The concern about the rise and projected increase in U.S. government spending and debt is very real and it is important to take steps to address this problem. This paper considers ways to do so by restraining spending with use of past budgets as guidelines. Federal spending rose steadily during the 2000s, is currently spiking upward, and is slated to fall as a share of GDP after 2011, but still remain above previous trend levels. The higher level of spending is projected to add greatly to the federal debt. After economic recovery from the recession, tax revenue is forecast to be 18.1% of GDP. Previous federal budgets had spending very close to this, so it seems natural to ask how spending can be returned to those levels.
This paper investigates this further, guided by the 2000 and 2008 budgets as modified by current exigencies. Though a number of exogenous events affect spending (e.g., war, recession), our results suggest that large reductions in spending, and in the federal deficit, are possible by following the outlines of past budgets as shown by the simulations. In fact, one simulation attains a nearly balanced budget for 2012 without any tax rate increases. Being able to accomplish a budget like this is likely to spur economic growth, both by restoring confidence in the U.S. government and in Treasury securities and by refraining from tax hikes that discourage economic activity.
The focus of the paper is on short-term fixes to restrain spending. Long-term spending restraint calls for more fundamental reform in the design of programs and in the nature of what activities the federal government engages in. Nevertheless, the ideas here might serve to relieve budget pressures during an interim period while more fundamental reform is designed and implemented.
Endnotes
1. See Office of Management and Budget (2010).
2. See Feldstein (2008) for a review of these issues.
3. Also, see Alesina and Ardagna (2009) indicating that handling fiscal crises via spending reductions have been more successful than use of tax increases.
4. Additionally, the recently enacted healthcare reform legislation has only small impacts on spending and tax revenue by 2012, so its consideration regarding short-term budget issues is largely moot.
5. However, a budget that exhibits spending restraint may foster economic growth.
6. The only exception to this is if the government budget is spent to utilize unemployed resources that the private sector leaves idle. Whether governments can actually do this is open to doubt, but this still does not suggest that the cost of government is different with debt finance versus tax finance.
7. OMB projections for future years are used for much of the paper, with some exceptions. They differ somewhat from CBO projections to some degree, but are generally similar.
8. See Kling (2010) for discussion of long-term budget restraint and reform in these programs.
1. Other mandatory programs where similar comments might apply are veterans' benefits and SCHIP. However, their budgets are relatively small and put with "other mandatory programs" in the analysis below. Treating them the same as Social Security, Medicare, and Medicaid changes things only slightly.
10. I do not make any forecast for net interest spending. The CBO forecast is used since it is a reasonable forecast that shows potential budget savings. Since changes in spending and deficits before 2012 are not considered, there is no accumulated difference in debt ant the interest on it to calculate.
11. Presumably involving such things as private retirement accounts, health insurance vouchers, and greater involvement of the private sector in health insurance for the aged. See Kling (2010) for some discussion of the latter two.
References
Alesina, Alberto and Ardagna, Silvia, "Tales of Fiscal Adjustment," Economic Policy, October 1998.
Alesina, Alberto and Ardagna, Silvia, "Large Changes in Fiscal Policy: Taxes Versus Spending," National Bureau of Economic Research Working Paper 15438, October 2009.
Congressional Budget Office, An Analysis of the President's Budgetary Proposals for Fiscal Year 2011, March 2010, http://www.cbo.gov/ftpdocs/112xx/doc11280/03-24-apb.pdf.
Feldstein, Martin, "Effects of Taxes on Economic Behavior," National Bureau of Economic Research Working Paper 13745, January 2008.
Government Printing Office, Budget of the United States Government: Historical Tables Fiscal Year 2011, http://www.gpoaccess.gov/usbudget/fy11/hist.html.
Kling, Arnold, "Simple Solutions for the Long-Term Budget Challenge," Mercatus Center Working Paper No. 10-14, March 2010.
National Research Council and National Academy of Public Administration, Choosing the Nation's Fiscal Future, Committee on the Fiscal Future of the United States, Washington, DC: The National Academies Press, 2010.
Office of Management and Budget, The 2011 Budget, Summary Tables, February 2010, http://www.whitehouse.gov/omb/budget/fy2011/assets/tables.pdf.