- | Financial Markets Financial Markets
- | Data Visualizations Data Visualizations
- |
Growth in Entitlements Means Less Money to Budget
Trends in the components of government spending have significantly shifted in the past 40 years and look to become increasingly occupied by spending on mandatory programs—such as Social Security, Medicare and Medicaid—and interest payments on the national debt. This week’s chart gives a comparative look at trends in the composition of government spending through snapshots from the 1970 budget, today’s budget, and the projected 2040 budget.

Trends in the components of government spending have significantly shifted in the past 40 years and look to become increasingly occupied by spending on mandatory programs—such as Social Security, Medicare and Medicaid—and interest payments on the national debt. This week’s chart gives a comparative look at trends in the composition of government spending through snapshots from the 1970 budget, today’s budget, and the projected 2040 budget.
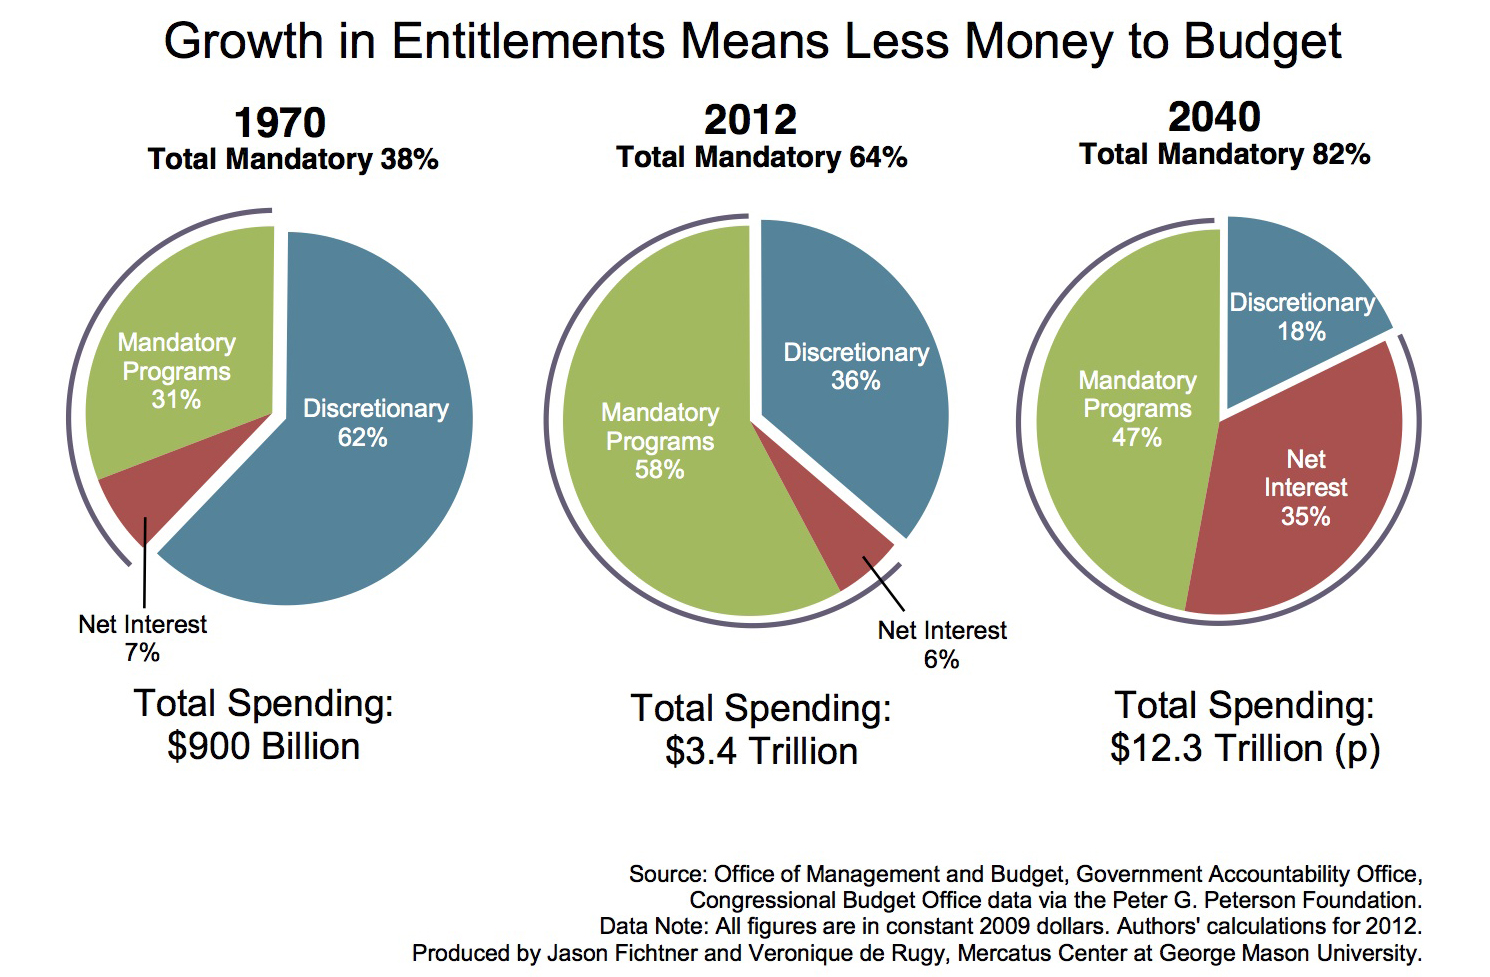
The federal budget consists of three broad categories in the chart above: discretionary (blue portion), mandatory (green portion), and net interest (red portion). Today, discretionary spending accounts for 36 percent of total spending, which is a small minority compared to 62 percent in 1970.
In contrast, mandatory spending on Social Security, Medicare, Medicaid, and other such programs has doubled as a portion of total spending, from 31 percent of the budget in 1970 to 58 percent of the budget in 2012.
Interest payment on the national debt is the fastest growing component of the federal budget. Together with mandatory spending on entitlements, this portion accounts for over 60 percent of the budget and is projected to consume more than 80 percent by 2040.
This is no surprise as the federal government faced its fourth year of trillion dollar deficits and spent an unprecedented $3.5 trillion (in current dollars), or about $11,200 per person, in 2012 alone. As deficits continue to pile onto the national debt, interest payments continue to grow significantly as a result.
Hence, the primary drivers of government spending today and into the future are the continual growth in entitlements and interest payments on the federal debt that crowd out all other areas of the budget.
Data note: The 1970 and 2040 figures represent data from the OMB, GAO, and CBO via the Peter G. Peterson Foundation (PGPF). The 2012 figure is calculated using CBO’s updated 2012 Budget and Economic Outlook figures and adjusted for inflation. This chart is an updated rendition of PGPF’s original chart published in their 2010 “Spending Primer.”
Related Content
- | Government Spending Government Spending
- | Policy Briefs Policy Briefs
The FY 2014 Budget Proposals
- | Government Spending Government Spending
- | Data Visualizations Data Visualizations
Let's Return to Clinton-Era Spending Levels

- | Government Spending Government Spending
- | Data Visualizations Data Visualizations
Spending in a Time of Debt

- | Government Spending Government Spending
- | Data Visualizations Data Visualizations
Long-Term Spending Explosion Driven by Entitlements
