- | Government Spending Government Spending
- | Data Visualizations Data Visualizations
- |
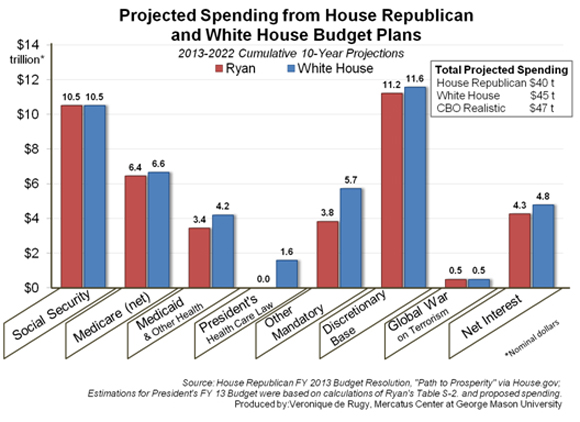
Projected Spending from House Republican and White House Budget Plans
Modest adjustments that reduce spending on entitlements do not touch the core of the issue. Real fiscal reform requires deep cuts across the board to all programs and activities that are better managed by state and local entities and by the private sector.

This week, Mercatus Center senior research fellow Veronique de Rugy compares the 10-year spending projections from the House Republican Budget for fiscal year 2013 (the Ryan plan) and the White House budget for 2013. As the data show, neither budget proposal does nearly enough to reduce the size and scope of government.
At $3.53 trillion in total spending, the Ryan plan is only 5 percent less than the president's. Where the Ryan plan projects an annual average growth of projected spending from 2013 to 2022 at 4 percent, the president's plan projects it at 5 percent.
Of the $5 trillion in savings in the Ryan plan's 10-year spending projections, compared to Obama’s, $352 billion would come from discretionary programs, $2.5 trillion from so-called entitlements, and $514 billion from interest costs.
Apart from a modest reduction in spending for Medicare and Medicaid, the only significant difference between the two plans is the anticipated repeal of the 2010 health care law. Social Security ($10.5 trillion) and funds for the “global war on terrorism” ($500 billion) are left untouched in both plans.
Cumulative spending over the next 10 years under both the Ryan plan ($40 trillion) and the White House plan ($45 trillion) pale in comparison to the Congressional Budget Office’s estimate of $47 trillion—an estimate based on historical spending patterns and more realistic assumptions about laws that are set to expire.
Modest adjustments that reduce spending on entitlements do not touch the core of the issue. Real fiscal reform requires deep cuts across the board to all programs and activities that are better managed by state and local entities and by the private sector.
Note on data:
Estimates for Obama’s projected spending were calculated by adding Ryan’s budget with the differences presented in Table S-2 of the Ryan plan. Spending categories presented in the chart are organized and labeled the same way it is presented in the House Republican budget.
Related Content
- | Government Spending Government Spending
- | Data Visualizations Data Visualizations
Expiring Bush-Era Tax Cuts for the Rich Doesn't Get Rid of a Spending Problem

- | Government Spending Government Spending
- | Expert Commentary Expert Commentary
A Critical Look at the Ryan Plan

- | Government Spending Government Spending
- | Expert Commentary Expert Commentary
Mercatus Center Economists on the House Republican Budget

- | Government Spending Government Spending
- | Data Visualizations Data Visualizations
Public Debt Under Various Proposals
