- | Government Spending Government Spending
- | Working Papers Working Papers
- |
Stimulus Facts for Q4 FY 2009
Using recipient report data from Recovery.gov and economic and political data from the Bureau of Labor Statistics, the Census Bureau, GovTrack.us, and others, we have compiled a series of facts about

Using recipient report data from Recovery.gov and economic and political data from the Bureau of Labor Statistics, the Census Bureau, GovTrack.us, and others, we have compiled a series of facts about stimulus spending. Our interest is simply to make use of the tens of thousands of stimulus recipient reports recently published on Recovery.gov and to put the aggregate information contained in those reports in a larger context. We hope that this report will become part of a regular series as new recipient reports are released each quarter.
The data presented here encompass the FY09 Q4 reports of Recovery Act contracts and grants only. More information about our methodology is at the end of this document. Additionally, the complete dataset used for this report is available for download at Mercatus.org.
Basic Facts
A total of 56,399 contracts and grants totaling $157,028,362,536 were awarded in this first quarter for which Recovery.gov reports are available. The number of jobs claimed as created or saved is 638,826.54—an average of $245,807.51 per job.
The total amount awarded to public entities (such as municipalities and state agencies) is $87,865,102,272. However, some of this money may have ultimately found its way to private subgrantees or subcontractors. The total amount awarded to private contractors and grantees is $69,163,260,264. While public entities received 45.696 percent of the number of all awards, these awards constituted over half of the dollars awarded (55.955 percent).
Party Affiliation
For our analysis, we looked at the 435 congressional districts in the United States plus the District of Columbia, but excluded Puerto Rico, the U.S. Virgin Islands, and foreign stimulus recipients, such as Canada. The average number of awards per district is 128, and the average dollar amount awarded per district is $355,103,891.
There are 177 districts represented by Republicans and 259 represented by Democrats. On average, Democratic districts received 1.6 times more awards than Republican ones. The average number of awards per Republican district is 94, while the average number of awards per Democratic district is 152.
Democratic districts also received 1.89 times more stimulus dollars than Republican districts. The average dollars awarded per Republican district is $232,047,857, while the average dollars awarded per Democratic district is $439,200,100. In total, Democratic districts received 73.47 percent of the total stimulus funds awarded. In terms of numbers of awards, Republican districts received 29.77 percent of the total, while Democratic districts received 70.22 percent.
Other Political Variables
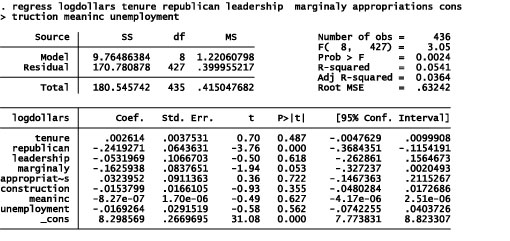
An OLS regression analysis controlling for the district representative’s political party, tenure in office, leadership position, membership on the appropriations committee, as well as for the district’s unemployment, mean income (i.e., the average income of a given wage earner in the district), and the percentage of employed persons working in the construction sector in 2008 finds that having a Republican representative decreases a district’s stimulus award by 24 percent.
This effect is statistically significant at the p < .001 level. (See Table 3 at end of this paper.) However, the regression analysis does not seek to explain (nor does it explain) precisely how funds were allocated (our R-squared = .05). That would require a more complete dataset than has been used for these results. While we have confidence in the relationships in which we are interested, a more complete model would change the parameter estimates we are reporting here.
Furthermore, we find that there is no effect on the amount of stimulus funds allocated based on whether a district voted for John McCain or Barack Obama in the 2008 presidential election. While $101,483,870,504 have been allocated to congressional districts that voted for President Obama (or 65.5 percent of the total amount allocated), $53,341, 425,974 (or 34.5 percent) have been allocated to congressional districts that voted for McCain. It should be noted, however, that there were many more congressional districts that voted for Obama than voted for McCain. President Obama won 55.6 percent of congressional districts, and McCain won 44.4 percent of these districts.
The districts that voted for President Obama received 35,047 awards (or 62.7 percent of the total number of awards allocated), much more than the districts that voted for candidate McCain; they received 20,855 awards (or 37.3 percent of the total number of awards).
The average awarded to marginal districts—districts with a difference between candidates of 5 percent or less—is $186,348,804. That’s significantly less than the average awarded to non-marginal districts of $387,379,454.
House Leadership
As noted earlier, the average congressional district received $355,103,891. In contrast, the average leadership district (defined as a district where the representative is part of the majority or minority House political leadership or is a chairman or ranking member of a committee) received $309,183,100.
The average amount awarded to a leadership district is fairly comparable regardless of whether the leader is a member of the majority or the minority. The amount awarded to average majority leadership district is $306,098,932, while the amount awarded to average minority leadership district is $312,267,268. Notice that each of these amounts is less than the amount awarded to the average district and less than the amount awarded to the average non-leadership district, which is $361,052,180.
On average, 128 contracts or grants were awarded to each congressional district. The number of awards to the average leadership district is 108; the number of awards to average majority leadership district is 138; and the number of awards to average minority leadership district is 79. The average non-leadership district received 131 awards, which is more than the number of awards to the average leadership district.
Economic Indicators
Unemployment
Controlling for the percentage of the congressional district that was employed in the construction industry, we find that there is no statistical correlation between the median income in that district and the unemployment rate. This is true for all relevant unemployment indicators. (See Figures 1 and 2.)
Figure 1: Scatter plot of stimulus funding, December 2008 unemployment
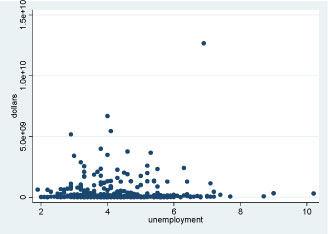
Figure 2: Scatter plot of stimulus funding, construction employment as a percentage of total employment as of December 2008

Income
Awards were also coded for Metropolitan Statistical Areas (MSAs) based on their ZIP codes. MSAs are large geographical units with an urban center for which the Census Bureau and other agencies compile data. Chicago-Naperville-Joliet, IL-IN-WI, for example, is an MSA.
Using per capita income data from the Bureau of Economic Analysis, we divided each MSA into quintiles. Each quintile represents 20 percent, or one-fifth, of all incomes in that MSA. As a result, the top quintile (Q1) represents the highest-income MSA, and the bottom quintile (Q5) represents the MSA with the lowest income (Table 1).
Table 1: MSA income distribution by quintile
Based on the data, we looked at whether the allocations were affected by how high- or how low-income the MSA was. Based on the total MSA, 38.16 percent of the stimulus funds were allocated to the highest income MSAs and only 1.43 percent to the lowest quintile. However, using per capita expenditures in MSAs, the highest quintile received $403 per person while the lowest quintile received $1,028 per person. (See Table 2.)
Table 2: Stimulus distribution in the highest- and lowest-income quintiles
MSA with income in Q1 | MSA with income in Q5 | |
Stimulus Received | $55,681,661,840 | $2,082,654,635 |
Percentage of Total Stimulus Received | 38.16% | 1.43% |
Stimulus Received per Capita | $403 | $1,028 |
Average Stimulus per MSA | $762,762,491 | $28,529,516 |
Methodology
We downloaded all FY09 Q4 recipient reports for contracts and grants from the official Recovery.gov Web site. [1] These are self-reports submitted by the recipients of stimulus contracts and grants. We did not include loans because we are only interested in transfer payments. We removed all sub-awards from our combined dataset because they simply add up to the primary awards. Our resulting dataset is a list of every primary contract and grant reported with their corresponding attributes. Attributes include recipient names, recipient addresses, amounts received, jobs claimed, congressional district, etc.
Each award in the source data has two addresses associated with it: the award recipient's address and the place of performance address. These are the same most of the time, but in some cases, they are not. For example, a pipe manufacturer in Florida might have received a contract for a pipe to be used in New York. We chose to use only the award recipient address for our analysis because we are interested in the political economy of the awards, i.e. who receives the payment.
Every award has a recipient state and congressional district associated with it. Almost every state also has awards that are associated with a district “ZZ.” Recovery.gov explains, “The code ‘ZZ’ appears in the congressional district field as a placeholder if a recipient reported an incorrect or invalid congressional district. The recipient will correct the congressional district during the next reporting period, beginning January 1, 2010.” We corrected every erroneous district in our dataset by looking up the correct district number based on the recipient’s ZIP+4 code. [2]
Every award has a North American Industrial Classification System code associated with it. [3] These codes represent the recipient's industry relevant to the contract. For example, the code 237110 represents “Water and Sewer Line and Related Structures Construction.” All codes above 920000 represent “Public Administration,” i.e. some government entity. We coded all awards with a code of 920000 and above as “public” and all awards with a code below 920000 as “private.”
We coded every award as Republican or Democratic based on the current representation of its associated district. [4] Awards are also coded as leadership or not. We assign the leadership code if the member from an award recipient district is part of the majority or minority House political leadership or a chairman or ranking member of a committee. We also coded each award with whether the member from the district sits on the appropriations committee.
We coded each award as being in an Obama or McCain district based on which candidate received the most votes in the last presidential election in its recipient district. [5] We also coded each award as being in a marginal district or not. We defined marginal districts as those where the percentage difference between McCain and Obama was 5 percent or less.
We also coded each award with its corresponding MSA based on the recipient’s ZIP+4 code using a lookup table. [6] This allowed us to use MSA population data from the Census Bureau [7] and MSA per capita income data from the Bureau of Economic Analysis. [8]
Our dataset includes awards made to recipients in U.S. territories and foreign countries. [9] Awards to these locales total $2,203,066,058, just 1.4 percent of the total represented by all awards. Because we are interested in the political economy of the awards, we exclude these from most of our questions and use only the data for the 50 states plus the District of Columbia.
With that data, we ran a series of regression analyses using Stata, a widely used statistical software package. Regression analysis is a statistical tool that helps understand the relationships between variables. Regression analysis is what helps to identify the causal effect of one variable, and one variable alone, upon another—the effect of unemployment level in a district upon the allocation of stimulus funds in that district, for example, or the effect of party affiliation upon that same allocation of resources.
To explore such issues, we assembled data on the underlying variables of interest (in this case, party leadership, affiliation, unemployment level, or income level and distribution). In order to avoid omitted variable bias, we pulled the economic indicators from the 2008 U.S. Census Bureau American Community Survey 1-Year Estimates. [10] Then, we checked for correlation and computed the predictive power of economic indicators on stimulus fund allocation.
We found no correlation between economic indicators and stimulus funding. Preliminary results find no effect of unemployment, median income, or mean income on stimulus funds allocation.
Then, we checked for the correlation between political indicators and stimulus funding. With the exception of the district’s party affiliation (whether the district’s representation was Republican or Democrat), we found no effect of political variables on stimulus funds allocation.
Next, we used regression analysis to estimate the quantitative effect of the causal variables upon the variable that they influence. For example, when we found that the party affiliation had a causal effect of the allocation of stimulus funds, we looked for how much party affiliation mattered. The quantitative effects that we estimated are based on our model specification such that with a more completely specified model, these effects would likely change. Thus, more confidence should be placed on the relationship between the two variables (i.e., a causal factor exists) then on the quantification of that relationship.
Also, we assessed the “statistical significance” of the estimated relationships. That is, the degree of confidence that the true relationship is close to the estimated relationship. In other words, we assessed how likely we were to be correct. In all cases, we established that we had 10 out of 10 chances of being right.
Table 3: Regression Analysis
The authors would like to thank Dan Rothschild and Jakina Debnam for their invaluable help compiling and analyzing the data.
[1] http://www.recovery.gov/FAQ/Pages/DownLoadCenter.aspx, http://download.recovery.gov/recipient/2009_Q4/All_ContractsFY09Q4.xls…, http://download.recovery.gov/recipient/2009_Q4/All_GrantsFY09Q4.xls.zip.
[2] We used GovTrack.us’s district finding tool at http://www.govtrack.us/congress/findyourreps.xpd.
[4] We used GovTrack.us to find the representative of each district, his or her party affiliation, and his or her committee membership.
[5] We used 2008 presidential election results by district compiled by SwingStateProject.com. It in turn used official local government sources for its data, http://www.swingstateproject.com/showDiary.do;jsessionid=88ADE21A3CEBD0….
[9] Alberta, Canada; Ontario, Canada; Puerto Rico; Guam; the Marshall Islands; Northern Mariana Islands; Palau; the U.S. Virgin Islands; American Samoa; and four awards to “OTH,” which we take to mean “other.”
Download the Data
Stimulus_Facts.xls
Stimulus_Facts (STATA).xls
stimulusandecon.dta
Related Content
- | Government Spending Government Spending
- | Research Papers Research Papers
Stimulus Facts Data for Q1 FY 2011
- | Government Spending Government Spending
- | Research Papers Research Papers
Stimulus Facts Data for Q4 FY 2010
- | Government Spending Government Spending
- | Working Papers Working Papers
Stimulus Facts

- | Government Spending Government Spending
- | Federal Testimonies Federal Testimonies
Stimulus Facts
