- | Housing Housing
- | Policy Briefs Policy Briefs
- |
California’s Density Deficit and the Likely Impact of SB 827
Among the 15 American metropolitan areas with the fastest growth in demand for housing since 2012, 5 are in California. Those 5 California metros grew more slowly than all 10 other metros on the list.
A dearth of new homes and expanding housing demand cause high inflation in the housing market. Even though Denver, Austin, and Seattle had higher demand growth than any California metro, rent in those cities grew less rapidly. Had California implemented measures to accommodate growing demand as the rest of the country does, its residents would now be paying less in rent. This article considers a counterfactual thought experiment: how would California’s housing market be different today if a policy currently under consideration in the California Senate—SB 827, which would allow new residential building along public transit corridors—had been implemented six years ago? I estimate that rent would be 5.8 percent lower in San Francisco, a savings of $266 per month on the median home, and 4.2 percent lower in Los Angeles County, savings of $124 per month.
Density Deficit
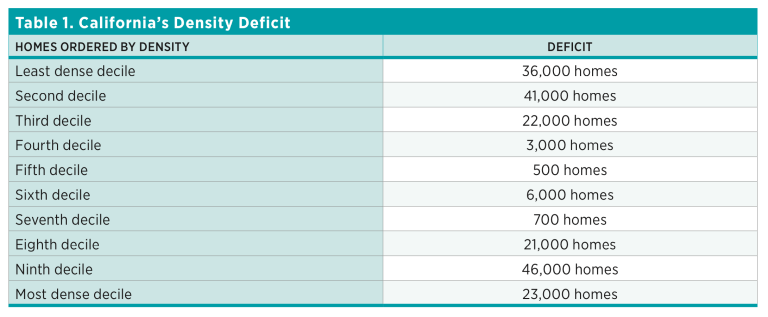
Comparing California neighborhoods (census tracts, technically) to neighborhoods of similar density and demand around the United States reveals that California has large housing growth deficits in its least and most dense areas. These growth deficits are based on comparing the average rate of growth in each California neighborhood to a matched neighborhood in a pool of comparison regions. Deficits in the least dense areas are unsurprising: the geography of California’s rural areas is naturally less conducive to building than the US average, and the state has strict environmental regulation. But the growth deficit in dense neighborhoods is surprising. Rather than encouraging infill development in urban and dense suburban neighborhoods, California institutions have stifled it. In mid-density suburban neighborhoods, on the other hand, California has built about as much as comparable neighborhoods elsewhere in the United States.
Splitting California’s neighborhoods into 10 categories with equal numbers of homes in 2012, one finds the following growth deficits through the end of 2017:
Likely Impact of SB 827
The California Senate is considering proposed legislation, SB 827, that would preempt local zoning ordinances in order to allow property owners greater latitude to meet demand by building denser housing near public transit corridors. In a recent policy brief for the Mercatus Center at George Mason University, Emily Hamilton and I discuss the provisions of the bill and the principles that should guide state policymakers in the delicate matter of preempting local law.
In order to evaluate the potential impact of SB 827, which would upzone transit-rich (and thus usually high-density) parts of the state, I use a set of similar US regions as a comparison group. In the spirit of the synthetic control method, the selection of a donor pool of potential comparison neighborhoods “requires some care.” The comparison regions are subjectively chosen as places that have prioritized infill development, have cities hemmed in by mountains and ocean, and experience high-enough demand growth to provide good neighborhood-level matches for California. Neighborhoods from the comparison group that are not comparable to an impacted California neighborhood in density or demand growth do not contribute to the counterfactual.
The comparison group includes Colorado, Oregon, Utah, Washington, the Miami metro area, and the Washington, DC, metro area. Cities in these regions have much stricter zoning than say, Texas, but have still sought to accommodate urban demand, and many of them have done so in a fashion that is comparable to SB 827. Seattle has designated urban villages to grow denser than the surrounding single-family neighborhoods. DC and some of its suburbs have generally permitted growth in transit-served areas while blocking density in most other neighborhoods. The comparison group has been more accommodating of growth than the country as a whole, so California’s growth deficits (shown in table 2) appear larger than when comparing California to the entire country, as in table 1. However, the qualitative result—California’s lack of growth in its densest areas—is true for both comparisons.
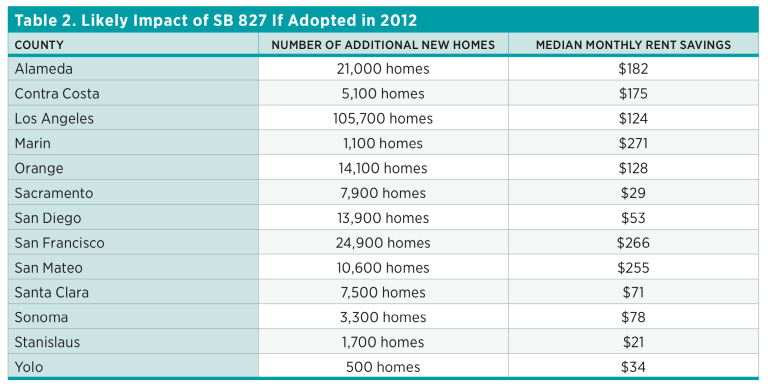
How many more units would California’s impacted counties have built, and how much lower would rent be now, if SB 827 had been in effect over the past six years?
- Only tracts in the top half of the density distribution are affected.
- Rental housing has a price elasticity of −2/3, which means that an increase of 2 percent in housing units corresponds to a drop of 3 percent in rent.
- Metropolitan areas are the relevant housing markets.
- I used Sasha Aickin’s map and recent amendments to SB 827 to inform my choice of which counties to present.
Housing and Density Data
For quantities demanded and supplied, I use the US Department of Housing and Urban Development (HUD) Aggregated USPS Administrative Data on Address Vacancies. Since 2005, the US Postal Service has shared its administrative tabulations of postal addresses with HUD. These tabulations are published quarterly. Addresses are tabulated by type of use (residential, business, or other) and by type of occupancy (occupied, vacant, or no-stat).
For the final quarter of 2017, the data contain 130 million residential addresses, 9.7 million business addresses, and 6.5 million other addresses.
To compute tract density, I inflate business addresses by a factor of five, reflecting the generally larger size of businesses relative to homes. The results are robust to different choices of inflation factor.
Rent Data
For price data, I use the Zillow Rent Index (ZRI), which is published monthly as a three-month moving average at the zip code level. The ZRI is the median of a frequently updated prediction of every housing unit’s market rental value, designed to minimize prediction error. Thus, even homes that are never rented are included in the index. Compared to a repeat rent index, Zillow’s approach is more sensitive to changing composition in an area but less sensitive to the changing composition of units on the market at any given time. In any case, as economists Brent Ambrose, N. Edward Coulson, and Jiro Yoshida explain, repeat rent indices are not available for narrow geographies. Zillow also provides home-price and home-price-per-square-foot indices, which I use for robustness checks.
Conclusion
California has failed to build new housing in dense areas even as demand to live in its denser metropolitan areas has surged. Some of the results of this failure have been housing unaffordability, population displacement, and exclusion of low-income people from the most desirable and job-rich areas.
Using a neighborhood-level comparison approach, I estimate that urban and suburban California counties would have allowed tens of thousands more homes to be built in already-dense neighborhoods if growth-accommodating rules such as those proposed in SB 827 had been in effect over the past six years. Applying two further assumptions in the context of a commonly used model of urban growth, one can estimate how much of an impact such a policy would have had on rent.
In San Francisco, monthly rent on the median home would be $266 lower per month. Rent in Los Angeles would be $124 lower per month. SB 827 would lower rent by allowing California builders to meet some of the state’s high demand for housing.
Related Content
- | Academic & Student Programs Academic & Student Programs
- | Housing Housing
- | Policy Briefs Policy Briefs
California Can Improve Housing and Transit by Preempting Local Ordinances

- | Capitol Hill, State House, or City Hall: Debating the Location of Political Power and Decision-Making Capitol Hill, State House, or City Hall: Debating the Location of Political Power and Decision-Making
- | Corporate Welfare Corporate Welfare
- | Essays Essays