- | Government Spending Government Spending
- | Data Visualizations Data Visualizations
- |
FY2014 Budget Proposals In Perspective
With the recent release of President Obama’s FY 2014 budget, it is important to put the budget numbers from the various proposals into proper perspective. These charts compare the patterns of future spending projections from the Senate Democratic budget by Chairman Patty Murray, House Republican budget by Chairman Paul Ryan, Senator Rand Paul’s budget, and the president’s budget.

With the recent release of President Obama’s FY 2014 budget, it is important to put the budget numbers from the various proposals into proper perspective. These charts compare the patterns of future spending projections from the Senate Democratic budget by Chairman Patty Murray, House Republican budget by Chairman Paul Ryan, Senator Rand Paul’s budget, and the president’s budget.
The first chart shows the projected spending amounts between FY 2014 and FY 2023 in nominal dollars.

- Obama’s plan actually spends more in the short run than the Murray (Senate Democratic) plan, but by 2023, the two plans are essentially the same in terms of spending.
- In the short run, both Democratic plans spend more than the CBO baseline projections based on current law.
- All of the four plans grow the size of government by 2023.
The second chart shows the ten-year spending totals and the rates at which spending grows from FY 2014 to FY 2023.

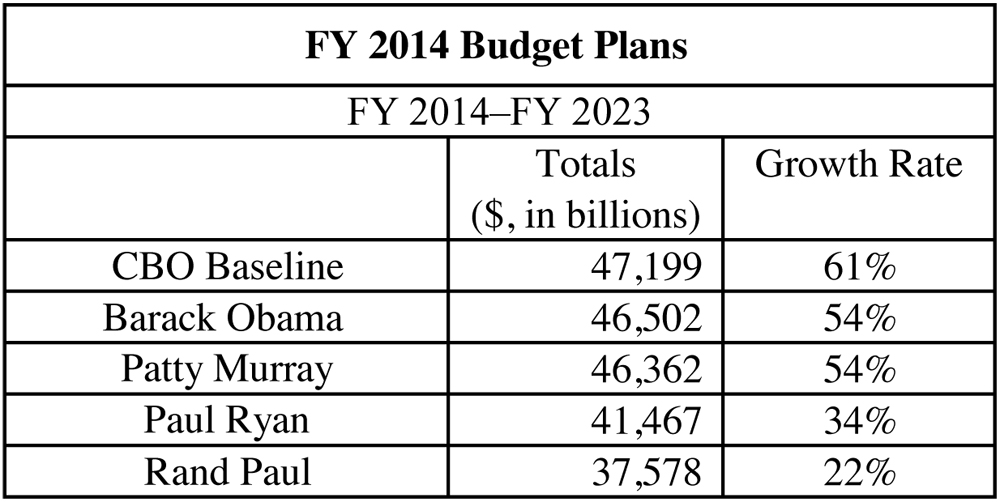
- The Democratic plans’ ten-year spending totals are $5 trillion higher than the Ryan (House Republican) plan and about $9 trillion higher than the Rand Paul plan.
- The Obama plan and the CBO baseline differ in ten-year totals by less than $700 billion.
- The Democratic plans grow spending by 54% while the Ryan plan grows it by 34% and the Paul plan by 22% over this period.
Data note: All years labeled in the charts represent fiscal years.
Related Content
- | Government Spending Government Spending
- | Data Visualizations Data Visualizations
Public Debt Under Various FY 2014 Proposals

- | Government Spending Government Spending
- | Data Visualizations Data Visualizations
A Closer Look at Senate and House Budget Proposals

- | Government Spending Government Spending
- | Data Visualizations Data Visualizations
Ryan Budget Grows Spending at a Slower Rate, But Still Grows Spending
.png")