- | Government Spending Government Spending
- | Data Visualizations Data Visualizations
- |
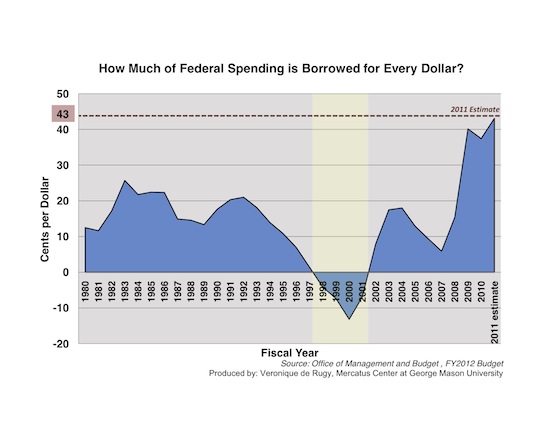
How Much of Federal Spending is Borrowed for Every Dollar?
This chart illustrates the fraction of every dollar of federal government spending that contributes to our debt.

This week, Mercatus Senior Research Fellow Veronique de Rugy illustrates the fraction of every dollar of federal government spending that contributes to our debt.
Above, data from the President’s FY2012 budget shows historical amounts of federal government borrowing on the dollar from fiscal year 1980 to present day. Positive amounts represent budget deficits or the amount by which total government spending exceeds total revenues during a specified period.
Today, 43 cents of every dollar spent is borrowed; this amount is about 4 times the rate in 1980. Between 2007 and 2011 alone, the rate has increased 38 cents per dollar. At this pace, the historical trend of deficit spending continues at a distressing rate.
The government ran a budget deficit in every year from 1980 to 1997, and continued this trend in 2001 and onward. The surplus that finally emerged in 1998 was produced by increased tax revenues that a sustained economic expansion generated; and without the aid of increases in tax rates.
As critical debate over the debt ceiling continues, the amount of spending that is borrowed should be put in proper perspective. A continued proliferation of federal spending won’t help to contain the debt.
Veronique de Rugy discusses the current debate over raising the debt ceiling at the Daily Caller.
Related Content
- | Government Spending Government Spending
- | Data Visualizations Data Visualizations
Cost of the Debt Drives Long-Term Spending Explosion

- | Government Spending Government Spending
- | Data Visualizations Data Visualizations
Current Spending Cuts Insufficient to Balance Budgets in the Long Run

- | Government Spending Government Spending
- | Data Visualizations Data Visualizations
2011 Estimated Federal Spending
