- | Housing Housing
- | Expert Commentary Expert Commentary
- |
A Closer Look at Recent Hawaiian Housing Supply Growth
Last week, we took a look at housing supply growth on the Hawaiian island of Oahu from 2012 to 2018. At first glance, the supply of residences on Hawaii’s most populated island appeared to grow robustly. But when compared to similarly-situated neighborhoods in other parts of the country, it appears that Oahu’s housing supply is unfortunately falling behind.
This week, Mercatus senior research fellow Salim Furth plotted the data on housing supply in the remaining Hawaiian islands from 2012 to 2018. The data can be viewed on Chart 1 below, and are also available as a dynamic map on Datawrapper.
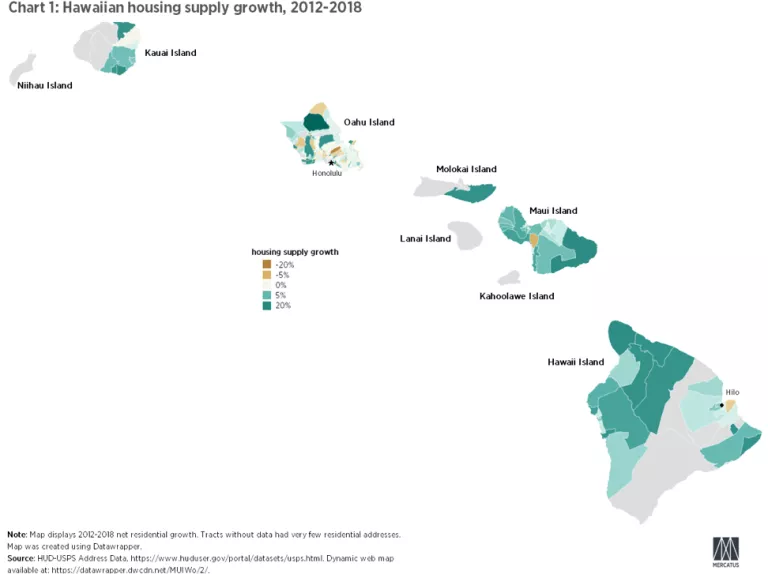
Again, the data at first appear positive. First, it should be noted that there is not much data to begin with. Many of the census tracts had so few residential addresses that they do not register on the map. And many of those that do, while they show positive growth, reflect the construction of only a few new housing units.
For example, the census tract that grew the most on the island of Maui, which is the island to the left of the largest island of Hawaii, constructed 54 new units from 2012 to 2018. This may be better than not constructing any new housing at all, but it does not exactly reflect a mighty housing boom.
And again, the housing growth on the Hawaiian islands often did not keep pace with growth in other US states. Most of the census tracts for counties outside of the island of Oahu did not have enough data to compare to similarly-situated census tracts in the US. We have reproduced the map of the island of Oahu for illustration.
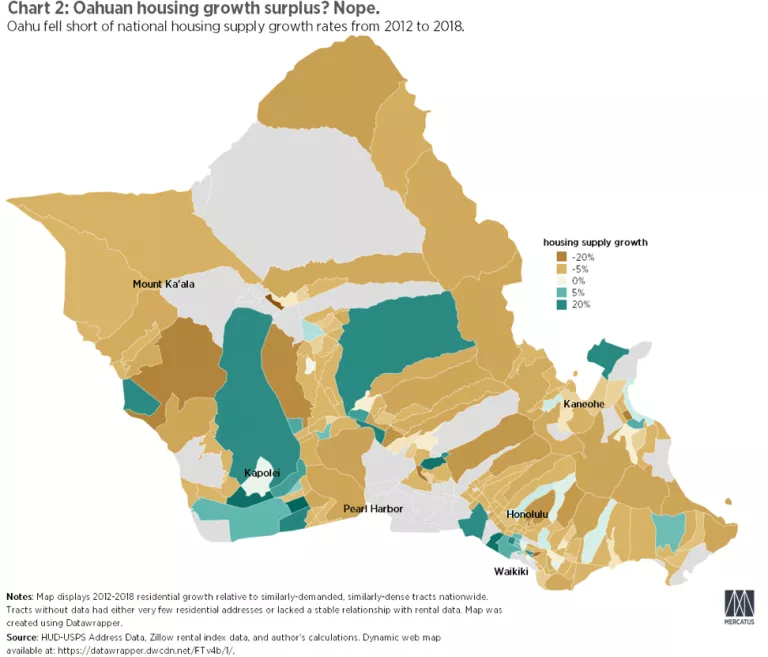
As Chart 2 displays, the vast majority of census tracts in Oahu fall at least five percent behind other similarly-situated US locales. A few districts did exhibit higher growth than comparable parts of the country; particularly, around Kapolei and some parts of south Honolulu. But overall, the comparative picture in Oahu is one of stagnation at best and falling behind on much of the island.
The only other Hawaiian county for which there is enough data to compare is the county of Hawaii on the island of Hawaii, which is the largest island by geography. Still, this only held for a few census tracts. You can download the dataset to view the comparative calculations for the 14 census tracts in the island of Hawaii (around Hilo) for which there were enough data.
Of the 14 census tracts, nine of them exhibited a negative growth surplus from 2012 to 2018, which means housing growth in these areas lagged behind other comparable neighborhoods in the US.
Interested readers should visit both charts on Hawaiian housing supply growth and the Oahuan growth surplus on Datawrapper. You can also download the data directly along with the author’s original calculation.
Photo by George Rose