- | State Fiscal Rankings | 2018 Edition State Fiscal Rankings | 2018 Edition
- |
#47 | Ranking the States by Fiscal Condition: Massachusetts
On the basis of its solvency in five separate categories, Massachusetts ranks 47th among the US states for fiscal health. How does your state rank?

Summary
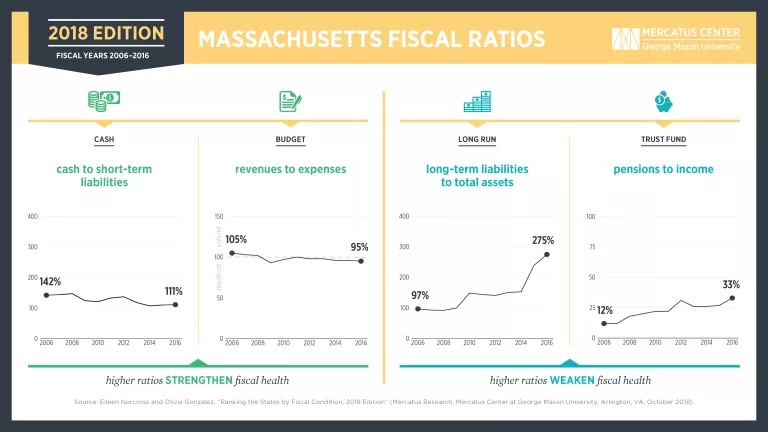
On the basis of its solvency in five separate categories, Massachusetts ranks 47th among the US states for fiscal health. Massachusetts has between 0.48 and 1.16 times the cash needed to cover short-term obligations, well below the US average. Revenues only cover 95 percent of expenses, with a worsening net position of –$491 per capita. In the long run, Massachusetts’s negative net asset ratio of 1.93 points to the use of debt and unfunded obligations. Long-term liabilities are higher than the national average, at 275 percent of total assets, or $11,518 per capita. Total unfunded pension liabilities that are guaranteed to be paid are $144.58 billion, or 33 percent of state personal income. OPEB are $16.32 billion, or 4 percent of state personal income.
Key Terms
- Cash solvency measures whether a state has enough cash to cover its short-term bills, which include accounts payable, vouchers, warrants, and short-term debt. (Massachusetts ranks 48th.)
- Budget solvency measures whether a state can cover its fiscal year spending using current revenues. Did it run a shortfall during the year? (Massachusetts ranks 45th.)
- Long-run solvency measures whether a state has a hedge against large long-term liabilities. Are enough assets available to cushion the state from potential shocks or long-term fiscal risks? (Massachusetts ranks 48th.)
- Service-level solvency measures how high taxes, revenues, and spending are when compared to state personal income. Do states have enough “fiscal slack”? If spending commitments demand more revenues, are states in a good position to increase taxes without harming the economy? Is spending high or low relative to the tax base? (Massachusetts ranks 35th.)
- Trust fund solvency measures how much debt a state has. How large are unfunded pension liabilities and OPEB liabilities compared to the state personal income? (Massachusetts ranks 16th.)
For a complete explanation of the methodology used to calculate Massachusetts's fiscal health rankings, download the full paper and the dataset at mercatus.org/statefiscalrankings.
To read all our work on Massachusetts, go to mercatus.org/states/massachusetts.

