- | Government Spending Government Spending
- | Policy Briefs Policy Briefs
- |
Recent Trends in US Highway and Bridge Conditions
The current transportation funding legislation, the Fixing America’s Surface Transportation (FAST) Act, is set to expire at the end of September 2020. On July 1, 2020, the House of Representatives approved a bill to continue federal funding for highways and bridges—one headline read “House Approves $1.5 Trillion Plan to Fix Crumbling Infrastructure”—but the Senate has yet to take action. Debates over the current condition of major US highways, roads, and bridges are often based on the premise that they are in poor shape—crumbling—and getting worse. Although there is work to be done, the headline overstates the problems with America’s highways, roads, and bridges. The condition of major highways and roads is stable. Furthermore, there are fewer bridges in poor condition today than there were five years ago.
This policy brief uses US Department of Transportation (DOT) state-level highway, road, and bridge data to evaluate current conditions in surface transportation infrastructure. The brief updates a Mercatus on Policy report published in 2017. At that time, the percentage of poor-quality highways and roads had not changed much between 2005 and 2014. There were fewer bridges in poor shape in 2014 than in 2005. However, there was considerable variation in highway, road, and bridge conditions across states. This update for the period from 2014 to 2018 (2014 to 2019 for bridges) draws similar conclusions.
Highway and Road Conditions
States measure the condition of their highways and roads using the International Roughness Index (IRI). The data are reported annually to the DOT. The DOT reports the number of road miles for different ranges of the IRI in a state-by-type-of-road classification. Roads are classified into interstate highways, freeways, and arterial roads. They are also divided into urban and rural regions.
The IRI is an objective measure of the condition of a highway or road. A spring-mounted laser that measures vertical movement is pulled along each state’s highways and roads. The accumulated vertical movement is expressed on an inches-per-mile basis. A higher IRI indicates a decline in road quality. For safety, lower values are needed where vehicles move quickly across the surface of the road. For speeds greater than US limits or those used on airport runways, the index should be between 25 and 100. For speeds on US highways, an index between 100 and 200 is acceptable. Index values greater than 200 are considered an indicator of poor quality but are adequate where traffic moves well below highway speeds. In the tables included in this brief, IRI values above 170 are considered an indicator of a poor-quality road or highway.
The indicator that measures the percentage of a state’s highways or roads that are in poor condition is calculated by taking a state’s highway or road mileage with an IRI greater than 170 and dividing it by the total mileage in a rural or urban category. Table 1 reports the percentage of highways and roads in poor condition in the 50 US states for the years 2014 and 2018.
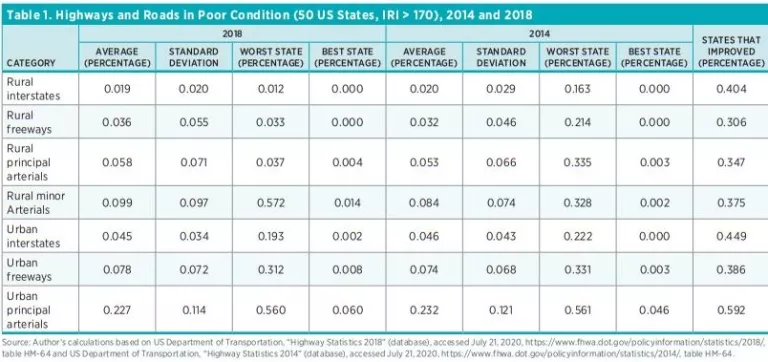
Over the four-year period, the average percentage of highways or roads in poor condition has been fairly stable. Of the seven categories, three (rural interstates, urban interstates, and urban principle arterials) showed modest improvement. The remainder showed modest declines. The percentage of states that experienced an improvement in highway and road condition is reported in the last column of table 1. For each category except rural freeways, at least one-third of the states experienced an improvement in highways and roads.
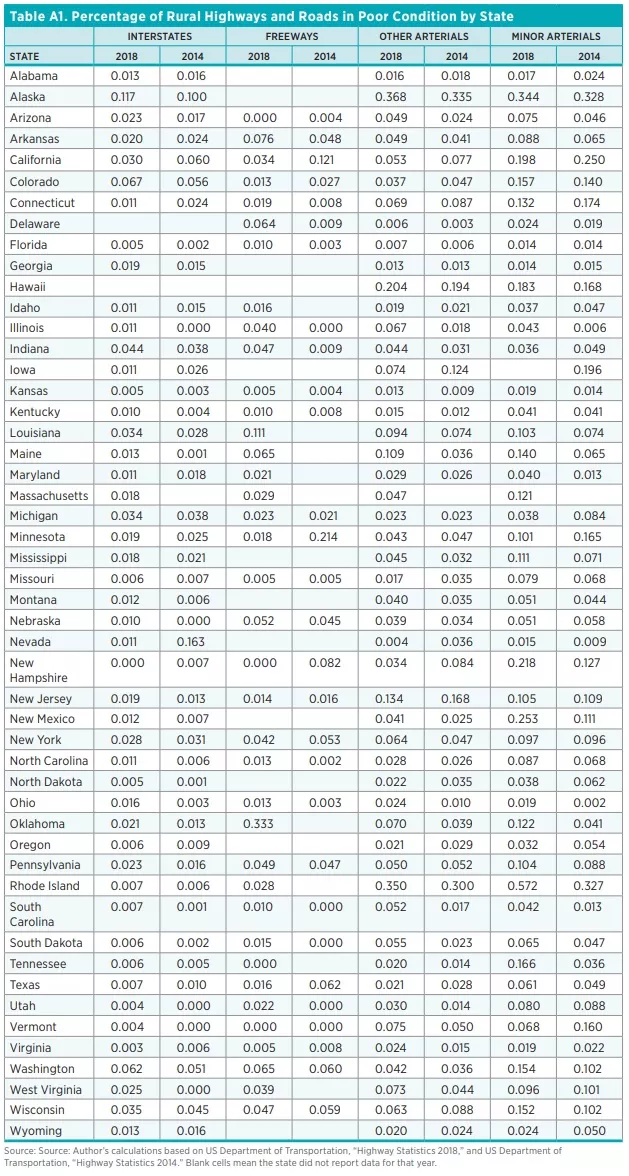
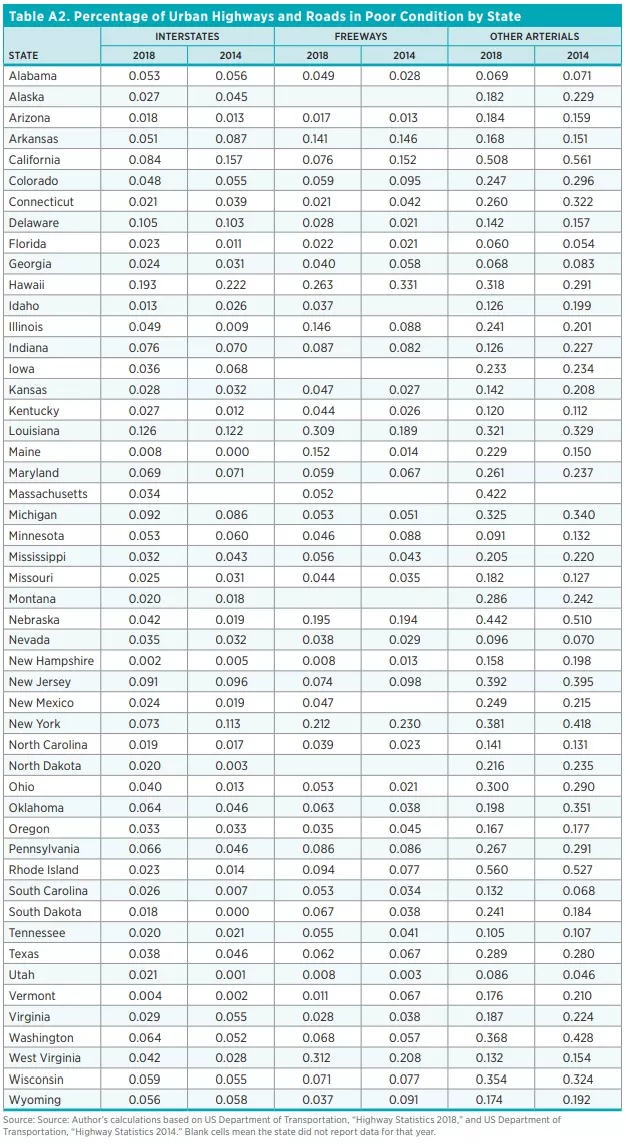
The dispersion in road conditions across states, as measured by the standard deviation, is like that seen in the 2005–2014 data. For the recent period, there was a narrowing of the dispersion in interstate highway conditions across states in both rural and urban areas, suggesting that poor-quality stretches of roads were improved. This result, along with the decline in the percentage of interstate highways in poor condition, indicates a modest improvement in the quality of the Interstate Highway System between 2014 and 2018. All state-by-state performances are shown in the appendix (tables A1 and A2).
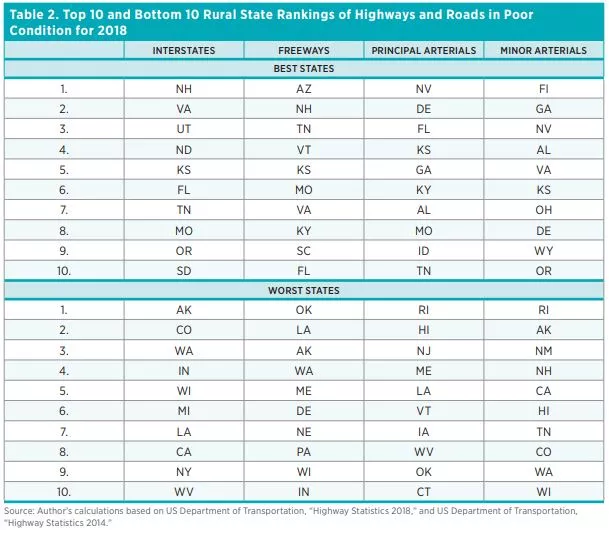
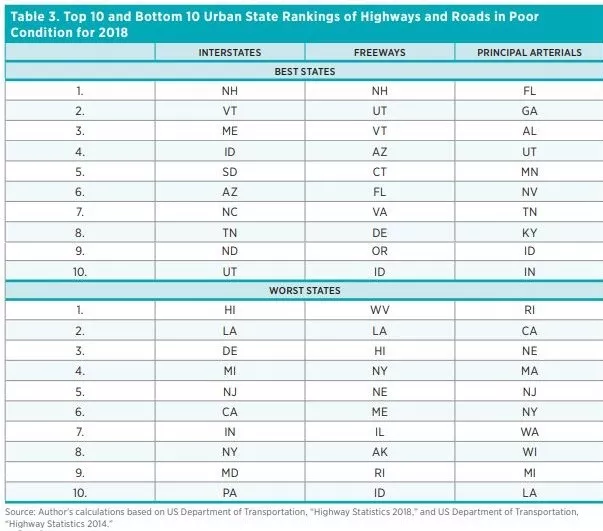
Tables 2 and 3 show the top 10 and bottom 10 state performances with respect to highway and road conditions in 2018.
Comparison to Other Countries
How does the United States compare to other industrialized countries? While there is no comparable IRI data for these countries, survey data can offer a perspective on the relative status of US roads. The World Economic Forum conducts a survey of 14,000 business leaders, asking them to rate roads in their home countries. They rate the roads on a one-to-seven scale, with seven being best. The G-7 average score in 2018 was 5.5. The United States ranked 10 in the world with a score of 5.7. The only G7 countries ahead of the United States were Japan and France with scores of 6.1 and 6.0 respectively. It appears that the condition of US highways and roads is comparable to that of other industrialized countries.
Bridge Conditions
Each state conducts a survey of bridges and reports the results to the DOT. These results are reported in the annual Survey of Bridges. Since 2017, the condition of a bridge is classified as good, fair, or poor based on inspections. A rating of seven or more results in the bridge being classified as good. Bridge ratings less than or equal to four are classified as Poor. Bridges with a score greater than four or five are classified as fair.
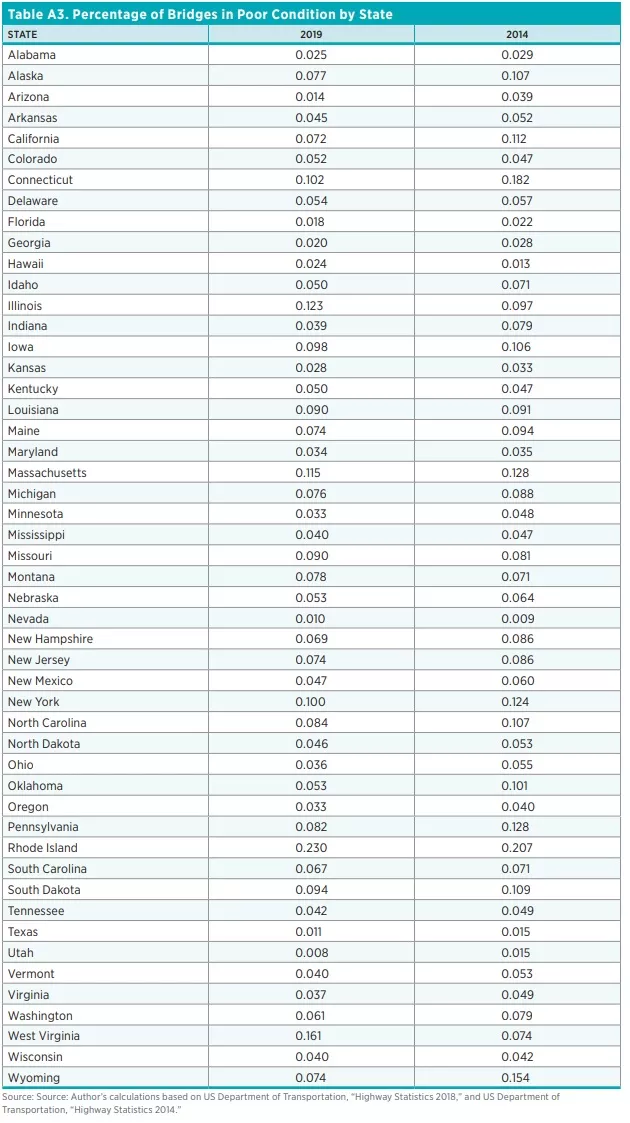
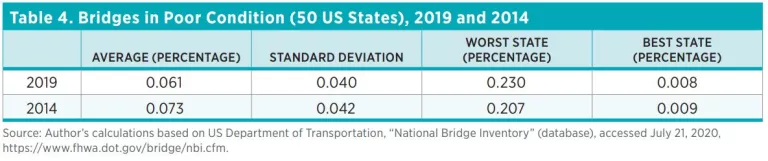
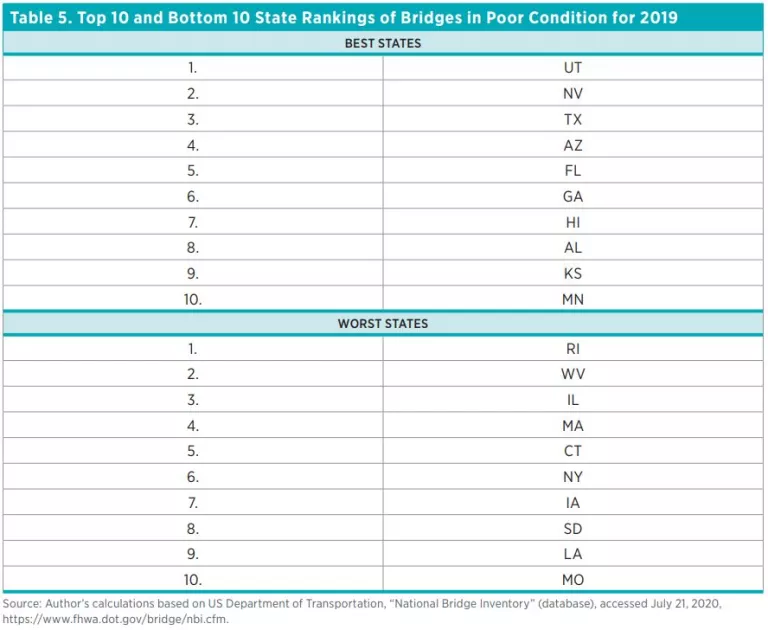
For each state, the percentage of bridges in poor condition is calculated by dividing the square meters of bridge span rated in poor condition by the total square meters of bridges in the state. The results are reported in table 4. The average percentage of bridges in poor condition declined from 7.3 percent in 2014 to 6.1 percent in 2019. The dispersion of bridges in poor condition declined slightly from 4.2 percent in 2014 to 4 percent in 2019, suggesting that there is slightly less diversity in bridge condition across the states. This improvement continues the trend that occurred between 2005 and 2014. All state-by-state bridge conditions are shown in table A3 for 2014 and 2019. Eighty-two percent of the states experienced a decline in square meters of bridge surface classified as being in poor condition between 2014 and 2019. Table 5 shows the top 10 and bottom 10 state rankings of bridges in poor condition in 2019.
Conclusions
This brief examines the recent trends in major highway, road, and bridge conditions in the United States from 2014 to 2018 (2014 to 2019 for bridges). The results indicate that the average condition of major US highways and roads has not changed much. While all the changes are small, improvements appear in rural interstates, urban interstates, and urban principal arterial roads. On the other hand, modest declines occur in road quality for freeways and rural arterials. Over the four-year period, the dispersion in quality has increased for each category except rural interstates and rural principal arterials.
The percentage of bridges in poor condition has declined between 2014 and 2019. Eighty-two percent of the states experienced some improvement over this time period. It appears that states have made a concerted effort to improve bridges since 2005.
These results show that the condition of US highways and roads is stable. The condition of US bridges has improved. It is not accurate to describe US highways, roads, and bridges as crumbling.
Appendix