- | Housing Housing
- | Working Papers Working Papers
- |
State Fiscal Condition: Ranking the 50 States | 2014 Edition
New research from Sarah Arnett examines states’ abilities to meet their financial obligations in the face of state budget challenges that have far outlasted the Great Recession. Fiscal simulations by the Government Accountability Office suggest that despite recent gains in tax revenues and pension assets, the long-term outlook for states’ fiscal condition is negative (GAO 2013). These simulations predict that states will have yearly difficulties balancing revenues and expenditures due, in part, to rising health care costs and the cost of funding state and local pensions
Arnett uses four different indices to analyze state solvency using each state’s fiscal year 2012 Comprehensive Annual Financial Report data. She then weights these four indices to create the State Fiscal Condition Index below.
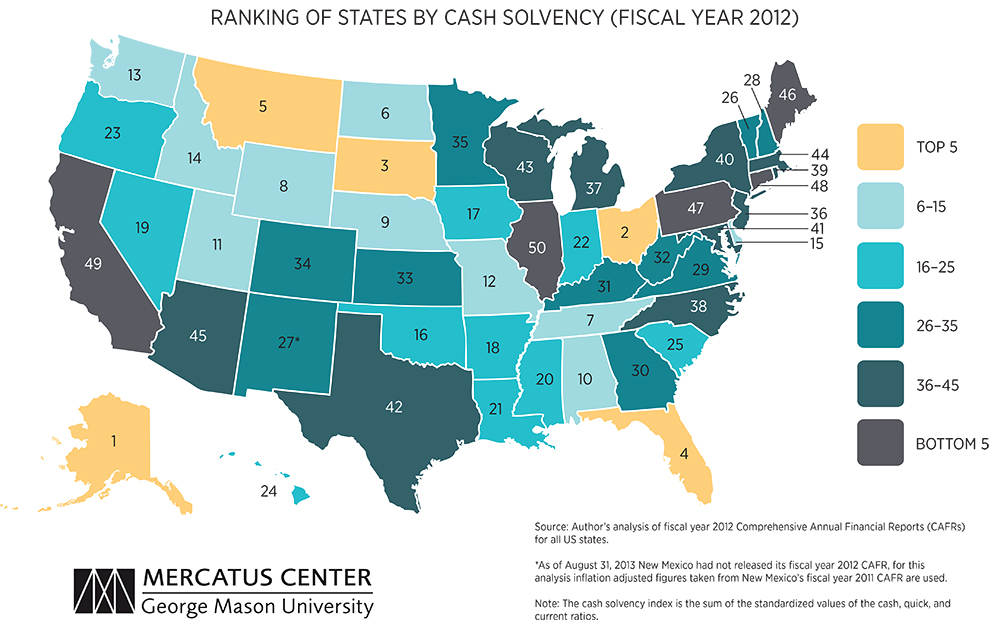
Cash Solvency
A state’s cash solvency takes into account the cash the state can easily access to pay its bills in the near term, reflecting the state government’s liquidity. The map below indicates that most states have enough cash on hand to meet their short-term obligations.
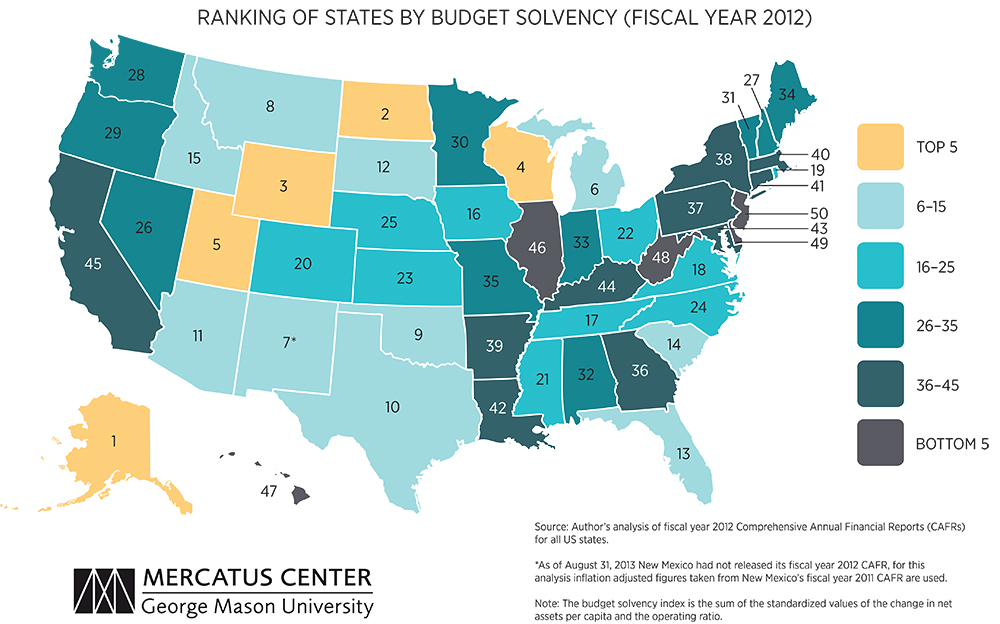
Budget Solvency
A state’s budget solvency is its ability to create enough revenue to cover its expenditures over a fiscal year. Budget solvency varies greatly across states. As the map below shows, in fiscal year 2012-13 states had an operating ratio below 1, indicating a budget deficit.
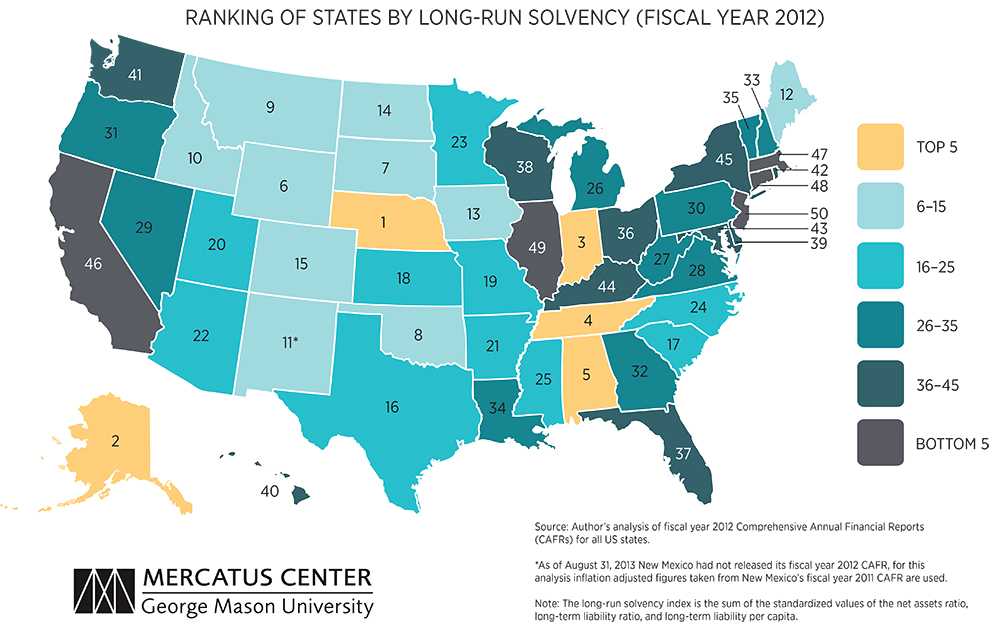
Long-Run Solvency
Long-run solvency measures a state’s ability to use incoming revenue to cover all its expenditures, including long-term obligations such as guaranteed pension benefits and infrastructure maintenance. Long-run solvency is less sensitive to economic trends than the other measures examined here.
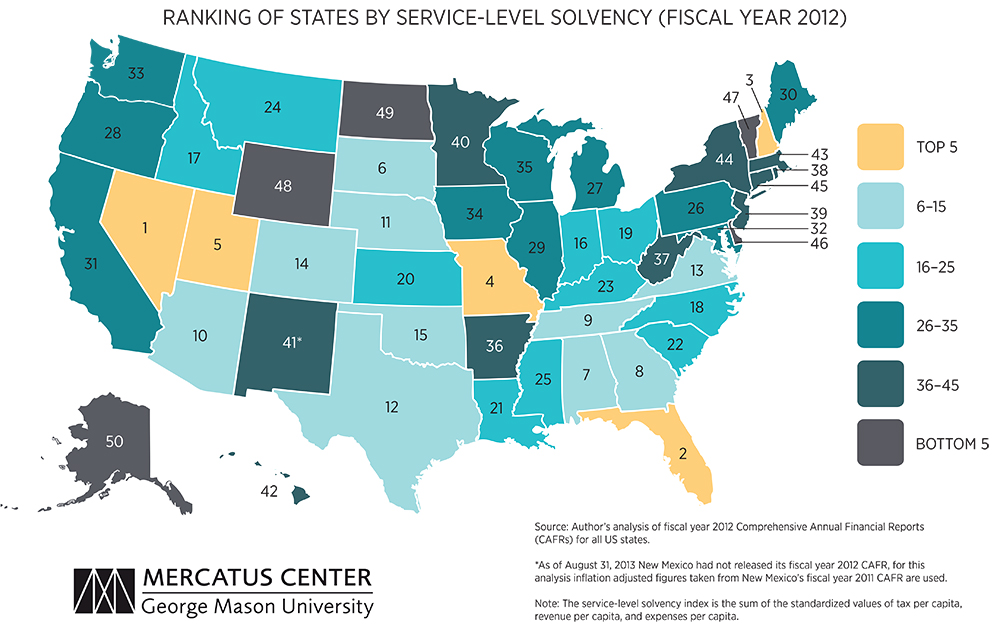
Service-Level Solvency
Service-level solvency is the most difficult to measure because it reflects whether state governments have the resources to provide their residents with an adequate level of services. A state’s service-level solvency is measured using taxes and revenue per capita, along with expenditures per capita.
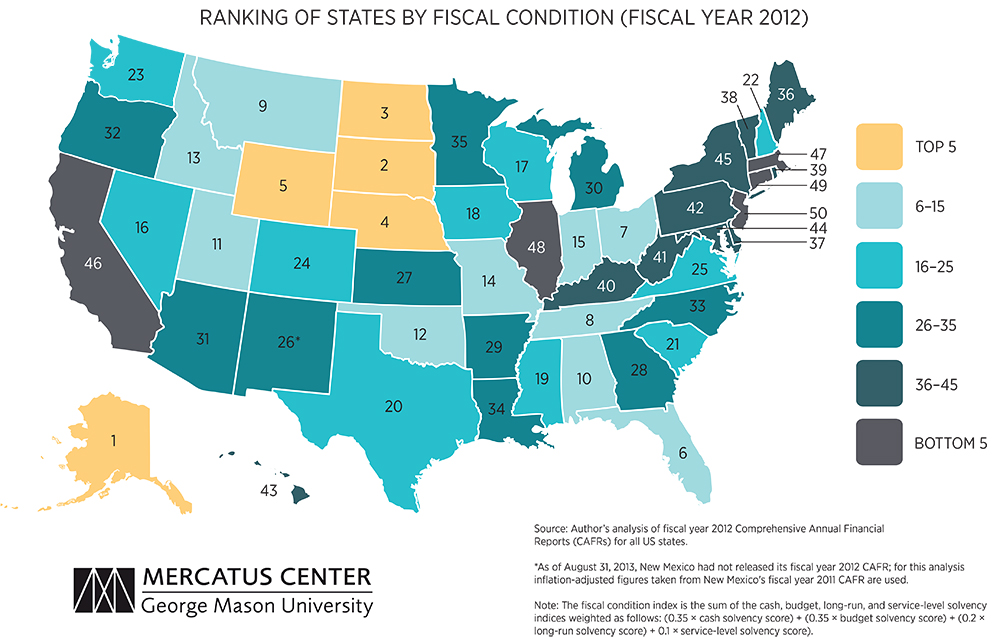
State Fiscal Condition Index
Using the four solvency indices above, Arnett creates an overall State Fiscal Condition Index. She improves on past research about fiscal metrics by weighting each solvency indicator based on the timeframe in which it will affect state residents. Although the ranking is a snapshot in time, the states at the bottom are there due to years of poor financial management decisions, bad economic conditions, or a combination of the two. New Jersey and Connecticut face similar problems: tax revenues that have not kept up with expenditures, use of budget practices that only appeared to balance their annual budgets, and significant debt levels as a result of decades of using bonds without being able to pay for them (State Budget Crisis Task Force 2012). In addition, both states have underfunded their pension systems, resulting in billions in unfunded liabilities.
Click here to read the entire paper.
Related Content
- | Housing Housing
- | Research Papers Research Papers
A Primer on State and Local Tax Policy: Trade-Offs among Tax Instruments
- | Government Spending Government Spending
- | Data Visualizations Data Visualizations
Government-Financed Employment and the Real Private Sector in the 50 States
- | Government Spending Government Spending
- | Books Books
Freedom in the 50 States, 2013 Edition


