- | Housing Housing
- | Research Papers Research Papers
- |
California Zoning: Housing Construction and a New Ranking of Local Land Use Regulation
Ranking California’s Cities on the Stringency of Land Use Regulation
California’s statewide housing crunch is not news. Academics, journalists, and political leaders have increasingly focused on strict regulation of housing supply as the culprit behind the state’s high and rising rent and home prices. Although California has many statewide rules affecting housing construction, zoning restrictions are enacted by city and county governments. In “California Zoning: Housing Construction and a New Ranking of Local Land Use Regulation,” Salim Furth and Olivia Gonzalez develop an index of regulatory stringency that ranks 249 California cities, and they find that more regulation is associated with slower housing growth.
Building an Index
Furth and Gonzalez take advantage of a detailed 2018 survey by Sarah Mawhorter and Carolina Reid of the Terner Center for Housing Innovation at the University of California, Berkeley. Mawhorter and Reid’s data, the Terner California Residential Land Use Survey, present survey responses from local officials who were asked about many facets of their regulatory regimes.
Building on Mawhorter and Reid’s work, Furth and Gonzalez inspect local regulations to fill in blanks left in the survey. Then they use a statistical method known as exploratory factor analysis to test whether local regulations such as minimum lot sizes, height limits, and parking minimums are systematically related.
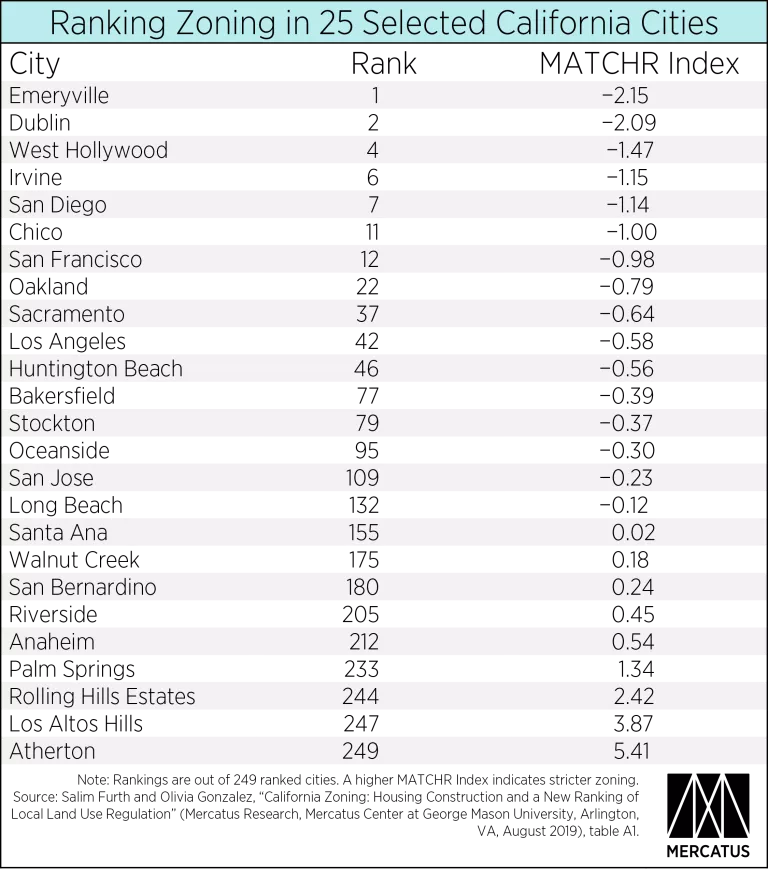
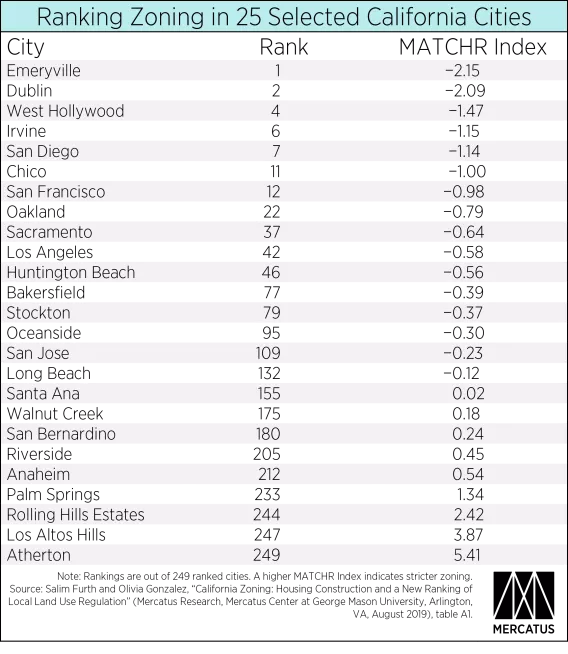
The authors find that the individual regulations are indeed correlated, and they construct a single index value to measure the degree of regulation. Naming it the Mercatus-Augmented Terner California Housing Regulation (MATCHR) Index, the authors are able to calculate it for 249 cities and the unincorporated portions of 16 counties.
Regulation and Construction
While housing construction is also influenced by the availability of land and the level of demand, there is, unsurprisingly, a negative correlation between regulation and housing supply growth. Using an estimate of housing supply growth adjusted for existing density and the growth in demand, Furth and Gonzalez find a much stronger, and highly significant, correlation with regulation.
The correlation is clearly driven by extreme cases. The 10 most-regulated cities reached 2018 with 9 percent fewer homes than expected based on their density and demand growth since 2012. And the 10 least-regulated California cities reached 2018 with 3 percent more homes than expected. Two suburban cities—Dublin and Irvine—led the way on growth and offer a model of relatively permissive regulation that other California suburbs can imitate.
Key Takeaway
Even in highly regulated housing markets like coastal California, residential development restrictions differ substantially and are meaningful in determining where new housing can be built. Even as lawmakers consider statewide reforms, local leaders can meaningfully reform their own rules to allow more housing opportunities.