- | Corporate Welfare Corporate Welfare
- | Data Visualizations Data Visualizations
- |
The Opportunity Cost of Corporate Welfare
Targeted Economic Development Incentives and GASB 77 State Comparisons
Economic competitiveness is a priority for many state and local policymakers. These policymakers may adopt a number of strategies to encourage economic growth and development in their regions. For example, South Dakota and Wyoming have neither a corporate income nor a gross receipts tax. Similarly, Alaska, Montana, New Hampshire, and Oregon have no state sales tax. Such measures foster economic competitiveness through economic freedom, and they do so without favoring one firm or business over others. The evidence is abundant that economic freedom correlates with economic development. One recent study found that a 10 percent increase in state-level economic freedom is associated with a 5 percent increase in per capita GDP.
Increasingly, however, states and localities have employed targeted incentives to lure firms. Instead of lowering tax rates for all or improving the regulatory environment for everyone, targeted incentives privilege particular firms through tax abatements, cash subsidies, loans, loan guarantees, or in-kind donations. Estimates vary, but states spend somewhere between $48 billion and $70 billion annually on such incentives. And as a share of GDP, targeted incentives have tripled since the 1990s. Neither economic theory nor empirical evidence suggests that these targeted incentives work. In fact, research suggests that those states that hand out more targeted incentives tend to have lower levels of measured economic freedom. In other words, those states that pursue the targeted approach more vigorously seem to be less likely to pursue the growth strategy that actually works.
Unfortunately, state and local incentives have historically lacked transparency. In 2015, however, the Government Accounting Standards Board (GASB) issued Statement No. 77 requiring all states and localities with generally accepted accounting principle (GAAP)–compliant budgets to disclose their revenue loss resulting from corporate incentives. Good Jobs First, using state comprehensive annual financial reports (CAFRs), maintains the most current database of targeted economic development incentives at the state and local levels.
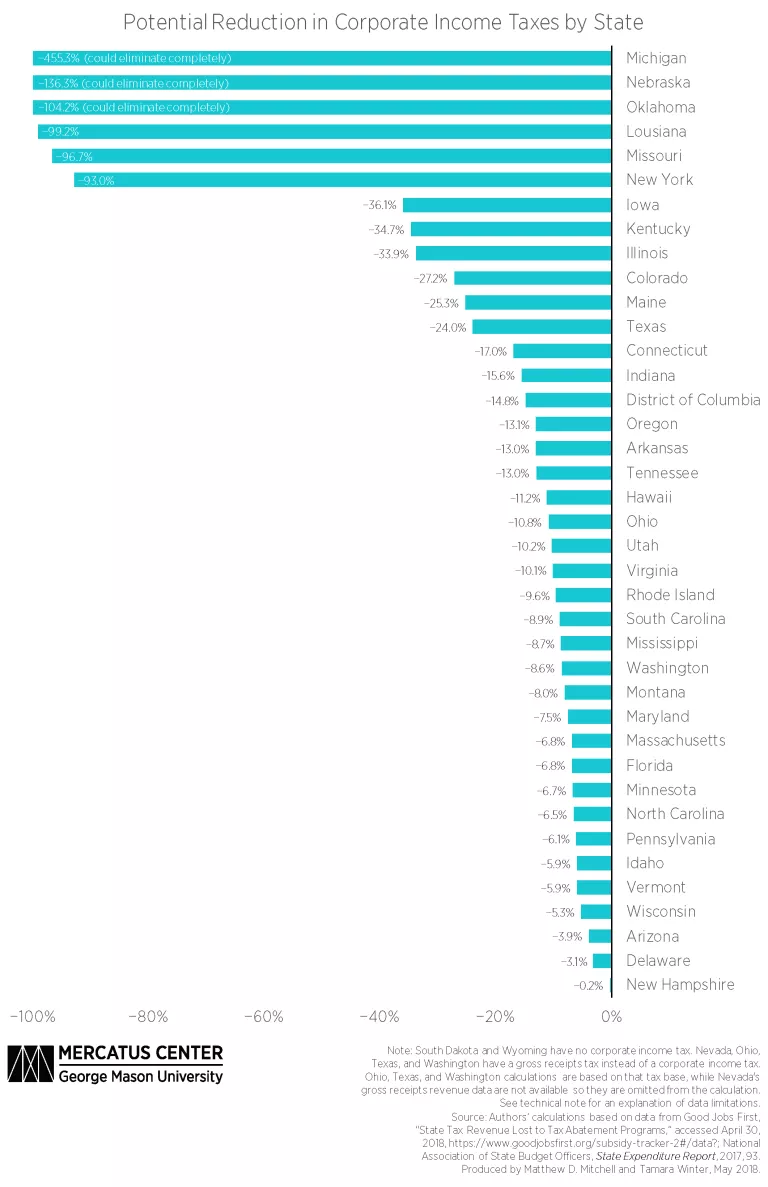
The costs of corporate incentives are borne by taxpayers who finance these subsidies, tax abatements, and loan guarantees, and every incentive has an opportunity cost. These charts reflect our state-by-state calculations of how much lawmakers could reduce their states’ corporate income, personal income, sales, and total tax burdens if they eliminated corporate incentives.
In nearly every state, eliminating corporate incentives would allow for a reduction of the major taxes levied on constituents. Here are some examples:
- Several states, including Missouri and New York, could reduce their corporate tax rates by more than 90 percent if policymakers eliminated corporate incentives. Michigan, Nebraska, and Oklahoma could completely eliminate corporate taxation and still have room for cuts in other taxes if they eliminated all corporate incentives.
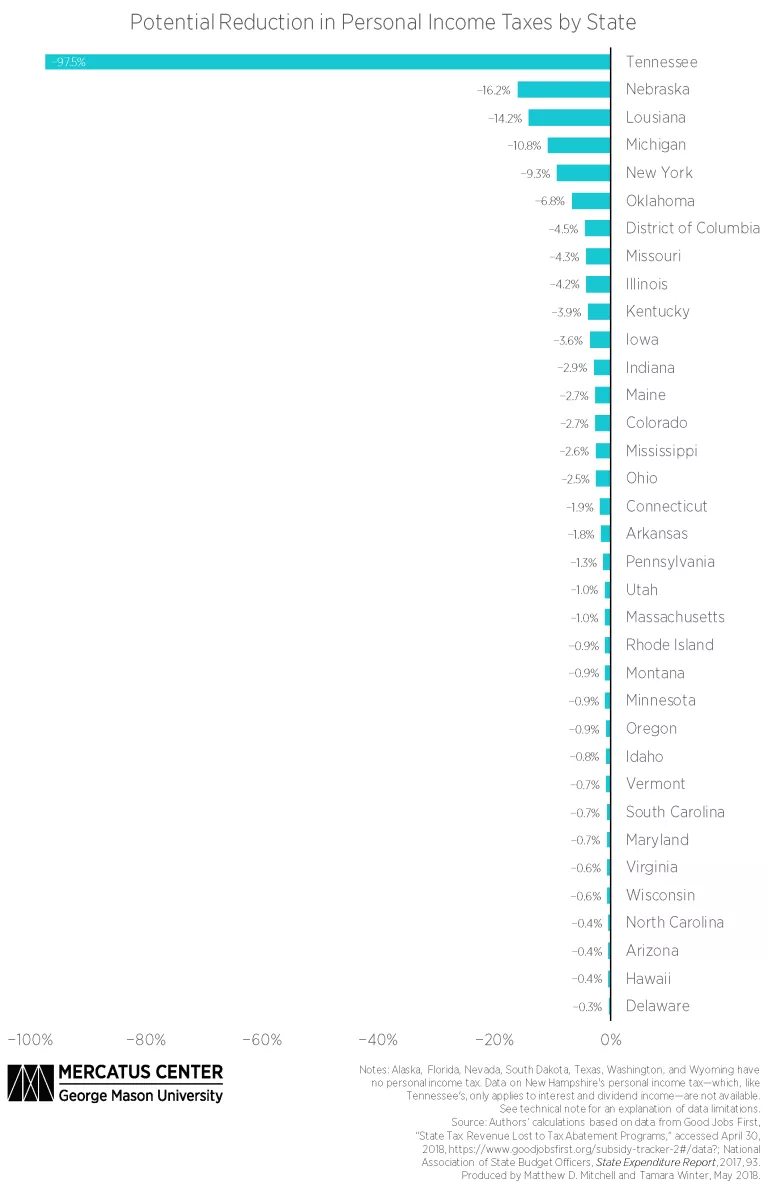
- Lawmakers in Louisiana, Michigan, and Nebraska could reduce their states’ personal income tax rates by 14.2, 10.8, and 16.2 percent, respectively, if they eliminated corporate incentives. Tennessee lawmakers could reduce their state’s personal income tax rate by nearly 98 percent if they eliminated all corporate incentives. This is not nearly as dramatic as it seems, however, because Tennessee’s personal income tax only applies to dividend and interest income, so the state’s personal income tax base is quite narrow compared to the tax bases of other states.
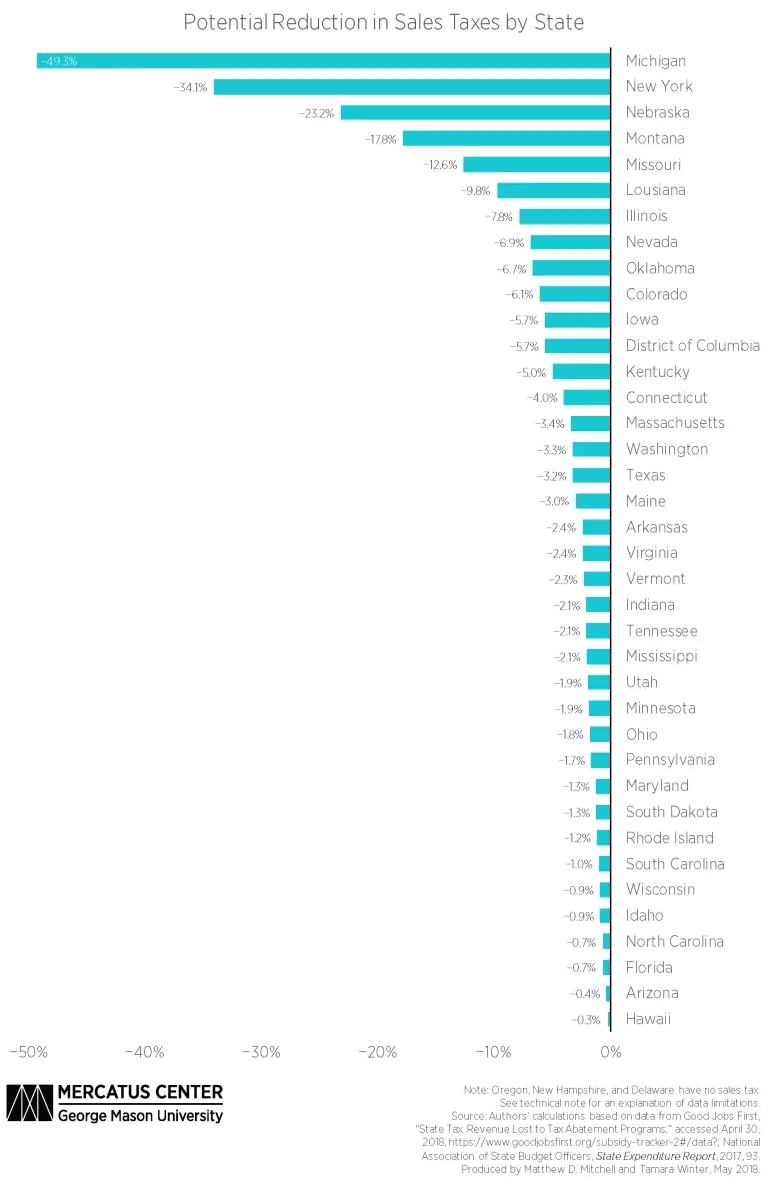
- Taxpayers in Nebraska could enjoy a 23.2 percent reduction in their sales tax rate if state lawmakers eliminated corporate incentives. Similarly, if lawmakers in New York eliminated corporate incentives, they could reduce the state sales tax rate by 34.1 percent. More dramatically, Michigan state lawmakers could reduce their state sales tax rate by 49.3 percent in the absence of corporate incentives.
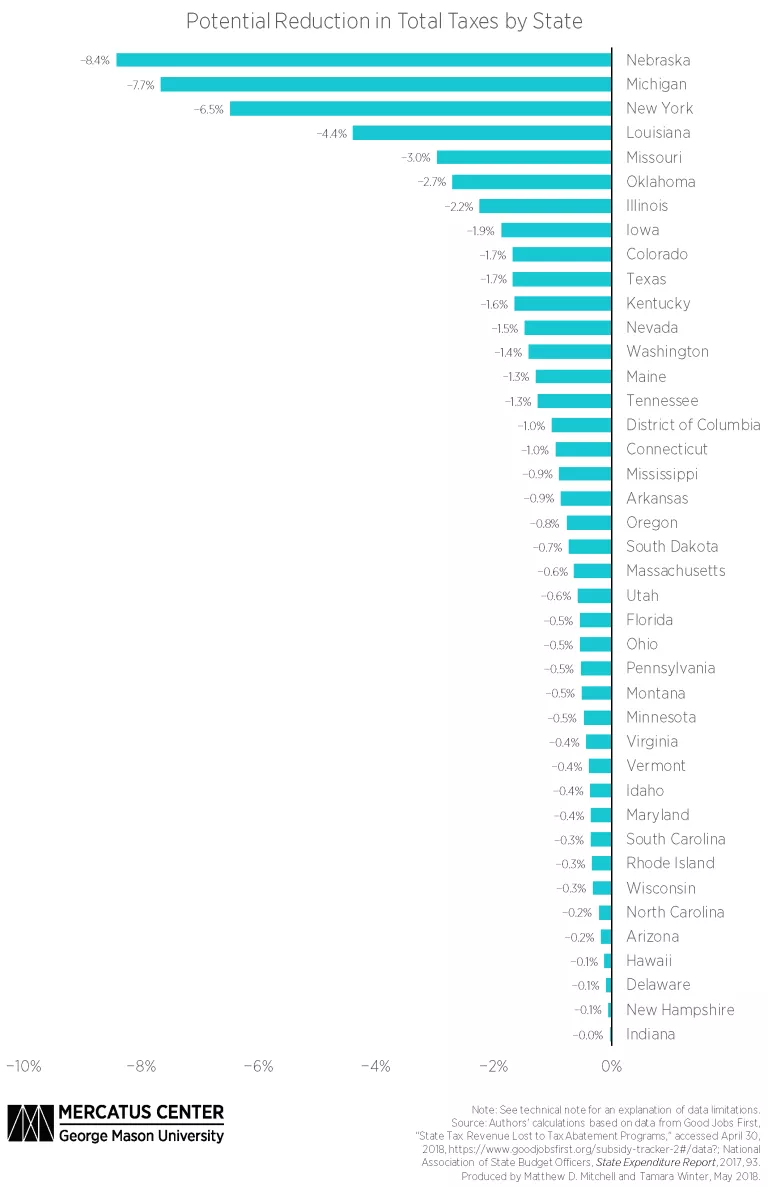
- If Nebraska state policymakers eliminated corporate incentives, they could reduce total taxation by 8.43 percent. Similarly, Michigan and New York could reduce total taxation by 7.67 percent and 6.5 percent, respectively.
If state lawmakers want to create an equitable and business-friendly environment for all firms and industries, they should avoid offering targeted corporate incentives and instead pursue an economic growth strategy that works by enhancing the economic freedom of all their citizens.
Technical Note
The data include only past expenditures, so pending incentives, such as the $4.5 billion Wisconsin pledged to Foxconn Technology Group, are not yet reflected in the state CAFRs and consequently are not in the Good Jobs First database. As more data become available, the opportunity cost of these incentives will likely grow. The tax savings calculations in this chart series are based on the value of expenditures on incentives recorded before April 2018. Accordingly, Alabama, Alaska, California, Georgia, Kansas, New Jersey, New Mexico, North Dakota, West Virginia, and Wyoming were not included in this chart series.
Although we use the best information sources available, the quality and comparability of the underlying data vary by state, and as a result we are limited in our ability to make a perfect apples-to-apples comparison across all states. Some specific limitations:
- If a state administers a subsidy through its budget rather than through its tax code, then the subsidy may not appear in the Good Jobs First database and will not be accounted for here, meaning that our estimate will understate the opportunity cost of corporate tax privileges.
- If a state earmarks a portion of its tax revenue away from its general fund, the tax revenue data reported by the National Association of State Budget Officers—which focuses on each state’s general fund—will appear smaller. As a result, we will overstate the opportunity cost of corporate tax privileges.
We view this as a work in progress and intend to update the numbers as new data and better information become available. We welcome suggestions for improvements in methodology.

