- | Government Spending Government Spending
- | Policy Briefs Policy Briefs
- |
The Impact of Public Debt on Interest Rates
Rising US debt is driving interest rates higher than CBO forecasts predict
When low interest rates persisted throughout the 2010s, many economists began to view them as the new normal. As recently as 2020, Harvard economists Larry Summers and Jason Furman noted: “Markets suggest that five years out there is a 72 percent chance that nominal rates will be at their current level of effectively zero or even negative.”[1] In fact, after an upward trajectory in 2021, the 10-year Treasury yield has averaged about 4.1 percent since 2022. While various structural factors, such as an aging population and foreign demand for Treasuries, did place downward pressure on interest rates for decades, the upward pressure on interest rates caused by a different set of factors has been downplayed—particularly the upward pressure caused by growing public debt.
A key institution behind this oversight is the Congressional Budget Office (CBO), a federal agency responsible for providing budgetary analysis to Congress. While the bulk of empirical literature suggests that debt places significant upward pressure on interest rates over time, the CBO recently reduced its debt impact parameter to about half the effect that most studies suggest, significantly underestimating the impact of public debt on long-term interest rates. To address this issue, this brief uses quarterly data from 1985 through 2024 to determine how different structural factors have influenced changes in interest rates, with a particular focus on the impact of public debt. The results suggest that the CBO debt impact parameter is about 2 to 3 basis points (bps) too low, which means that the CBO’s long-term budget projections are far too conservative. This understating of the debt impact parameter could have serious implications for long-term budget sustainability.
Empirical Literature on the Public Debt Impact Parameter
A survey of empirical research over the past two decades reveals a consistent relationship between rising public debt and higher interest rates (table 1). Early empirical analysis of the impact of public debt on interest rates in the United States typically finds estimates ranging from 3 to 4 bps.[2] In other words, for every percentage point (ppt) increase in the debt ratio, interest rates increase by 3 to 4 bps. In a 2004 economic analysis, Brookings Institution economists William Gale and Peter Orszag estimate the impact of budgetary dynamics and savings on interest rates and find that every 1 ppt increase in the debt ratio raises long-term interest rates by 4.9 bps.[3] Using panel data for 19 developed economies, a 2006 International Monetary Fund (IMF) working paper finds the simulated and estimated interest rate effects of government debt to be between 2 and 5 bps when using a fixed effects model.[4]
With the onset of the Great Financial Crisis, some economists updated their prior estimates with new datasets and methodology. For example, in a journal article published in 2009, Thomas Laubach presented new evidence on the interest rate effects of budget deficits and debt.[5] Laubach finds that a 1 ppt increase in the projected debt ratio raises interest rates by about 4 bps, slightly higher than his 2003 estimate of about 3.5 bps. A 2010 IMF working paper analyzing 31 advanced and emerging market economies found that debt had a notably large effect on bond yields on rates, with impacts exceeding 5 bps in some cases.[6]
In a 2013 journal article, Federal Reserve economists estimate a term structure model covering the period 1994–2007, building on theories that link investors’ preferred habitat for various government debt maturities to a term premium that is based on the quantity of longer-term securities held by investors.[7] Their calibration finds that a 1 percentage point increase in the debt ratio, all else equal, raises the 10-year term premium by 5.8 bps.
More recently, economists have updated prior empirical analysis with new datasets, methodologies, and variables. In a long-form blog post from 2019, budgetary economist Ernie Tedeschi updates and expands the empirical framework of Francis and Veronica Warnock.[8] By observing US data from 1984 to 2018, Tedeschi reveals that each ppt increase in the debt ratio raises the 10-year yield by 4.21 bps, all else equal. In 2022, American Enterprise Institute (AEI) economists further expand (1981–2022) and update Tedeschi’s framework to consider the impact of quantitative easing.[9] The authors find that a 1 ppt increase in publicly held debt raises long-term rates by 4.5 bps, which is slightly higher than Tedeschi’s 2019 estimate.
Federal Reserve Bank economists adopted Canlin Li and Min Wei’s term premium but altered the assumptions—investors are assumed to have limited foresight about the expected path of government debt.[10] While this approach contradicts the principles of Ricardian equivalence, it is an interesting experiment in measuring how expectations can shift the debt-interest rate dynamics. In their most plausible calibration, the authors find that the effect of government debt under limited foresight raises the term premium by 3.5 bps.[11]
Finally, in a recently published journal article, “Debt, Deficits, and Interest Rates,” Federal Reserve economist Christopher Cotton provides a comprehensive high-frequency identification approach to the relationship between the debt ratio and interest rates, finding an impact of 4.3 bps.[12]
New approaches tend to use updated timeframes—while older studies use data covering the late 1970s through the mid-2000s, the new studies run from about 1980 through 2019 or 2022. Some of these approaches measure how interest rates change in a high-frequency window around release (i.e., a 24-hour window), while others run regressions on a recursive sample to see how the coefficient changes over time. Newer studies also add additional variables—such as the share of elderly population—to their models. Taken together, these updated studies continue to affirm a positive and statistically significant relationship between higher debt ratios and interest rates, with most estimates clustering around a 4 bps increase per percentage point of debt.

CBO Impact Parameter Understates the Impact of Debt on Interest Rates
Despite the literature estimating a 3 to 5 bps impact of public debt on interest rates, with the latest empirical studies estimating 4 bps or more, the CBO recently reduced the impact parameter in their production function from 2.5 bps to 2 bps. This figure is largely based on the lower bound estimate of one 2019 CBO working paper, which estimated the impact of debt on interest rates to be between 2 and 3 bps.[13] The CBO recently reiterated its support for this change in its latest 2024 publication, which extends the sample used in its 2019 working paper. The authors of this latest study conclude by noting that “Our analyses offer substantial evidence that 2 bps is in the middle of the range of likely values for the DSIR [debt sensitivity of interest rates].”[14]
The updated 2024 CBO analysis only extends the original data by nine observations (83 total observations) and is therefore not a significant departure from the 2019 study. In the 2024 analysis the authors use a forward-looking specification, which might be why they understate the more immediate impact of changes in public debt. By regressing 5-year ahead 10-year-forward Treasury rates on projected debt, the authors assume that bond markets fully account for the debt effect ahead of time. In that sense, this method captures only the marginal change in rates beyond what markets have already forecasted and thus dilutes the real debt impact.
While some of the independent variables included in the CBO specification, such as foreign and Federal Reserve holdings of US Treasury securities, may soak up part of the debt effect on interest rates, this behavior does not account for reversals or changes in some of these variables in recent years. For example, foreign holdings of US securities as a share of US debt have been in a sharp decline for at least a decade, while the Federal Reserve has been running securities off the balance sheet for the past three years. What’s more, the central bank’s monetization of debt artificially suppresses the real debt effect on interest rates. As a result, during periods of significant monetization, such as 2009–14 or 2020–22, the observed impact of debt on interest rates may appear weaker, potentially diluting the real public debt impact. Additionally, the CBO’s approach does not properly account for high-leverage data points, such as episodes of unusually rapid debt accumulation, as in the spring of 2020. Had the CBO conducted influence diagnostics, extreme points in the data would not have biased their estimate downward.
Estimating Determinants of Changes in Interest Rates
This section examines the factors that influence changes in interest rates over time, adding to the existing literature on this topic. While no specification is without limitations, the approach here uses a broad set of structural variables to more fully capture the potential impact of rising public debt alongside other key drivers.
Data
To determine which factors drive changes in interest rates over time and whether these factors depress or inflate rates, this policy brief draws on a comprehensive dataset spanning nearly four decades. This analysis uses quarterly data from 1985 to 2024 and includes six variables, including (1) public debt ratio, (2) 3-month Treasury rate minus 10-year inflation, (3) 1-year minus 10-year inflation spread, (4) 1-year real growth expectations, (5) change in share of the population over 65 years old, and (6) foreign-held debt to GDP. Data on interest rates (3-month and 10-year) and foreign-held debt are sourced from the US Treasury; data on elderly population share sourced from the World Bank (WDI);[15] and debt data sourced from the Federal Reserve Bank of St. Louis. The Federal Reserve Bank of Philadelphia Survey of Professional Forecasters is the source of data for 1-year and 10-year inflation expectations, as well as for expected real GDP figures.
Model
The general form of the regression model is
i_t = β_0 + β_1 ⋅ DebtRatio_t + β_2 ⋅ (3Mo – 10YrInfExp)_t + β_3 ⋅ InflationSpread_t + β_4 ⋅ RealGDPExp_t + β_5 ⋅ PopulationOver65_t + β_6 ⋅ ForeignDebtShare_t + ϵ_t,
where the variables are defined as the following:
- i_t: Interest Rate (10-year Treasury yield)
- DebtRatio_t: Debt-to-GDP Ratio (% of GDP). Expected Sign: Positive. An increase in public debt as a share of GDP may increase interest rates by crowding out private investment and raising the risk premium.
- (3Mo – 10YrInfExp)_t: Spread between 3-month and 10-year inflation expectations (a proxy for the term premium). Expected Sign: Positive. A steepening term spread reflects higher expected inflation volatility and term premiums.
- InflationSpread_t: Difference between expected and actual inflation. Expected Sign: Positive. An unanticipated rise in inflation may prompt upward movement in interest rates.
- RealGDPExp_t: Expected real GDP growth rate. Expected Sign: Uncertain. If growth expectations rise due to increased demand for credit, then this may increase interest rates. However, if growth expectations rise due to improvements in productivity, then the effect on interest rates might be neutral or even negative.
- PopulationOver65_t: Share of population over 65 years old. Expected Sign: Negative. An aging population is expected to drive increased savings which may place downward pressure on interest rates.
- ForeignDebtShare_t: Share of US debt held by foreign investors (global capital markets influence). Expected Sign: Negative. Greater foreign demand for US Treasury securities may reduce interest rates through capital inflows.
- ϵ_t: Error term (unobserved factors affecting interest rates)
Analysis
Table 2 presents the estimates using ordinary least squares (OLS). The results show that, holding all else equal, a 1 percentage point increase in the debt ratio raises interest rates by 4.6 bps. The coefficient is statistically significant. This estimate is also largely consistent with the most recent empirical analyses, such as the one by AEI economists Mark Warshawsky and John Mantus, as well as Cotton’s paper, which found debt impact estimates of 4.5 and 4.3 bps, respectively.[16]

Other estimates with statistical significance include the term premium spread, which has a large positive impact (86 bps) on interest rates, while demographics and foreign-held debt have a downward impact on interest rates, at 76 and 8.5 bps, respectively. In the baseline estimate, neither the inflation spread nor expected GDP growth have a statistically significant impact on interest rates. A robustness check using heteroskedasticity-robust standard errors found that all four statistically significant variables remain statistically significant.
Next, to account for high-leverage data points, the standard OLS regression was run without high leverage points. This refinement ensures that coefficients are not biased by extreme points in the data. Table 3 presents the estimated impacts of variables after removing high leverage points. All four statistically significant variables have larger impacts on interest rates when these extreme points are removed from the data. The impact of each percentage point increase in the public debt ratio is now almost 5.5 bps.

To measure the potential delayed impact of variables on interest rates, we applied quarterly lags, up to four quarters (12 months). The results in table 4 reveal that the effect of public debt on interest rates is larger at longer-term horizons, exceeding 6 bps after one year. Another explanatory variable that increases in effect over time is the share of debt held by foreign nationals, growing to about 17 bps after four quarters. Applying lags to the term premium spread had the opposite effect: The impact parameter decreased significantly over time to just 35 bps after one year, suggesting that short-term expectations matter for this impact. The impact of demographic changes on interest rates remains significant and stable, at around 80 bps, regardless of lag term.
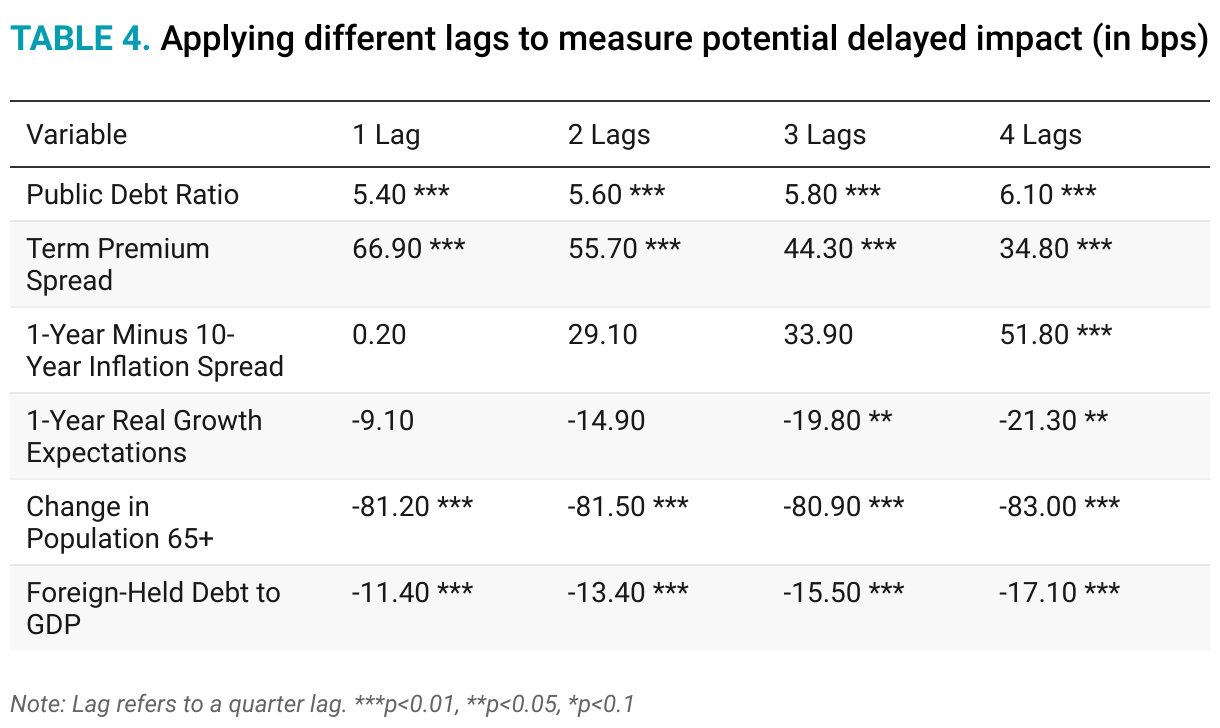
Interestingly, the inflation spread becomes significant after one year, with interest rates increasing by about 52 bps for every percentage point rise in the spread. This increase suggests that the effects of changes in inflation on interest rates may take longer to materialize. Similarly, growth expectations, while insignificant at short-term quarter lags, become significant at three to four quarter lags, at least at the 10 percent level, reducing interest rates by about 20 bps.
The increasing debt impact at higher lags suggests that higher debt levels take time to influence interest rates. A four-quarter lag (12 months) produces the largest impact (6.1 bps), suggesting there is a delayed market response to fiscal changes. Monetary policy, investor behavior, and global capital flows may contribute to the delayed transmission of debt effects into interest rates.
Another way to measure the impact of public debt on interest rates over time is by using recursive regression analysis. To estimate the baseline regression equation over a recursive sample period, the analysis plots the first 20 quarters of data and the coefficient of the public debt ratio (see figure 1). The analysis then adds one observation at a time, applying the recursive regression over the period of 2000–24. The recursive coefficient is smoothed over eight quarters. The green dashed line represents the CBO’s 2 bps debt impact parameter to demonstrate how low the CBO estimate is in relation to the actual impact of debt on interest rates. The rolling average coefficient demonstrates how the debt impact on interest rates typically fluctuates over time between about 3 and 6 bps.

While the growth in public debt has put upward pressure on long-term interest rates over time, it is important to consider these effects in the broader context of other structural factors that have placed downward pressure on interest rates. Figure 2 shows that the main cause of falling interest rates in the 1980s and 1990s was the falling term premium (3-month minus 10-year inflation). This structural factor explains more than 60 percent of the decline in interest rates through 2003, with foreign purchases of US debt playing a minor role. However, in the decade between 2003 and 2013, foreign purchases of Treasuries were responsible for about three-quarters of the 2 ppt decline in interest rates. From 2013 onwards, demographics have been the main structural factor placing downward pressure on interest rates.
While structural factors have historically placed downward pressure on interest rates, there was a turning point around 2012. Since then, the effects of a growing public debt burden, declining foreign demand for US Treasuries, and a rising term premium have outweighed the downward effects of demographics, driving interest rates higher.

What is notable is that, aside from the temporary effects of the COVID-19 pandemic, interest rates hit a low point in the early-to-mid 2010s, and since then other factors have outweighed the downward pressures of demographic trends. After declining by about 8.1 ppt from 1985 levels through 2012, interest rates at the end of 2024 were about 2.6 ppt higher than 2012 levels. Three factors explain this reversal: First, the significant increase in debt since the Great Financial Crisis has increased interest rates by about 3 ppt since 2008, all else equal. Second, foreign purchases of US debt as a share of GDP began to decline around 2014, increasing interest rates by about 1.4 ppt. Third, the term premium, which had been a major factor behind falling rates in the 1980s and 1990s, began to increase around 2012, driving interest rates higher by about 2.5 ppt. All three of these factors are likely tied to concerns about fiscal sustainability and a subsequently higher risk premium on long-term interest rates. In fact, the term premium and foreign debt holdings are inversely related with a strong negative correlation (-0.86). In other words, as foreign demand for US debt declines, the term premium rises because the Treasury must attract alternative investors by offering a higher yield.
Conclusion
This analysis, along with the bulk of the empirical literature on this topic, suggests that the CBO substantially underestimates the debt impact parameter it uses in its production function. The baseline results of my analysis suggest that every percentage point increase in the public debt ratio raises long-term interest rates by 4.6 bps. Alternative tests and lagged models find a larger debt impact within the range of 5.4 to 6.1 bps. These estimates closely align with the most recent empirical analysis and suggest that CBO parameters significantly underestimate the impact of debt on interest rates.
Additionally, the results here suggest that the CBO debt impact parameter is about 2 to 3 bps too low, which means that CBO forecasts of long-term budget projections are far too conservative. Using the CBO’s latest long-term projections, nominal 10-year Treasury yields are likely to be around 4.9 to 5.5 percent by 2055, far higher than the 3.8 percent currently projected. This understating of the debt impact parameter could have serious implications for long-term budget sustainability.
The CBO’s projections are critical for shaping federal fiscal policy, as they serve as the foundation for decisions on government spending, taxation, and debt management. Accurate projections are essential because they influence how policymakers plan for long-term economic stability and respond to fiscal challenges. The CBO should consider updating its modeling framework to better account for the evolving relationship between debt levels and interest rates.
About the Author
Jack Salmon is a research fellow at the Mercatus Center at George Mason University, where he focuses on economic and fiscal policy, with an emphasis on federal budgets, taxation, economic growth, and institutional analysis. His research and commentary have been featured in a variety of outlets, including The Hill, Business Insider, RealClearPolicy, National Review, the American Institute for Economic Research, and Reason Magazine. Salmon has provided expert analysis before Congress on the risks of debt accumulation, deficit spending, and inflation. Prior to rejoining Mercatus, he served as director of policy research at Philanthropy Roundtable, where he researched issues impacting the charitable sector and philanthropic freedom. Originally from the United Kingdom, Salmon earned his Master of Arts in political economy from King’s College London in 2015.
Notes
[1] Jason Furman and Larry Summers, “A Reconsideration of Fiscal Policy in the Era of Low Interest Rates” (Discussion Draft, Brookings Institution, November 30, 2020).
[2] This literature review is an adaption and extension of a Substack post I wrote at Liberty Lens in October 2024, entitled “Long-Term Interest Rate Projections and the Federal Debt”; see https://libertylensecon.substack.com/p/long-term-interest-rate-projecti…. See also Thomas Laubach, “New Evidence on the Interest Rate Effects of Budget Deficits and Debt” (Finance and Economics Discussion Series 2003.0, no. 12, Divisions of Research & Statistics and Monetary Affairs Federal Reserve Board, 2003), 1–20; Eric M. Engen and R. G. Hubbard, “Federal Government Debt and Interest Rates,” NBER Macroeconomics Annual 19 (2004): 83–138.
[3] William G. Gale and Peter R. Orszag, “Budget Deficits, National Saving, and Interest Rates” (Brookings Papers on Economic Activity no. 2, 2004), 101–210.
[4] Noriaki Kinoshita, “Government Debt and Long-Term Interest Rates” (IMF Working Paper no. 063, 2006), 1–25.
[5] Thomas Laubach, “New Evidence on the Interest Rate Effects of Budget Deficits and Debt,” Journal of the European Economic Association 7, no. 4 (2009): 858–85.
[6] Manmohan S. Kumar and Emanuele Baldacci, “Fiscal Deficits, Public Debt, and Sovereign Bond Yields” (IMF Working Papers no. 184, 2010), 1–28.
[7] Canlin Li and Min Wei, “Term Structure Modeling with Supply Factors and the Federal Reserve’s Large-Scale Asset Purchase Programs,” International Journal of Central Banking 9, no. 1 (2013): 3–39.
[8] Ernie Tedeschi, “Deficits are Raising Interest Rates. But Other Factors are Lowering Them,” Medium (Bonothesauro), February 19, 2019, https://medium.com/bonothesauro/deficits-are-raising-interest-rates-but….
[9] Mark J. Warshawsky and John Mantus, “An Expanded and Updated Analysis of the Federal Debt’s Effect on Interest Rates,” AEI Economic Perspectives, 2022.
[10] Li and Wei, “Term Structure Modeling.”
[11] Christopher Gust and Arsenios Skaperdas, “Government Debt, Limited Foresight, and Longer-Term Interest Rates” (Finance and Economics Discussion Series no. 2024-027, 2024), 1–14.
[12] Christopher D. Cotton, “Debt, Deficits and Interest Rates,” Economica 91, no. 363 (2024): 911–43.
[13] Edward Gamber and John Seliski, “The Effect of Government Debt on Interest Rates” (Congressional Budget Office WP 2019-01, 2019).
[14] Andre R. Neveu and Jeffrey Schafer, “Revisiting the Relationship Between Debt and Long-Term Interest Rates” (Congressional Budget Office WP 2024-05, 2024).
[15]To address frequency mismatches, annual demographic data were transformed to quarterly frequency using a step interpolation method or “forward fill.”
[16] Warshawsky and Mantus, “An Expanded and Updated Analysis”; Cotton, “Debts, Deficits, ad Interest Rates.”

