- | Corporate Welfare Corporate Welfare
- | Policy Briefs Policy Briefs
- |
Public Perceptions of Markets, Government, and Favoritism
In March of 2019, the Mercatus Center at George Mason University published “A Culture of Favoritism: Corporate Privilege and Beliefs about Markets and Government.” Using data gleaned from a public opinion survey of 500 American business leaders, the study explored those business leaders’ experience with and perceptions of government favoritism. In this short paper, I present some additional data derived from a wider sample that includes 500 additional respondents who, when surveyed, were not necessarily business leaders.
Some results from this wider sample mirror those from the business leader study. For example, as with business leaders, respondents generally support free markets in the abstract, but they are less inclined to favor marginal increases in market freedom. The population is also generally supportive of government involvement in the economy. Large majorities are opposed to government favoritism, but that opposition weakens when favoritism is described as government assistance. Only a small minority seem to support both favoritism and a free market (an incompatible set of beliefs).
Compared with business leaders who work for favored firms, the general public is less supportive of favoritism and less inclined to believe that favoritism is compatible with free enterprise. Interestingly, compared with business leaders who do not work for favored firms, the general public is more supportive of favoritism and more inclined to believe that favoritism is compatible with free enterprise.
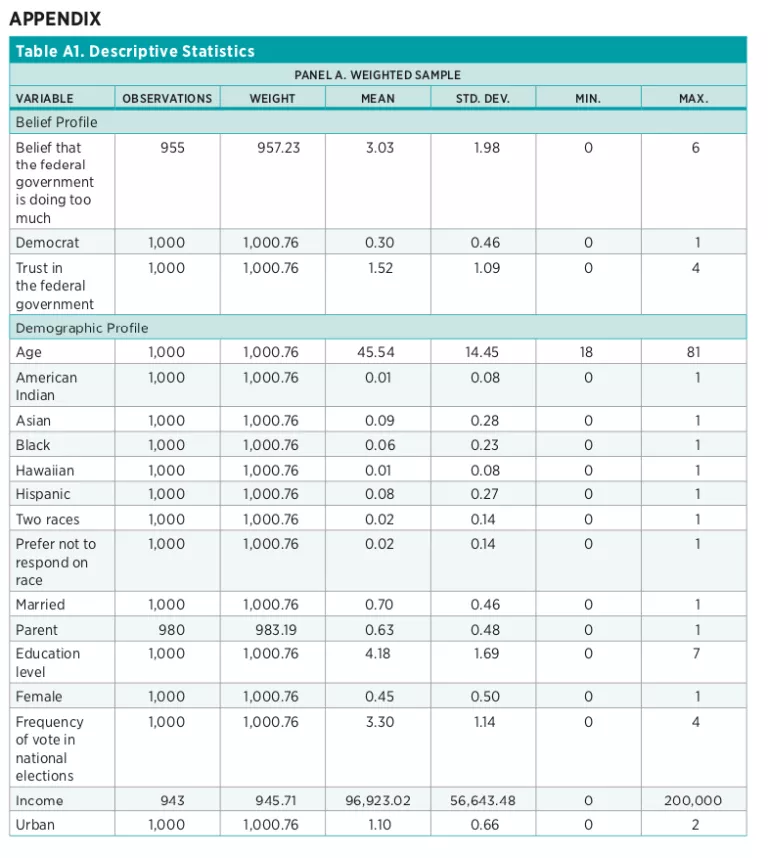
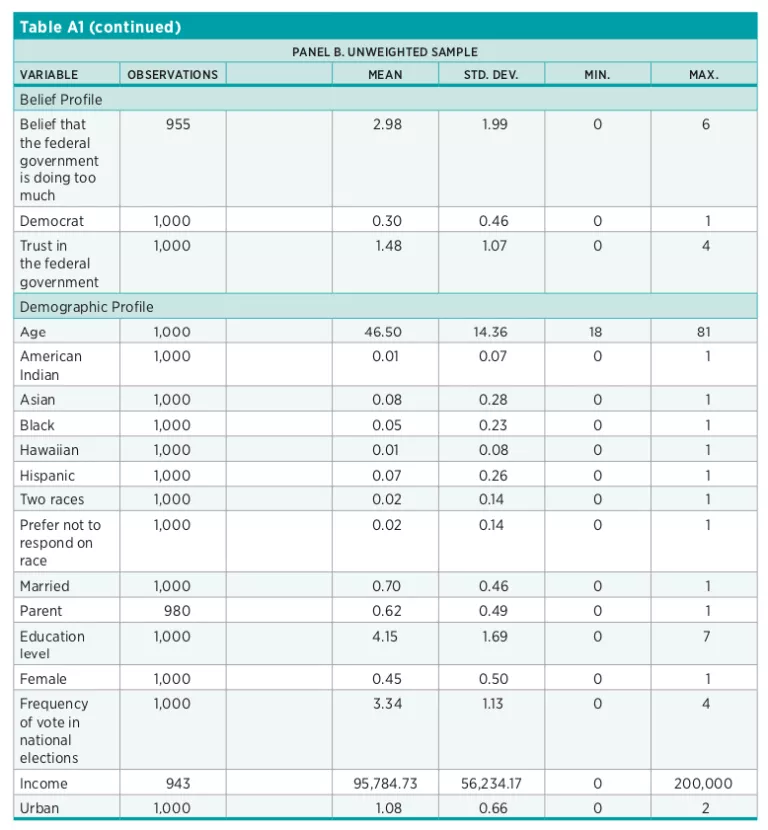
Responses are weighted based on each respondent’s representation in the general public (among business leaders, weighting was based on firm size; among the general population, weighting was based on respondent age and gender). Descriptive demographic statistics can be found in the appendix. In contrast with “A Culture of Favoritism,” I eschew regression analysis and simply present the raw descriptive data in an attempt to offer easily interpretable results.
A Brief Overview of “A Culture of Favoritism”
To qualify for the study, respondents had to be 18 years of age or older and had to currently reside in the United States. The subset of respondents who were identified as business leaders had to be employed full time, be manager level or above, know the size of their firms, know their firm’s financials, and either be decision makers or have influence over the firm’s financial decisions. The survey was conducted online, included 61 questions, and took participants 10 to 15 minutes to complete. Participants were offered a nominal incentive to participate ($27 for business leaders and $4 for the non-business-leader population). The business leader sample included respondents from each of the 20 broad industry categories identified in the North American Industry Classification System. For more details on the survey and the sample, please refer to the study itself or to summaries of it published on The Bridge and in Reason.
The survey asked business leaders whether they believe that their firms benefit from any of the following varieties of government favor: direct loans, loan guarantees, subsidies, bailouts (or the expectation thereof), regulatory barriers to competition, tax breaks or tax privileges, tariffs or quotas on foreign competitors, government-created monopoly, or some other form of assistance. Sixty-one percent of business leaders indicated that their firms benefit from at least one of these forms of privilege.
The survey then explored how experience with government favor correlates with certain attitudes about markets, government, and favoritism itself. Compared with other leaders, those who reported that their firms benefit from favor have systematically different beliefs about these matters. In general, they are more inclined to favor government intervention in markets, they are more skeptical of competition, they are more likely to think favoritism is compatible with a free market, they have different ideas about the keys to business success, and they are more inclined to support government favoritism (though a majority still oppose it).
In the next section I present raw data from the wider sample that includes 500 business leaders and 500 members of the broader public.
Respondents Generally Support a Free Market
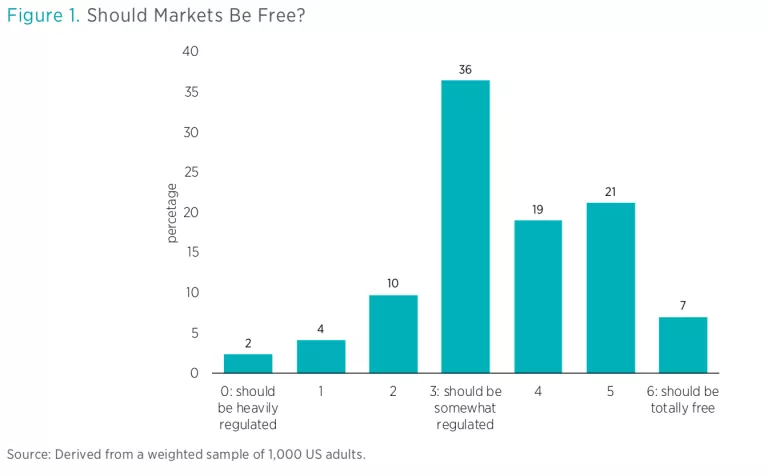
When a free market was expressed as an abstract idea, respondents were generally supportive. Consider figure 1, which shows responses to the question “Should markets be free?” Possible responses ranged from 0, indicating a belief that markets “should be heavily regulated” to 6, indicating a belief that markets “should be totally free.”
The modal (and median) response was 3, markets “should be somewhat regulated.” Note, however, that responses were skewed toward the right, indicating a general preference for freer markets. Forty-seven percent of respondents answered with a 4, 5, or 6, whereas just 16 percent answered with a 0, 1, or 2.
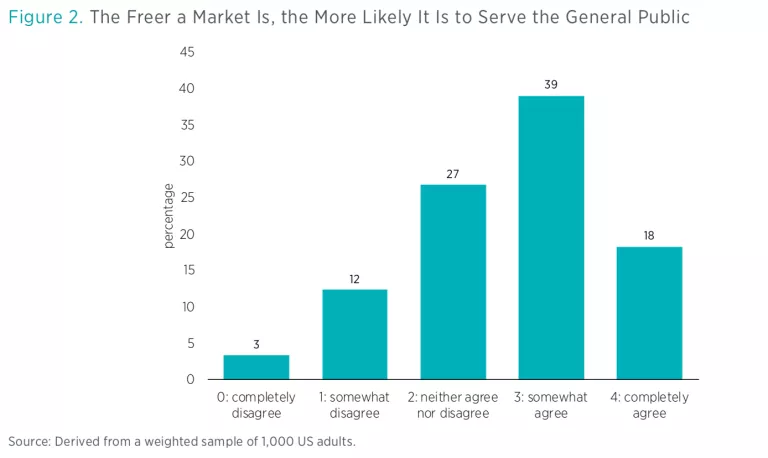
This support for freer markets is backed by a perception that markets tend to serve the general public. Figure 2 shows the range of responses to the statement “The freer a market is, the more likely it is to serve the general public.” Possible answers ranged from 0, “completely disagree,” to 4, “completely agree.” As with the previous question, answers skewed toward the right, indicating general support for the statement.
The modal response—shared by 39 percent of the sample—was 3, “somewhat agree.” And nearly 6 out of 10 either somewhat or completely agreed that the freer a market is, the more likely it is to serve the general public.
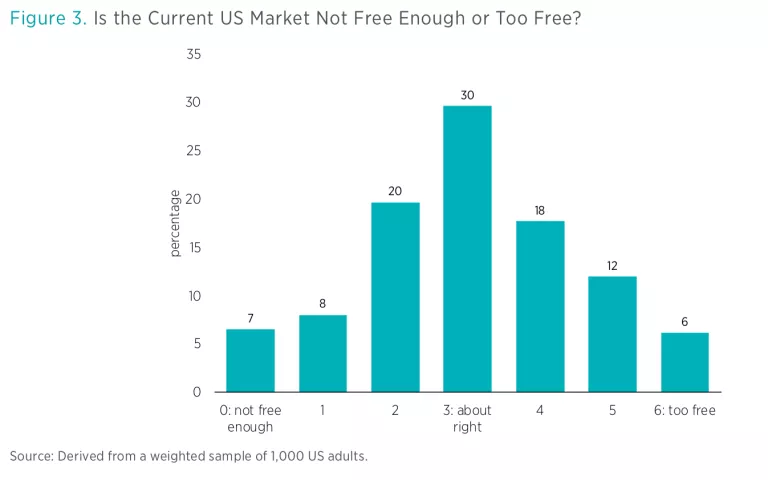
Support for the abstract notion of a free market weakened, however, once the questions became a little more specific. Consider figure 3. It shows responses to the question “Is the US market too free?” Possible answers ranged from 0, indicating that respondents thought the US market is “not free enough,” to 6, indicating a belief that US markets are “too free.”
In this case, responses were not skewed rightward but were instead clustered around the center. The mean, median, and modal response was “about right.” Nearly 7 in 10 respondents selected either this response or the ones immediately above it or below it.
This finding is not necessarily inconsistent with the results of the first question. It is possible for the same individual to believe that markets should generally be free, while also feeling that—on the margin—the United States strikes the proper balance. This finding does, however, suggest that most Americans are not interested in enhancing economic freedom, a potential problem given the theoretical and empirical case for greater economic freedom.
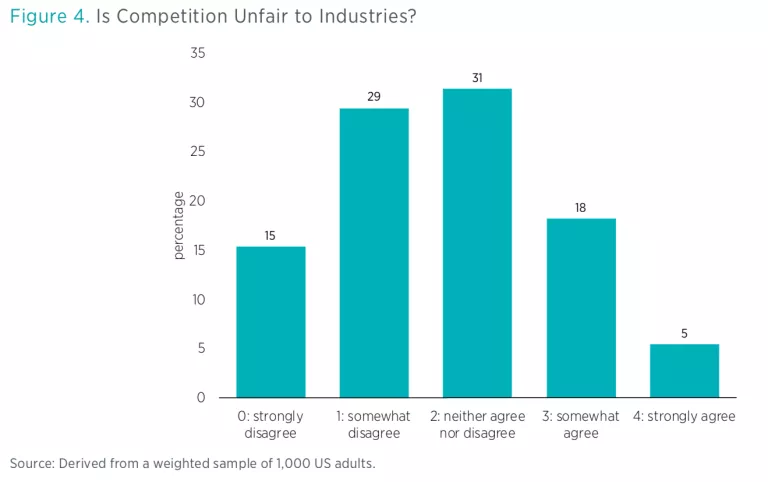
One important attribute of a healthy market economy is competition (especially when competition is interpreted as the absence of government-created monopoly). Figure 4 presents responses to the question “Is competition unfair to industries?” Possible answers ranged from 0, “strongly disagree,” to 4, “strongly agree.” The modal response was 2, “neither agree nor disagree,” and answers were skewed leftward, indicating general disagreement with the statement (i.e., a general belief that competition is fair). Just one-fourth of respondents said they either somewhat or strongly agree that competition is unfair to industries. This, therefore, is further support for generally open markets.
Many Think the Government Should Be Involved in the Economy
To better appreciate respondents’ attitudes toward the market, the survey asked a series of questions about government and its involvement in the economy. In many ways these questions probe the same central question of how free the economy should be, but they approach it by asking about government’s involvement in the economy.
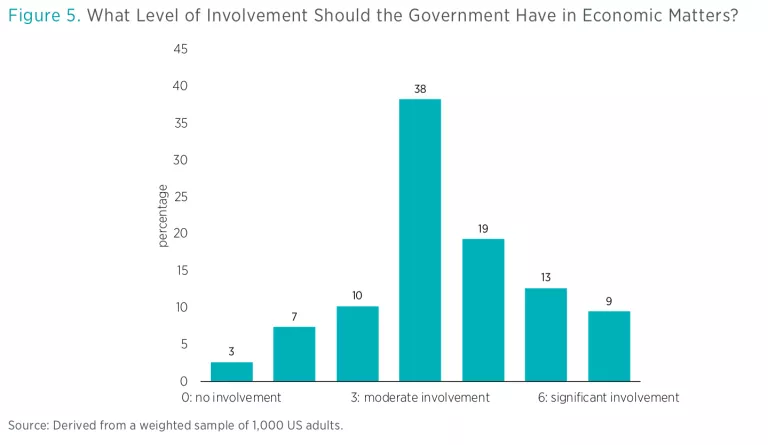
Figure 5 shows responses to the question “What level of involvement should the government have in economic matters?” Possible answers ranged from 0, “no involvement,” to 6, “significant involvement.” The modal response, selected by about 4 in 10 respondents, was 3, “moderate involvement.” Answers, however, were skewed toward favoring more involvement: 41 percent responded with a 4, 5, or 6, while only 20 percent responded with a 0, 1, or 2.
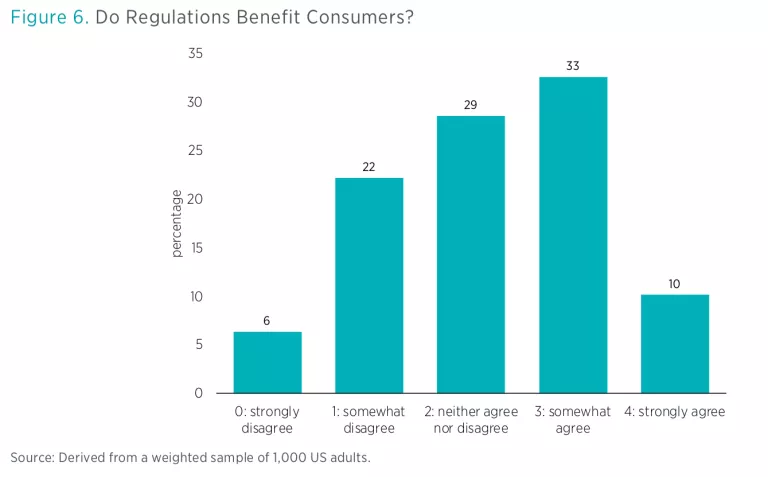
This preference for government involvement in economic matters is supported by the belief that government improves economic outcomes. Figure 6 shows responses to the question “Do regulations benefit consumers?” The modal response was 3, “somewhat agree,” and responses generally skewed toward agreement.
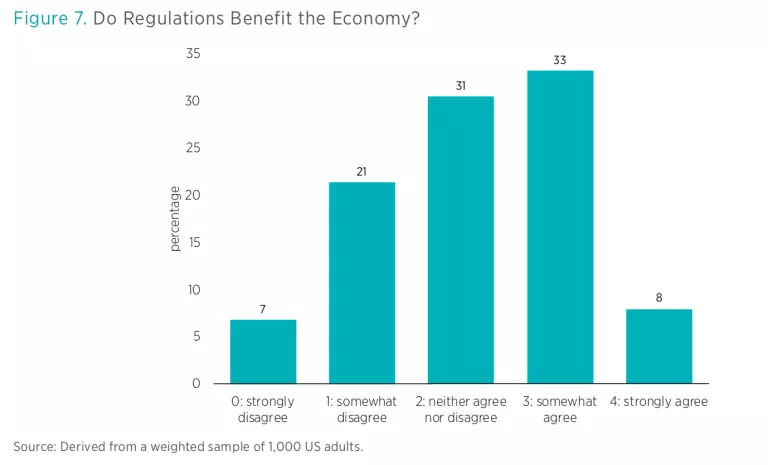
Similarly, when asked “Do regulations benefit the economy,” responses tended to skew toward agreement (see figure 7).
In an attempt to probe perceptions of regulatory capture, the survey asked respondents, “Is competition limited by government?” Figure 8 presents the results. The modal response was 2, “neither agree nor disagree,” but responses did skew toward agreement, with 40 percent either somewhat or strongly agreeing and only 20 percent somewhat or strongly disagreeing (these responses are particularly interesting in light of the fact that respondents tended to think that regulations benefit consumers).

Most Respondents Oppose Government Favoritism
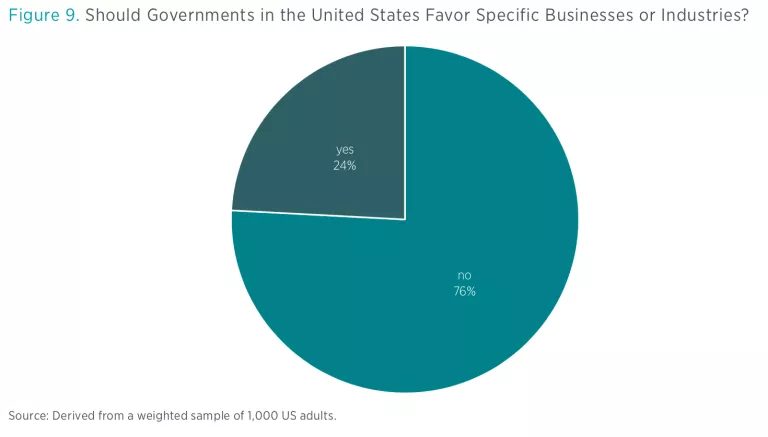
Our final set of questions probed perceptions of favoritism. The first was straightforward: “Should governments in the United States favor specific businesses or industries?” As shown in figure 9, the overwhelming majority of respondents, 76 percent, replied “no,” while only 24 percent approved of favoritism.
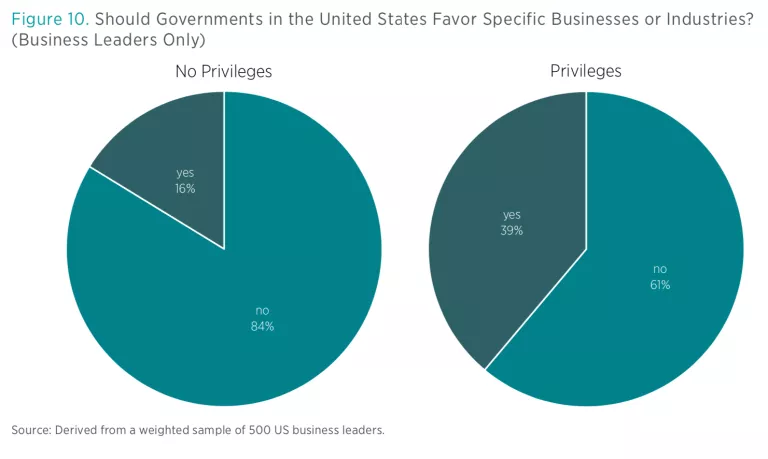
It is interesting to contrast these views of the general population with those of the population of business leaders discussed in “A Culture of Favoritism.” Figure 10 (which is identical to figure 28 in that paper) shows business leaders’ responses to this question. Here I break the results down into responses from those who believe they work for favored firms and those who do not believe they work for favored firms.
The right-hand panel shows how business leaders at favored firms think about favoritism. Perhaps unsurprisingly, this subset of business leaders is more comfortable with favoritism than is the general population. Nevertheless, a clear majority, 61 percent, still disapproves of favoritism.
The left-hand panel is in some ways more interesting. It shows how business leaders at nonfavored firms perceive favoritism. Among these business leaders, 84 percent oppose it. In other words, opposition to favoritism runs even higher among business leaders at nonfavored firms than it does in the general population. This is good news in that it means that business leaders at nonfavored firms may be strong allies in the fight against corporate welfare.
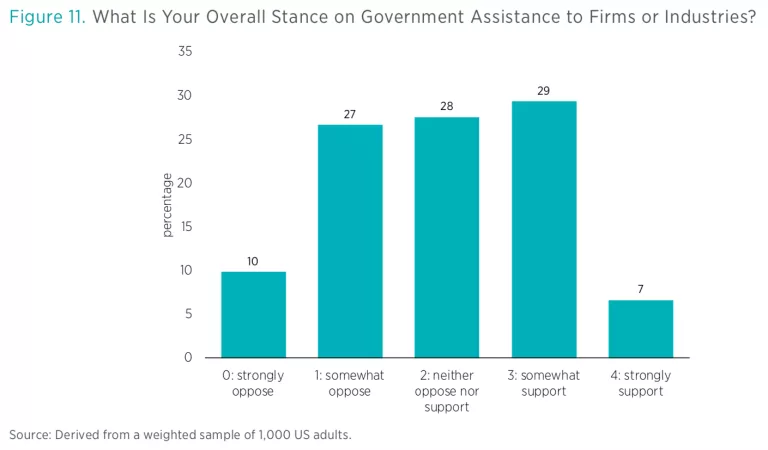
Returning again to the broader population, I thought it might be interesting to probe perceptions of favoritism with more neutral terminology. Figure 11 shows the response to the question “What is your overall stance on government assistance to firms or industries?” In substance, this is similar to the previous question. But here we used the more neutral term “assistance” rather than “favor,” and we offered respondents a number of responses, ranging from 0, “strongly oppose,” to 4, “strongly support.”
When questions are couched in these more neutral terms, the public appears to be more supportive of government assistance to firms or industries. Only 37 percent said that they either somewhat or strongly oppose government assistance to firms or industries. The three midrange options, “somewhat oppose,” “neither oppose nor support,” and “somewhat support,” each garnered about the same amount of support. And taken together, 84 percent of respondents selected one of these three options.
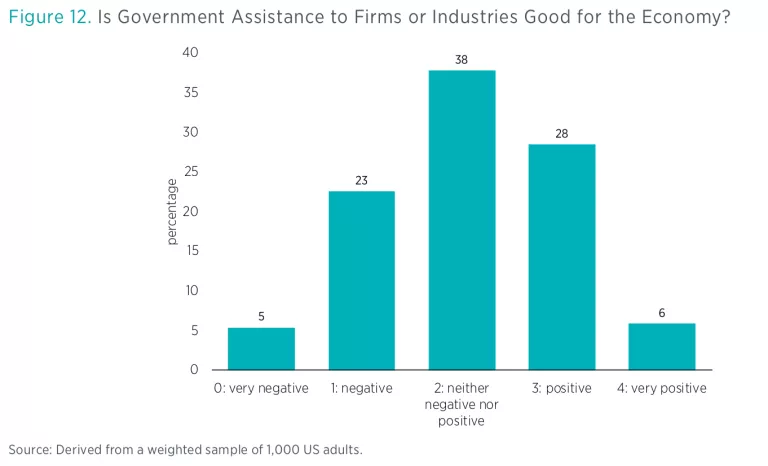
Similarly, respondents had relatively neutral views about the economic effects of government assistance. Figure 12 shows responses to the question “Is government assistance to firms or industries good for the economy?” The modal response was 2, “neither negative nor positive.” Otherwise, responses skewed in a slightly positive direction. Thirty-four percent of respondents felt that the economic effects of government favoritism were either positive or very positive, while 28 percent said the effects were either negative or very negative.
This response provides fodder for both pessimists and optimists. Given the evidence that favoritism entails economic and social pathologies, pessimists may lament that the public is not more opposed to favoritism. On the other hand, the results also suggest that the public is not strongly attached to the notion that favoritism is beneficial. So it may not be all that difficult to educate the public about the costs of favoritism.
From Adam Smith to Milton Friedman, free-market thinkers have been at pains to stress the distinction between policies that are pro-market (low taxes and moderate regulations that permit consumers and producers a wide degree of economic freedom) and policies that are pro-business (targeted privileges that benefit particular businesses such as tax breaks, regulatory benefits, or subsidies). The pro-market view is that economic freedom tends to serve the general public, a proposition that is strongly supported by the data. Pro-business policies may serve particular firms (at least in the short run), but they can harm the general public over the long run.
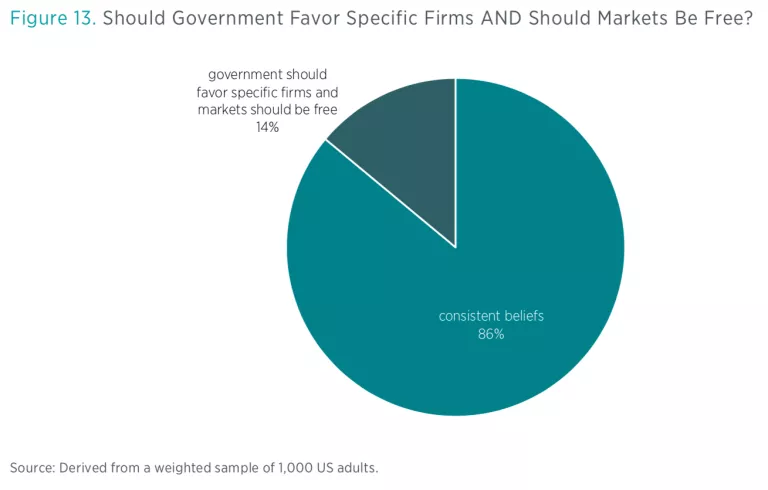
From the pro-market perspective, favoritism is not consistent with a free market. But we wanted to see how many people thought it might be, so we looked in our data for respondents who said government should favor particular business or industries but also expressed support for free markets. Figure 13 presents the results.
The good news is that most people hold consistent beliefs. Only 14 percent of respondents thought government should favor particular firms or industries and also thought that markets should generally be free.
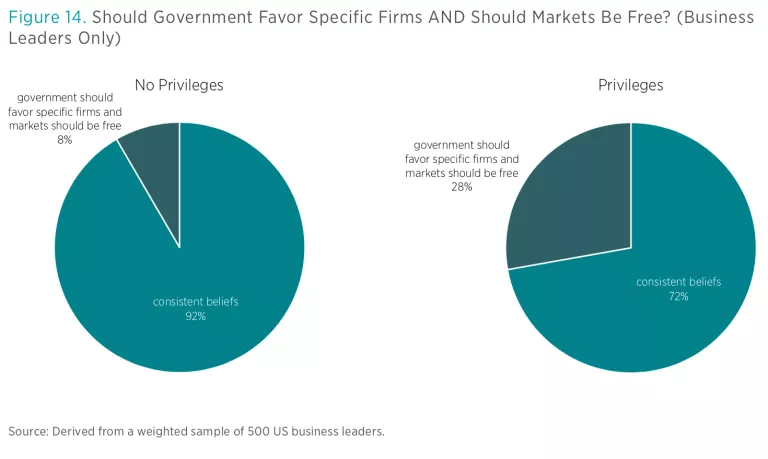
It is interesting to compare the general public’s views here with those of the business leaders discussed in the study. Figure 14 shows business leader beliefs, broken down by whether or not the leader believes he or she works at a favored firm. Among business leaders whose firms benefit from government privilege, 28 percent support favoritism and also support a free market. Among those whose firms do not benefit from privilege, just 8 percent support favoritism and also support a free market.
Thus, compared with the general public, a business leader at a favored firm is twice as likely to believe that favoritism is compatible with a free market (28 percent rather than 14 percent). Yet a business leader at a nonfavored firm is about half as likely to hold these incompatible beliefs (8 percent rather than 14 percent).
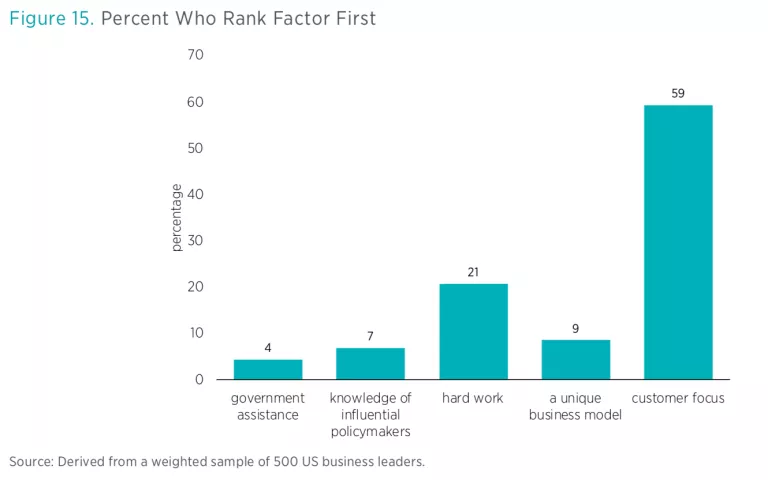
Finally, we asked business leaders what they thought were the most important factors in business success. They were given five possible answers: customer focus, a unique business model, knowledge of influential policymakers, government assistance, and hard work. Note that two of the five factors—customer focus and a unique business model—are socially beneficial; they are profit strategies that grow the size of the entire economic pie through positive-sum behavior. Two other factors—knowledge of influential policymakers and government assistance—are socially destructive; they are rent-seeking strategies, which allow some to profit only at the expense of others. And the final factor—hard work—is ambiguous; one could work hard in ways that are either socially beneficially or socially destructive.
This question was only asked of the business leader cohort.
Figure 15 shows the share of business leaders who selected each factor as the most important. Fifty-nine percent of respondents selected customer focus as the most important factor in business success. The other socially beneficial strategy, a unique business model, was selected by 9 percent of leaders as the most important factor. Just 11 percent of respondents selected the two socially destructive strategies, while 21 percent selected hard work as the most important factor.
Conclusion
Overall, the survey paints the picture of a public that is generally supportive of a free market in the abstract but less inclined to favor increases in market freedom in the United States today. The population is also generally supportive of government involvement in the economy. Large majorities are opposed to government favoritism, but that opposition weakens when favoritism is described as government assistance. Only a small minority seems to support both favoritism and a free market (an incompatible set of beliefs). Compared with the general population, business leaders who work for favored firms are more inclined to support favoritism. They are also more inclined to think that favoritism is compatible with free enterprise. Interestingly, business leaders who work for nonfavored firms are less supportive of favoritism than is the general population, and they are less inclined to hold this contradictory set of beliefs. This suggests that these leaders may be important allies in the fight against favoritism.