- | Government Spending Government Spending
- | Policy Briefs Policy Briefs
- |
Simplifying the Tax Code Is a Pro-Growth Policy
Tax reform that broadens the base and removes distortions could significantly increase investment and GDP
Introduction
The structure of a tax system plays a central role in shaping economic incentives, capital allocation, and long-run growth. In the United States, however, the federal tax code has evolved into a highly complex and opaque system that imposes substantial economic costs well beyond statutory tax liabilities. Compliance with federal tax filing and reporting requirements alone consumed more than 7.9 billion hours in 2024. Reasonable estimates suggest that this time burden translates into roughly $413 billion in lost economic productivity, while the Internal Revenue Service (IRS) estimates that households and firms incur approximately $133 billion annually in out-of-pocket compliance expenses.[1] Taken together, the total cost of tax compliance approaches $546 billion per year, or nearly 2 percent of US gross domestic product.
These compliance costs are not merely an administrative inconvenience; they reflect deeper structural inefficiencies embedded in the tax code. Over time, the tax base has been increasingly narrowed through the proliferation of tax expenditures—government spending in the form of deductions, credits, exclusions, and exemptions. Since 2000, the number of such provisions has expanded from roughly 130 to approximately 175, while the value of potential revenue forgone has nearly doubled in the past decade alone.[2] Tax expenditures function as implicit subsidies that favor particular activities, industries, or demographic groups, thereby distorting relative prices, misallocating capital, and encouraging resources to flow toward less productive uses. The result is a tax system that simultaneously discourages saving and investment, complicates economic decision-making, and undermines productivity growth.
This paper argues that tax simplification should be understood not merely as an administrative reform, but as a pro-growth policy with significant macroeconomic implications. A compelling alternative to the current income-based system is the consumption-based tax framework proposed by American economists Robert E. Hall and Alvin Rabushka in 1978. Their proposal replaces a narrow, distortion-laden tax base with a simpler structure that treats saving and investment neutrally—unlike the current income tax system, which often taxes income when it is earned and again when the returns to saving and investment are realized, while also requiring delayed cost recovery through depreciation rules that raise the effective tax burden on capital.[3]
By reducing compliance costs, eliminating many tax-induced distortions, and improving incentives for work, entrepreneurship, and capital formation, a simplified tax code can meaningfully raise economic efficiency and long-run output. As Hall and Rabushka emphasize, “Improved incentives for work, entrepreneurial activity, and capital formation will substantially raise national output and the standard of living.”[4] This paper evaluates the case for tax simplification through this lens, emphasizing the growth potential of a broader, more neutral tax base.
Broadening the Base and Economic Growth
A small body of simulation-based economic research finds that tax reforms that broaden the base and reduce distortions—particularly those that eliminate deductions, exemptions, and credits—can generate meaningful gains in output and long-run economic growth. This literature emphasizes that the growth effects of tax reform operate less through changes in statutory rates and more through improved incentives for work, saving, investment, and the reallocation of capital toward higher-productivity uses.
Early simulation-based studies of base-broadening reforms within the United States consistently predict sizable long-run gains. For instance, Diane Lim Rogers examines a revenue-neutral shift to a flat-rate income tax that eliminates all deductions, exclusions, and credits except for a personal exemption of $10,000 per filer and $5,000 per dependent.[5] Depending on assumptions about key behavioral elasticities, Rogers estimates that such a reform would increase the long-run size of the US economy by between 1.8 and 3.8 percent. These gains arise primarily from reduced marginal tax distortions and improved incentives for labor supply and capital accumulation.
David Altig and his coauthors reach similar conclusions using a dynamic general equilibrium model to analyze a revenue-neutral transition to a flat income tax with no personal deductions or exemptions.[6] They find that economic output would rise immediately by approximately 4.5 percent, followed by an additional 1 percent increase over the subsequent 15 years. The front-loaded nature of the response reflects both transitional dynamics and the rapid reallocation of resources once tax-induced distortions are removed.
John W. Diamond and George R. Zodrow further highlight the importance of base broadening for capital allocation and productivity.[7] In their analysis, a comprehensive tax reform that broadens the base increases GDP by 1 to 1.3 percent in the year of implementation and by 4.9 percent in the long run. These effects are driven by higher labor supply and a substantial increase in aggregate investment, as capital shifts toward more productive sectors. In the long run, the capital stock is estimated to be 15–17 percent larger than under the prereform tax system.
Complementing these simulation-based studies, a growing empirical literature examines real-world flat tax reforms in post-Soviet and transition economies. Bibek Adhikari and James Alm analyze eight Eastern and Central European countries that adopted flat tax systems between 1994 and 2005, using a synthetic control methodology to construct counterfactual growth paths.[8] They find positive postreform effects on GDP per capita in all eight cases, with seven statistically significant at conventional levels. Five years after reform, average GDP per capita in treated countries is approximately 18 percent higher than in their counterfactual counterparts.
Similarly, Brian Wheaton studies flat tax adoption across 20 post-Communist countries and finds that such reforms increase annual per capita GDP growth by 1.38 percentage points for a transitionary period of roughly one decade.[9] These results are robust to a range of alternative specifications addressing electoral endogeneity and contemporaneous reforms. Consistent with theoretical literature, Wheaton finds that the primary growth channel operates through increased investment, with labor supply playing a secondary but meaningful role.
Complexity and Compliance Costs
Tax code complexity imposes substantial economic costs by increasing compliance burdens, undermining perceptions of fairness, and discouraging productive economic activity. Beyond the direct resource costs associated with filing and reporting requirements, complexity alters taxpayer behavior, weakens compliance norms, and distorts entrepreneurial decision-making. A growing empirical literature documents these costs and highlights tax simplification as a potentially high-return reform.
Survey evidence suggests that complexity itself meaningfully erodes the perceived legitimacy of the tax system. Youssef Benzarti and Luisa Wallossek report that a majority of surveyed US taxpayers believe the complexity of the tax code makes the tax system less fair overall.[10] Importantly, survey respondents also associate greater complexity with increased tax evasion, reinforcing the perception that similarly situated taxpayers are treated unequally. These findings indicate that complexity generates fairness concerns independent of statutory tax rates, potentially weakening voluntary compliance and social norms around taxpaying.
Earlier studies attempting to quantify the economic magnitude of compliance costs found already sizable burdens, even before more recent expansions of the tax code. Joel B. Slemrod and Varsha Venkatesh estimate that compliance costs for the US small business sector alone amounted to $23–24 billion in 1999 (2005 dollars).[11] At the same time, the IRS estimated corporate underreporting of roughly $30 billion in 2001, about 17 percent of corporate tax receipts, while the total tax gap (the difference between taxes owed and taxes paid) across all taxpayers was approximately $283 billion. The most recent IRS analysis estimates the tax gap for 2022 to be $696 billion, or roughly 2.7 percent of GDP.[12] These figures suggest that complexity not only raises compliance costs but may also contribute to underreporting and enforcement challenges.
Consistent with these findings, the US tax code has become substantially more complex over time and along multiple dimensions. Benzarti and Wallossek document that the number of words in the Internal Revenue Code increased from approximately 3.1 million to 4.3 million over the past three decades, an expansion of roughly 40 percent (see figure 1 below). This growth reflects not merely verbosity, but the accumulation of new provisions, exceptions, and contingencies that taxpayers and administrators must navigate.
FIGURE 1. Number of words in the Internal Revenue Code
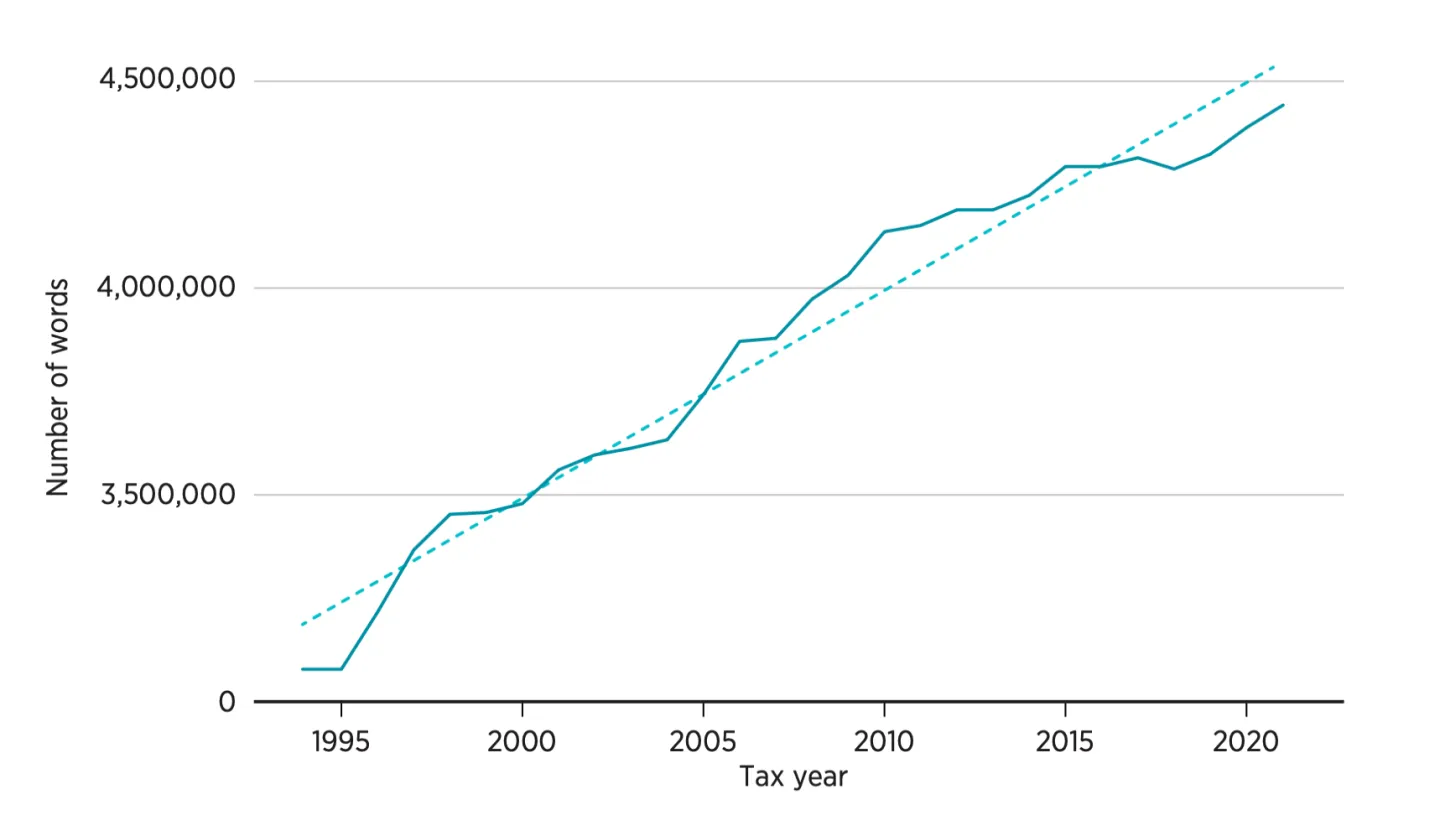
Note: The solid line shows the actual number of words, whereas the dashed line shows the linear prediction.
Source: Youssef Benzarti and Luisa Wallossek, “Rising Income Tax Complexity,” National Tax Journal 77, no. 1 (2024): 164, figure 8.
The increase in complexity is also evident in the structural expansion of the tax code. J. Scott Moody and his coauthors show that the number of income tax sections rose from 103 in 1954 to 736 in 2005.[13] Rosemary Marcuss and her coauthors further document that the number of subdivisions and cross-references within the Internal Revenue Code increased from fewer than 50,000 to nearly 70,000 between 1991 and 2012.[14] Together, these trends suggest that increases in word count correspond to increases in substantive content, internal cross-linkages, and interpretive difficulty.
A growing empirical literature links these measures of tax complexity directly to reduced economic dynamism, particularly entrepreneurship. Hans U. Bacher and Marius Brülhart examine Swiss cantonal and municipal tax systems, using the number of tax brackets and the number of words in tax codes as proxies for complexity.[15] They find that more complex tax codes, measured by longer statutory text, are associated with lower rates of firm entry. Similarly, Rick Weber finds that a one-standard-deviation increase in tax code length (approximately 175,000 words) is associated with up to a 5 percent decline from the mean in business entry and exit rates, concluding that tax code complexity has a statistically and economically significant negative effect on economic dynamism.[16]
More recent work emphasizes the role of administrative burden throughout the entrepreneurial life cycle. Pontus Braunerhjelm and his coauthors find that a 10 percent reduction in tax administrative burden increases the propensity for new business formation by approximately 4 percent, without requiring any reduction in tax revenues.[17] These results underscore that complexity operates as a fixed cost disproportionately affecting small firms and new entrants, thereby suppressing entrepreneurship and limiting competitive pressures in the economy.
Taken together, this literature suggests that tax code complexity imposes costs that extend well beyond compliance time and administrative expenses. By weakening perceptions of fairness, increasing evasion incentives, and discouraging entrepreneurship, complexity reduces economic efficiency and long-run growth. These findings reinforce the case for tax simplification as a pro-growth reform, complementing the base-broadening and incentive effects emphasized in the broader tax reform literature.
Elasticity of Investment with Respect to the User Cost of Capital
Broadening the tax base can be pro-growth, but only insofar as it reduces the user cost of capital for marginal investment. The magnitude of the resulting growth effects depends critically on the elasticity of investment with respect to the user cost of capital, a parameter that explains much of the variation in predicted outcomes across tax reform studies. Differences in assumptions about this elasticity account for why, following tax reform, some models generate modest investment responses while others predict large and persistent increases in capital formation.
A central challenge in estimating this elasticity is the presence of adjustment costs and the distinction between short-run and long-run responses of capital to changes in its cost. Ricardo J. Caballero emphasizes that most stock variables, including the capital stock, exhibit both a dynamic short-run response and a target long-run response following exogenous shocks.[18] Conventional cointegration and ordinary-least-squares approaches tend to underestimate the long-run elasticity when adjustment costs are important, particularly in small samples. Correcting for these biases, Caballero finds that the elasticity of the US capital-output ratio with respect to the user cost of capital is large and close to −1, consistent with the Cobb–Douglas benchmark.
Subsequent studies reinforce this conclusion while highlighting the importance of identification. R. G. Hubbard and his coauthors estimate user cost elasticities ranging from −1 to −2.2, depending on specification and firm characteristics.[19] Jason G. Cummins and his coauthors similarly estimate an elasticity near −1, using a novel measure of neoclassical investment fundamentals constructed from securities analysts’ earnings forecasts.[20] They find that once fundamentals are properly measured, investment responds strongly to changes in the user cost of capital and is largely insensitive to cash flow, even for firms often characterized as financially constrained. This result suggests that earlier findings of cash-flow sensitivity may reflect mismeasurement of fundamentals rather than binding financing constraints.
Huntley Schaller further demonstrates that user cost elasticity estimates are sensitive to both aggregation and identification.[21] In large economies like that of the United States, where capital supply is upward sloping and demand shocks are important over the business cycle, high-frequency variation can bias elasticity estimates toward zero. Applying cointegration techniques to a small open economy, Schaller finds a long-run user cost elasticity roughly 75 percent larger in absolute value than prior estimates, with a range of −0.9 to −1.6. This finding reinforces the view that properly identified long-run elasticities are substantially larger than those obtained from short-run regressions.
Evidence from small open economies provides additional support for elasticities near the Cobb–Douglas benchmark. Using a quarterly panel of South African manufacturing industries from 1970 to 2000, Brahima Coulibaly and Jonathan N. Millar estimate the long-run elasticity of business capital demand with respect to the user cost.[22] Across a wide range of specifications, they find elasticities close to −1. Exploiting the economic embargo period from 1985 to 1994, when South Africa temporarily became more closed, the authors show that estimated elasticities fall substantially when capital supply shocks become endogenous. These results underscore the importance of identification and suggest that estimates near −1 reflect the true structural elasticity.
Firm-level evidence yields similar conclusions. Nadja Dwenger, using German panel data, shows that distributed lag models commonly used in earlier literature produce artificially low elasticity estimates by failing to account for cointegration among capital, user costs, and sales.[23] Estimating an error-correction model that incorporates these long-run relationships yields a much larger elasticity, again close to −1. Sample attrition and firm exit are found to play only a minor role, reinforcing the robustness of the result.
These findings have direct implications for tax policy. Kevin A. Hassett and R. Glenn Hubbard note that under a simplified tax system that does not tax capital income, “taxes do not distort business investment decisions; investment decisions are based solely on nontax fundamentals.”[24] Because the current US tax system raises the user cost of capital through corporate taxation, depreciation rules, and capital income taxes, moving toward a consumption-based system would lower user cost and increase investment. While acknowledging uncertainty about the precise magnitude, the authors conclude that the consensus of the investment literature implies that the partial equilibrium response of investment could be quite large.
Recent evidence exploiting major US tax reforms supports this conclusion. Jonathan Hartley, Kevin Hassett, and Joshua Rauh use the Tax Cuts and Jobs Act of 2017 (TCJA) as a natural experiment to estimate the effect of changes in the user cost of capital on investment.[25] Following the approach of Alan J. Auerbach and Hassett,[26] they exploit cross-sectional variation in marginal effective tax rate reductions across Bureau of Economic Analysis asset types. They find that asset classes experiencing larger reductions in the user cost of capital exhibited significantly higher investment rates in the years following the TCJA. Averaging across specifications and years, a 1-percentage-point decrease in the user cost is associated with a statistically significant 1.86-percentage-point increase in the investment rate, implying an investment elasticity of −2.11. This response is roughly three times larger than the elasticity of −0.7 assumed in Congressional Budget Office models.[27]
Growth Effects of Eliminating Taxation on Saving and Investment
The growth effects of tax simplification depend critically on how strongly investment responds to changes in the user cost of capital. As shown in the preceding section, a wide range of empirical evidence—spanning aggregate time-series studies, firm-level panel data, natural experiments, and cross-country analyses—suggests that the long-run elasticity of investment with respect to the user cost of capital is economically large. Once adjustment costs, cointegration, and identification issues are properly addressed, estimates tend to cluster between −1 and −2.
This section uses that consensus range to provide a transparent, back-of-the-envelope assessment of the potential macroeconomic effects of transitioning the US tax system toward a simplified consumption-based framework, such as the Hall–Rabushka flat tax, that exempts saving and investment from taxation.
In the standard neoclassical investment model, firms choose the capital stock such that the marginal product of capital equals its rental price, or user cost. Tax policy affects this condition by driving a wedge between the required pretax return and the after-tax return received by investors. Corporate income taxes, depreciation rules, and taxes on the normal return to capital all raise the user cost of capital, thereby discouraging marginal investment.
A Hall–Rabushka-style tax system eliminates this wedge by taxing labor income and business cash flow while allowing immediate expensing of investment and exempting the normal return to capital. In the limit, full expensing reduces the marginal effective tax rate (METR) on new investment to zero, rendering the tax system neutral with respect to saving and investment decisions.
A convenient approximation links the user cost of capital, ρ, to the METR:
| ρ ≈ |
|
where r denotes the real required return. Under this formulation, ρ reducing the METR from its current level to zero lowers the user cost of capital by approximately the initial METR expressed as a percentage.
Recent estimates place current-law METRs on US corporate investment at roughly 10 percent for equipment and over 20 percent for nonresidential structures, with a weighted average near the middle of this range. Accordingly, a reasonable calibration is that moving to a consumption-based tax would reduce the user cost of capital by approximately 10 to 20 percent for a substantial share of the business capital stock.[28]
Importantly, recent US tax policy has already moved, albeit partially, in the direction of a consumption-based system. The TCJA significantly reduced the user cost of capital by lowering the corporate statutory tax rate and, crucially, by allowing full and immediate expensing of qualified equipment investment through 100 percent bonus depreciation. This provision effectively eliminated the tax on the normal return to eligible capital during the expensing window, bringing the tax treatment of investment closer to what it would be under a Hall–Rabushka-style system.
Subsequent legislation, including the One Big Beautiful Bill Act of 2025, extended or reinstated accelerated depreciation and expensing provisions for certain classes of capital, reinforcing this shift toward consumption-based taxation. Unlike a true consumption tax, however, these reforms were uneven across asset types and embedded within an otherwise income-based system. As a result, they reduced, but did not fully eliminate, the tax-induced wedge between pretax and after-tax returns on investment.
Nonetheless, these policy episodes are highly informative. By generating cross-asset and intertemporal variation in marginal effective tax rates, they provide quasi-experimental evidence on how investment responds to changes in the user cost of capital. The strong investment responses documented following the TCJA therefore offer empirical support for the magnitude of the elasticities used in this section and underscore the potential gains from a permanent and comprehensive shift to a tax system that fully exempts saving and investment.
Investment response
Let εI denote the long-run elasticity of investment with respect to the user cost of capital. A proportional change in the user cost then implies:
| ≈ εI · |
|
Using elasticity values in the −1 to −2 range implied by the literature, a permanent reduction in the user cost of capital yields sizable increases in investment:
- A 10 percent reduction implies a 10 to 20 percent increase in long-run investment.
- A 15 percent reduction implies a 15 to 30 percent increase.
- A 20 percent reduction implies a 20 to 40 percent increase.
These responses should be interpreted as long-run effects following the completion of capital stock adjustment, abstracting from transitional frictions and short-run timing effects emphasized in the adjustment cost literature.
Capital stock effects
In steady state, gross investment offsets depreciation and trend growth in the capital stock. As a result, a sustained increase in investment translates into a roughly proportional increase in the long-run level of the capital stock, though this adjustment occurs gradually over time.
Under this approximation, the investment responses above imply long-run increases in the nonresidential capital stock on the order of 15 to 40 percent, depending on the assumed reduction in the user cost and the elasticity employed. These magnitudes are consistent with empirical findings in Diamond and Zodrow and with recent evidence exploiting tax-induced variation in user costs following the TCJA.
Output effects
To translate higher capital accumulation into output gains, consider a standard Cobb–Douglas production function:
Y = AKα L(1 − α)
where α denotes capital’s share of income. Holding technology and labor constant, a proportional change in the capital stock implies:
|
Using a conventional value of α ≈ 1/3, a 15 to 40 percent increase in the capital stock implies a long-run increase in GDP of approximately 5 to 13 percent. Using a value based on the central estimated range of 25 to 30 percent implies a long-run increase in GDP of approximately 8 to 10 percent. Even under conservative assumptions, such as elasticities near −1 and user-cost reductions at the low end of the plausible range, the implied output gains remain economically meaningful and large relative to historical differences in growth performance among advanced economies.
These are level effects rather than permanent increases in trend growth. During the transition to the new steady state, however, average measured GDP growth would be temporarily higher. For example, realizing an 8 percent increase in the output level over 10 to 20 years corresponds to an additional 0.4 to 0.8 percentage points of annual growth during the transition period.
Caveats and interpretation
Several caveats are warranted. First, estimates based on policy changes such as accelerated depreciation may partially capture timing effects, although the long-run elasticities emphasized here are drawn from studies explicitly addressing adjustment dynamics. Second, partial-equilibrium investment responses need not translate one-for-one into aggregate outcomes once general-equilibrium adjustments in wages, interest rates, and international capital flows are taken into account. Third, these calculations abstract from household-saving behavior changes, which could further amplify or attenuate the capital-deepening effects of a consumption-based tax.
Nonetheless, the central conclusion is robust: Given empirically plausible long-run elasticities of investment with respect to the user cost of capital, eliminating the tax penalty on saving and investment has the potential to generate large and economically meaningful increases in capital formation and output. Tax simplification that neutralizes investment incentives should therefore be viewed not merely as an administrative reform, but as a powerful pro-growth policy lever.
Conclusion
This paper has explored how tax simplification can be understood as a pro-growth reform with meaningful macroeconomic consequences. The existing US tax system imposes large compliance costs, embeds extensive distortions through a proliferation of tax expenditures, and raises the user cost of capital by taxing saving and investment. Together, these features reduce economic efficiency, discourage entrepreneurship, and slow long-run capital accumulation.
Drawing on a broad literature spanning simulation models, firm-level studies, natural experiments, and cross-country evidence, the paper highlights a central empirical regularity: Once adjustment costs and identification challenges are properly addressed, the long-run elasticity of investment with respect to the user cost of capital is economically large, clustering between −1 and −2. This finding has direct implications for tax design. Policies that meaningfully reduce the tax-induced wedge between pretax and after-tax returns, particularly those that exempt the normal return to capital, can generate substantial increases in investment and capital formation.
Using conservative assumptions about marginal effective tax rates and a range of investment elasticities from empirical literature, the paper provides a transparent calibration of the potential growth effects of moving toward a simplified consumption-based tax system, such as the Hall–Rabushka flat tax. Even under cautious parameter choices, eliminating the tax penalty on saving and investment implies long-run increases in the capital stock on the order of 20 to 25 percent, with corresponding increases in GDP of roughly 8 percent. These gains are level effects rather than permanent increases in trend growth, but they would nevertheless translate into meaningfully higher measured growth rates during the transition to the new steady state.
Importantly, recent US tax policy provides partial empirical validation of these mechanisms. The TCJA, along with subsequent legislation extending accelerated depreciation and expensing provisions, moved the tax system incrementally toward consumption-based treatment of investment. The strong investment responses observed following the TCJA are consistent with the elasticities emphasized in this paper and underscore the economic gains from such tax reforms.
In this sense, the case for a simplified tax code extends beyond fairness, transparency, or ease of administration. A tax system that minimizes distortions, lowers compliance costs, and allows investment decisions to be guided by economic fundamentals rather than tax considerations is not only simpler, but also fundamentally more conducive to growth.
About the Author
Jack Salmon is a Gibbs Scholar and research fellow at the Mercatus Center at George Mason University, where he focuses on economic and fiscal policy, with an emphasis on federal budgets, taxation, economic growth, and institutional analysis. His research and commentary have been featured in a variety of outlets, including The Hill, Business Insider, RealClearPolicy, National Review, the American Institute for Economic Research, and Reason Magazine. Salmon has provided expert analysis on fiscal and economic issues in various policy forums, including testimony before Congress on the risks of debt accumulation, deficit spending, and inflation.
Notes
[1] Scott A. Hodge, “Tax Complexity Now Costs the US Economy over $546 Billion Annually,” Tax Foundation, August 2024.
[2] Jack Salmon, “Tax Expenditures: A Buchanan–Wagner Critique,” The Unseen and The Unsaid, February 2026.
[3] Veronique de Rugy and Jack Salmon, “Introduction: A Principled Approach to Tax Expenditures” (Mercatus Policy Brief, Mercatus Center at George Mason University, April 2025).
[4] Robert E. Hall and Alvin Rabushka, The Flat Tax (Hoover Institution Press vol. 423, April 2007).
[5] Diane Lim Rogers, Assessing the Effects of Fundamental Tax Reform with the Fullerton–Rogers General Equilibrium Model (Congressional Budget Office, 1997).
[6] David Altig, Alan J. Auerbach, Laurence J. Kotlikoff, Kent A. Smetters, and Jan Walliser, “Simulating Fundamental Tax Reform in the United States,” American Economic Review 91, no. 3 (2001): 574–95.
[7] John W. Diamond and George R. Zodrow, “Consumption Tax Reform: Changes in Business Equity and Housing Prices,” Fundamental Tax Reform (2008): 227–60.
[8] Bibek Adhikari and James Alm, “Evaluating the Economic Effects of Flat Tax Reforms Using Synthetic Control Methods,” Southern Economic Journal 83, no. 2 (2016): 437–63.
[9] Brian Wheaton, “The Macroeconomic Effects of Tax Progressivity: Evidence from the Eastern European Flat-Tax Reforms,” working paper (UCLA, Anderson School of Management, 2022).
[10] Youssef Benzarti and Luisa Wallossek, “Rising Income Tax Complexity,” National Tax Journal 77, no. 1 (2024): 143–73.
[11] Joel B. Slemrod and Varsha Venkatesh, “The Income Tax Compliance Cost of Large and Mid-Size Businesses,” Working Paper 2004-4 (Ross School of Business, Office of Tax Policy Research, 2002).
[12] IRS, “IRS: The Tax Gap,” last updated January 27, 2026, https://www.irs.gov/statistics/irs-the-tax-gap.
[13] J. Scott Moody, Wendy P. Warcholik, and Scott A. Hodge, The Rising Cost of Complying with the Federal Income Tax (Tax Foundation Special Report no. 138, December 2005).
[14] Rosemary Marcuss, George Contos, John Guyton, et al., “Income Taxes and Compliance Costs: How Are They Related?,” National Tax Journal 66, no. 4 (2013): 833–53.
[15] Hans U. Bacher and Marius Brülhart, “Progressive Taxes and Firm Births,” International Tax and Public Finance 20, no. 1 (2013): 129–68.
[16] Rick Weber, “The Effect of Tax Code Complexity on Entrepreneurship,” Journal of Private Enterprise 30, no. 2 (Summer 2015): 890–913.
[17] Pontus Braunerhjelm, Johan E. Eklund, and Per Thulin, “Taxes, the Tax Administrative Burden, and the Entrepreneurial Life Cycle,” Small Business Economics 56, no. 2 (2021): 681–94.
[18] Ricardo J. Caballero, “Small Sample Bias and Adjustment Costs,” Review of Economics and Statistics 76, no. 1 (1994): 52.
[19] R. G. Hubbard, Anil K. Kashyap, and Toni M. Whited, “Internal Finance and Firm Investment,” Journal of Money, Credit and Banking 27, no. 3 (1995): 683.
[20] Jason G. Cummins, Kevin A. Hassett, and Stephen D. Oliner, “Investment Behavior, Observable Expectations, and Internal Funds,” American Economic Review 96, no. 3 (2006): 796–810.
[21] Huntley Schaller, “Estimating the Long-Run User Cost Elasticity,” Journal of Monetary Economics 53, no. 4 (2006): 725–36.
[22] Brahima Coulibaly and Jonathan N. Millar, “The ‘Elusive’ Capital-User Cost Elasticity Revisited,” The B.E. Journal of Macroeconomics 11, no. 1 (2011): 1–41.
[23] Nadja Dwenger, “User Cost Elasticity of Capital Revisited,” Economica 81, no. 321 (2014): 161–86.
[24] Kevin A. Hassett and R. Glenn Hubbard, “Tax Policy and Business Investment,” in Handbook of Public Economics, ed. Alan J. Auerbach and Martin Feldstein, vol. 3 (Elsevier, 2002), 1293–343.
[25] Jonathan Hartley, Kevin Hassett, and Joshua Rauh, “Firm Investment and the User Cost of Capital: New US Corporate Tax Reform Evidence,” in Tax Policy and the Economy, ed. Damon Jones and Robert Moffitt, vol. 40 (University of Chicago Press, 2025).
[26] Alan J. Auerbach and Kevin Hassett, “Tax Policy and Business Fixed Investment in the United States” (NBER working paper no. 3619, National Bureau of Economic Research, February 1991).
[27] Congressional Budget Office, Key Methods That CBO Used to Estimate the Macroeconomic Effects of the 2017 Tax Act—Supplemental Material for The Budget and Economic Outlook: 2018 to 2028 (April 2018).
[28] Mark P. Keightley and Jane G. Gravelle, CRS Model Estimates of Marginal Effective Tax Rates on Investment Under Current Law (Congressional Research Service, November 2024).

