- | Housing Housing
- | Research Papers Research Papers
- |
Substitutability in the Demand for Housing over Small Distances
Why housing demand isn’t uniform across a city—and how that shapes rent, development, and zoning debates.
Abstract: Some pairs of residential locations are better substitutes for one another than others, perhaps even within two hundred meters’ distance. As a result, rents and home prices can behave in ways that depart from the predictions of the most common urban economics models. The imperfect and varying substitutability between locations may arise due to preferences, information, or moving costs. Literatures in economics and complementary disciplines offer indirect evidence on the spatial substitutability of housing, homebuyers’ housing search processes, and the information accessed by housing searchers. The available evidence suggests that spatial substitutability varies from place to place, is non-monotonic across space, and is endogenous to market conditions. Housing searchers vary widely, and their diversity can produce market outcomes that differ substantially from those predicted by models where all searchers are the same. Spatial substitutability has implications for policy debates around gentrification, market power, and zoning.
Contents
Tests of monopoly zoning power
Why locations might be imperfect substitutes
Housing search: Evidence from interviews
Housing search: Evidence from real-estate websites
Quantitative spatial economics
Neighborhood choice and sorting
Motivating Literatures
Standard urban economics models assume that every residence in a metro area is a perfect substitute for every other residence. Thus, the impact of a housing supply shock on prices would be equal across the metro area. But researchers investigating the effects of new residential construction have found that housing prices in its immediate vicinity fall more sharply relative to prices slightly farther away (Asquith, Mast, and Reed 2023; Li 2022; Pennington 2025). One interpretation is that this evidence shows a departure from standard models, suggesting that substitutability may decay across space. Alternatively, this evidence may merely reflect local disamenities created by new buildings. This paper reviews the available qualitative and quantitative evidence that would help us distinguish between those stories.
Imperfect substitutability can add complexity and uncertainty to models of metropolitan housing markets. In a later section, I review how the quantitative spatial economics literature relies on substitutability parameters that are not yet grounded in the micro evidence.
The degree of substitutability across space also has implications for political efforts to reform zoning. Housing policy analysts have generally believed that regional prices are largely determined by regional supply and demand conditions. But if substitutability is sufficiently low across space, localized new housing supply would have quite different price effects in different places within the same city. This would have different implications for the political economy of policy reform than standard models have.
Open questions
The departures from standard models raise a set of unresolved questions about how housing markets function at very local scales. The goal of this paper is to identify the scope of the unanswered questions facing urban economists about local housing demand. Aside from their intrinsic interest, the concepts of hyperlocal housing demand and imperfect spatial substitutability have implications for several open questions.
- Does an increase in market-rate housing supply decrease surrounding rents in gentrifying neighborhoods via supply–demand channels or by creating a local disamenity?
- Do small jurisdictions have enough monopoly power over their own land use to influence prices through regulatory supply channels?
- Who will gain and lose from specific regulatory reforms, and how do those outcomes influence the political economy considerations around reforms?
- Can a landlord engage in monopolistic pricing if it owns a substantial share of housing in one neighborhood?
- How should researchers addressing a host of local-housing-market questions ground their assumptions about the housing demand curve facing a neighborhood or municipality?
- As parcel-level microdata become increasingly available, can researchers identify microfoundations behind the choices they make in modeling spatial housing demand?
The question of hyperlocal elasticity is a subset of a broader empirical question that is hugely important in the debate about delivering housing affordability via supply: How big are rent elasticities of housing demand? How do they evolve across time and space? Does a 10 percent increase in citywide housing stock decrease rents by 5 percent? 15 percent? After one year? After five years? Political careers are already being staked on such questions.
Three literatures—two new and one venerable—motivated this paper by measuring some of the potential implications of spatially decaying substitutability. The next three sections review these literatures. The first of these literatures examines hyperlocal price responses to new housing construction.
Local supply shocks
A commonly held view among residents of high-demand cities is that new multifamily construction in poor neighborhoods tends to accelerate gentrification, which leads to higher rents. A series of papers has tested the effect of new construction on a few dimensions of gentrification and has largely found the opposite. In particular, several papers find that new multifamily construction lowers rents within a few blocks of the construction relative to rents a few blocks farther away. Those papers’ authors interpret their results to mean that demand is downward sloping at a hyperlocal level. For this to be true, the substitutability of apartments must decline noticeably across distances as small as a city block.
An alternative explanation relies on fewer assumptions about demand: New construction may simply introduce local disamenities that researchers are unable to observe. Multifamily housing has been identified as a disamenity in some contexts by Diamond and McQuade (2019) and Lin (2024), among others. The remainder of this subsection reviews the literature on hyperlocal housing supply effects, not exclusively in gentrifying contexts.
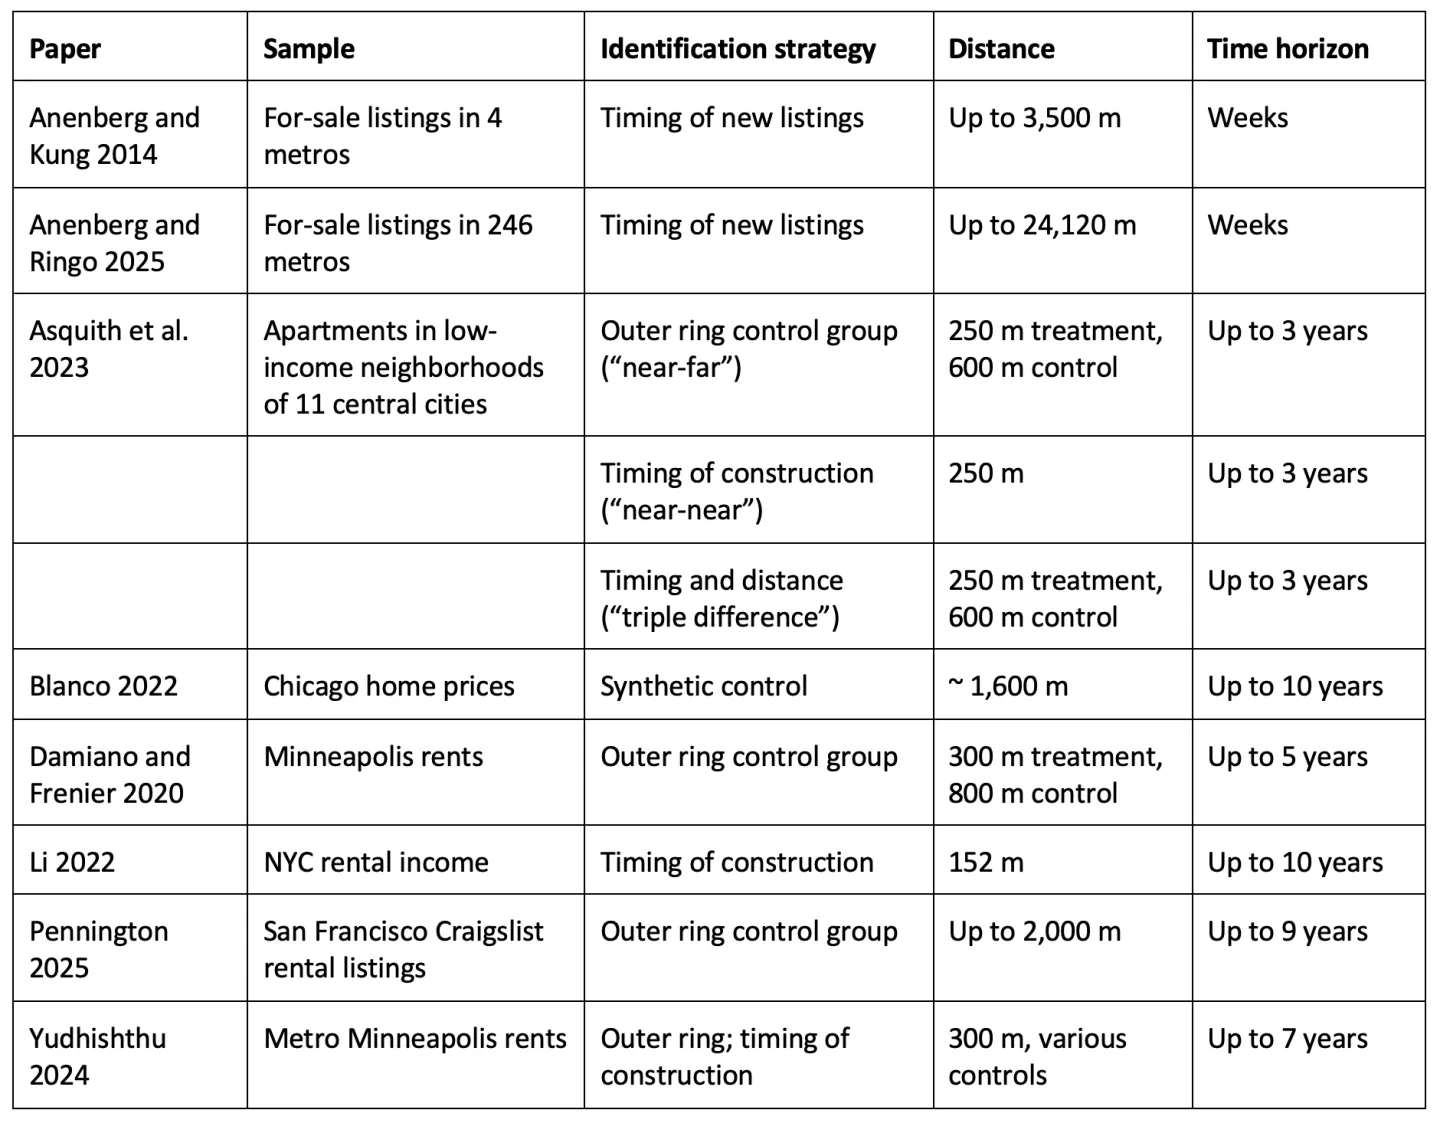
There are two common identification strategies in this literature, summarized in table 1. Asquith, Mast, and Reed (2023) use both, making their study a useful place to begin. They frame their investigation as a tug-of-war between “standard supply” effects and “counterintuitive” demand effects (359). The supply effect in question is itself non-standard, however, as it departs from the assumption of perfect spatial substitutability that undergirds common urban economics models.
With their first identification strategy, which they call the “near-far specification,” Asquith et al. identify a differential rent effect of new construction at a distance of 0 to 250 meters versus 250 to 600 meters. Their identification relies on the assumption that trends in the inner circle and outer ring would be equal in the absence of construction.[1] The effect size is −4.9 percent of rent. For the second identification strategy, or “near-near specification,” they use the 250-meter radius circle around buildings completed in 2019 as a control group for buildings completed in 2015 or 2016. This approach finds a statistically indistinguishable −6.2 percent of rent effect.
The authors finally combine the two identification strategies in a “triple difference” specification, which exploits both timing and location. They use 2015–2016 construction sites as the treatment group and sites to be treated in 2019 as the control group. That yields a slightly strong −7.1 percent reduction in rent.
To confront the question of whether the negative hyperlocal rent effect arises via supply or disamenity channels, Asquith et al. use a simple numerical example of spatially narrow search. They show that if all searchers limit themselves to a 550-meter radius circle, the substitutability between nearby properties can drop quickly across space. This model accounts well for the results of their near-far specification but is in tension with their near-near specification. If properly identified, the near-near estimate should capture the most comprehensive supply plus (dis)amenity effect of new construction at its strongest point. If Asquith et al.’s argument is correct, the near-near result ought to be larger than the near-far result, which subtracts the supply plus (dis)amenity effect of the new building on apartments in the second ring. However, the point estimate of the near-near specification is statistically indistinguishable from the point estimate of the near-far specification. The standard errors are wide enough to allow that the hyperlocal effect is between 28 and 280 percent of the more comprehensive effect, with the point estimates suggesting 80 percent. With such wide standard errors, one cannot reject the narrow search hypothesis that Asquith et al. offer; but neither does one see a strong pattern of evidence in its favor.
Using an event study approach similar to the “near-far” specification, Pennington (2025) studies the impact of new construction on surrounding rents in San Francisco. She uses new construction only on sites destroyed by previous fires, representing arguably exogenous supply shocks at the time of completion. A key identifying assumption is that the year in which a building is completed is random. Her estimates show that rents fall significantly at all distances up to about 1,250 meters (2025, figures 6 and 8a). The estimates for each distance ring are noisy enough that no spatial pattern would be detectable within that range.
Pennington’s point estimates show no evidence of a strong inner ring rent-reduction effect such as that reported by Asquith et al. In the smallest ring she considers, 100 meters, Pennington finds several large, significant, but very imprecise estimates: eviction notices are fewer while business turnover and new construction are higher. Pennington’s results do not align to the expected impact of modest new construction. Half of the rent effect of new construction arrives one year before construction is complete. And the effect size is eye-popping: the construction of a single 14-unit building causes an anticipatory 1.5 percent decline in rents across an area of about five square kilometers.[2] That strains credulity.
Why might Pennington’s creative identification strategy yield this uncomfortably large result? One possibility is that the city might be less obstructive in places where rent is rising less rapidly. The prior-year price slowdown would thus be a cause of completion, not an effect.[3]
Looking at another high-value urban market, Li (2022) exploits completion timing of high-rise New York City buildings—mostly condos—to conclude that supply effects overwhelm (positive) amenity effects and lower nearby rents. She tests results in a 152-meter (500-foot) circle, finding insignificant effects in a wider 152- to 304-meter outer ring.[4] She estimates that a new high-rise lowers rent by 1 percent and adds 0.1 restaurants within the inner circle. Condos and rental buildings have indistinguishable effects on rents (2022, 1345), which is consistent with congestion disamenity effects but only squares with a market-segmentation logic if newly purchased condos are typically offered on the rental market.
TABLE 1. Strategies to estimate the effects of hyperlocal supply shocks
Li also looks at different price tiers of buildings (using post-hoc rents) and finds that new construction has the strongest negative effect on the highest-rent buildings and no effect on low-rent buildings (1349).
Both Asquith et al. and Li provide enough information to allow me to approximate the rent elasticity of demand implied by their point estimates if net amenity changes were zero. As expected in a small geographic area, the estimates are highly elastic, ranging from −3.5 to −20. By comparison, metro-level demand elasticity estimates have tended to be −1 or smaller (Albouy, Ehrlich and Liu 2016; Ermisch, Findlay, and Gibb 1996).
Damiano and Frenier (2020) distinguish the effects of new construction across different price tiers in Minneapolis and find that nearby construction increases low-end rent and decreases high-end rent. They use a specification most similar to Asquith et al.’s near-far approach, comparing rents in an inner “treatment” circle to those in an outer “control” ring. They find no effect of new construction on rents in the middle half of the distribution. They find that treated bottom-quartile rents rise about 6 percent relative to the control group, while top-quartile rents fall about 3 percent. Both effects are estimated with some noise, as in other studies, and appear to reach their full magnitude after about three years.
The authors note that the high-end effect is consistent with a local supply effect: “For existing buildings in the same market tier as new construction, the new buildings serve as plausible substitutes for renters and inject more price competition into the neighborhood” (28). Why expensive new buildings should raise low-end rents is less obvious. New buildings could attract amenities or “signal to landlords that demand for their units may be increasing” (29).
Although Damiano and Frenier’s split-effect result is typically interpreted as a point in favor of gentrification worries, it does not comport well with the “endogenous demand” model of gentrification whereby each new residential building generates more demand than it satisfies. If that occurred, one would expect a positive price effect in the most substitutable buildings. Instead, Damiano and Frenier find a phenomenon more simply explained by landlord learning or endogenous amenities.[5]
Studying the construction of Low-Income Housing Tax Credit (LIHTC) buildings in the Minneapolis metro area, Yudhishthu (2024) adds evidence to Damiano and Frenier’s work. He uses three estimation strategies and finds varying negative effects on listed prices within 300 meters. Notably, he finds no price effect among the cheapest-quartile buildings, but a roughly 11 percent decrease among the other three quartiles. This is consistent with local disamenities and inconsistent with local supply and demand.[6]
Blanco (2023) studies demolitions of public housing in Chicago, which displaced thousands, constituted extremely large supply shocks, and had widely anticipated amenity effects. Blanco’s ability to follow displaced residents adds a valuable layer of insight. The study uses a synthetic control identification strategy. Relative to the ring-based approach, the synthetic control identification strategy has the virtue of keeping the control group farther away from the treatment. The cost, of course, is that it relies on the assumption that parallel trends would have continued through the treatment period. An obvious risk to the identification strategy in this case is that the treated tracts are largely in centrally located areas, while the control tracts are all in the city’s outer neighborhoods (2023, figure III).
Blanco finds effects not just in Census Tracts, where public housing units were demolished, but also in neighboring tracts and second-ring tracts, relative to synthetic control groups made up of tracts from elsewhere in the city. Home prices rose 34 percent, 18 percent, and 10 percent, respectively, in the three treated rings. Using tracts as units of distance is imprecise but usually corresponds to larger distances than in the papers discussed above. The distance from a public housing project to the far side of a second-ring tract is usually above 805 meters, often 1,609 meters (one mile), and sometimes more.
In tracts with public housing demolitions, the supply shock constituted a loss of 35 percent of all units (although the demolished units had high rates of vacancy and deterioration). Blanco models the displacement and amenity shocks together. Depending on the parameterization and assumptions, supply effects can amount to between 18 percent and more than 100 percent of the home price effect in nearby tracts. Greater spatial substitutability implies, in general, that amenities were more important and supply effects less important in raising prices. Other parameters, however, also play a large role.
Anenberg and Kung (2014) and Anenberg and Ringo (2025) identify the impact of a single new real estate listing on nearby houses already listed for sale. A new listing induces marketers of nearby properties to lower their asking prices and decreases the likelihood of sale. However, “nearby” is a surprisingly broad concept. Anenberg and Kung find that new listings result in list price decreases as far as 3,500 meters away (2014, appendix, figure 3), although the effect is greatest in the immediate vicinity and fades noticeably within a kilometer. Anenberg and Ringo identify strong search congestion effects within 805 meters, falling by a factor of perhaps 3 in the ring between 805 and 1,609 meters, and fading gradually to as far as 16 kilometers.[7]
The local supply-shock literature is not designed to distinguish between (dis)amenities that shift the demand curve and supply-induced movements along the demand curve. Given the balance of the evidence, some authors appear to have gone too far in identifying price declines as local supply effects. Without further evidence, one cannot reasonably distinguish between those two sources of downward local price pressure.
Tests of monopoly zoning power
At a significantly larger geographic scale, a literature dating to White (1975) hypothesizes that municipalities—especially large ones—might be able to exercise a degree of monopoly power by restricting housing supply.[8] Like the local supply shock literature, this question also relies on imperfect substitutability across space. Given the larger distances involved, one might reasonably expect to find that municipalities face downward-sloping demand curves even if the hyperlocal effects of supply shocks are amenity-driven.
Hamilton (1978) and Fischel (1980) comprise the first debate about the hypothesis, but—especially in the former’s case—with standards of evidence that would not be publishable today. Their debate focused on jurisdiction size as the likeliest source of zoning power. Curiously, that dimension vanished in the literature that follows, yielding to nonspatial distinctions. Advocates of regional government including Rusk (1993) and Tomalty and Mallach (2016) offer the reverse hypothesis: that larger jurisdictions will zone more permissively, in part because they internalize the pecuniary externality of unaffordability.
Greater Boston, with its fixed partition into fiscally and regulatorily independent towns, has been a favored laboratory for testing the monopoly zoning hypothesis. Glaeser and Ward (2009) use Hub home sales from 2000 to 2005 and find that minimum lot size regulation modestly increases prices within a town (by 12 percent per acre required), but that effect disappears if one controls for demographics or historical forest and density. Their findings are consistent with minimal, if any, monopoly power on the part of each town.
Zabel and Dalton (2011) use 750,000 transactions in 178 eastern Massachusetts towns from 1987 to 2006, along with 27 inferred changes in minimum lot size, to estimate “Community Zoning Power” (CZP) for each town. CZP “determines the extent to which land use regulations are capitalized into the price of housing in a town” (575). Under the hypothesis that zoning power arises from different valuations of common amenities, the authors define CZP as the (nonspatial) distance between a town’s amenity bundle and that of its closest substitute. They estimate CZP both from data on two amenities (job access and school test scores) and as a fixed effect residual from a hedonic regression. Using the latter estimate, the authors’ model shows that a town with a high CZP could increase its home prices by over 15 percent using the same (drastic) minimum lot size increase that would increase prices by less than 5 percent in a low-CZP town (2011, figure 4). The Boston-area papers are surprisingly non-spatial. It would have been straightforward for Zabel and Dalton, for instance, to incorporate physical or travel distance between towns as well as distances in amenity space.
Using data from the opposite coast, Lin and Wachter (2020) look for evidence of spillover price effects from regulation. They use California home sales data provided by Zillow (ZTRAX) and a 1992 survey of land use regulations (CALURI) to construct a panel with plausibly exogenous variation in initial restrictiveness. They find that the price effect of the inverse distance weighted regulatory intensity of the 30 nearest Census Tracts is one-fifth as large as the direct effect of own-tract regulation. This finding is consistent with a high rate of spatial decay, although it may be magnified by amenity effects of regulation. With the availability of GIS zoning data, such as via the National Zoning Atlas, this type of analysis might achieve more precise results.
The monopoly zoning literature takes as its units of analysis areas far too large to help quantify the spatial decay of housing demand substitutability across small distances. Consistently showing that monopoly zoning power is weak would strongly suggest that spatial substitutability is high. The existing findings, however, are few and come to inconsistent conclusions.
Supplier market power
Concentrated ownership, like concentrated regulatory power, may result in monopolistic pricing. A relatively new strand of literature considers the impact of competition among rental housing suppliers in pricing. Quintero (2023) shows that a decline in the number of homebuilders active in an incorporated city or census-designated place leads to a decrease in new construction and an increase in price volatility. In his approach, the geographic level is a reasonable and convenient choice, and imperfect substitution across municipalities is inferred.
Ramoutar (2024) shows that when rental markets are highly segmented, landlords can set rents oligopolistically even when they control a small number of apartments relative to the citywide total. She uses Infutor moving data as evidence that markets are segmented by geography and building type:
- Approximately one-half of renter moves within the City of Chicago cover less than 1,609 meters.
- About 75 percent of renters remain within their pre-move building type category (2–4 unit; 5–49 unit; 50+ unit).[9]
Imperfect substitution across space is a necessary ingredient in almost any investigation of market power on the part of housing suppliers.[10] Improving economists’ understanding of the magnitude and variability of spatial substitutability of demand will help them gauge the importance of oligopoly in housing markets.
Why locations might be imperfect substitutes
Models of housing demand in the Alonso–Mills–Muth and Rosen–Roback traditions assume that all locations within a city are perfectly substitutable. Spatial amenities and commute distance are additive (or log-additive) terms that are equally valued by all buyers. Buyers have full information. There are no costs to relocation.
Economists understand that the world departs from these assumptions in potentially important ways. The departures may even occur at a hyperlocal scale.
- Imperfect information can lead to departures from bid-rent arbitrage such that the few with information about lower prices in a specific neighborhood can take advantage of it by consuming more housing and raising their utility above the city standard. That is, the demand curve for housing in a specific location can be downward sloping.
- Relocation costs can have the same effect, although they are eroded over time.
- Unequal amenity valuations can have complex effects (see Couture et al. [2023]), including generating downward-sloping demand for neighborhoods that have scarcer amenities (Henderson 1991).
- Pure location preferences, such as local ties and neighborhood loyalty, are a special case of unequally valued amenities. These are demonstrated at the metro level by Zabek (2024). One can easily conceive of preferences for proximity to a family member, ethnic enclave, school, club, church, or place of personal meaning that are held by only a small share of potential residents.
The possible sources of downward-sloping hyperlocal demand may be impossible to distinguish if we observe only market outcomes. For example, a person who pays increasing rent to live in a specific neighborhood despite no change in amenities and no change in the rent of surrounding areas may do so because he is unaware that his relative rent has risen, is uncertain of the amenity value in alternate locations, faces high relocation costs, values the location’s distinct mix of amenities at a higher level than others, or has local ties.
In the case of a locational preference with hard boundaries, such as a school catchment area, there could be a discrete drop in substitutability at the boundary. In most other cases, we expect substitutability to decline with distance (or to exhibit a spotty pattern, for instance if the scarce amenity in question is something with multiple nodes, like access to a specific metro line or proximity to a laundromat).
In a clarifying exercise, Lee, Irwin, Irwin, and Miller (2021) test the Chicago and Los Angeles schools of urban thought, showing how statistical summaries of urban form correspond to differing theories of the city’s social and economic patterns. To operationalize this, they test whether “distance-based amenities,” such as access to downtown, or a residual “local amenity” is a stronger predictor of changes in home prices in Columbus, Ohio, from 2000 to 2015. They find that the latter dominates. The paper may claim too much: There is always risk in labeling a residual, and the regressions contain obvious, unremarked collinearity among the various “distance-based amenities.” Still, it is undeniable that home prices in Columbus evolved in patterns that cannot readily be explained by an Alonso–Muth–Mills framework. The discipline’s inability to say whether these departures are likely explained by localized (rather than distance-based) amenities or imperfect spatial substitutability is a measure of the open question this paper seeks to state.
As Henderson (1991) notes, imperfect spatial substitutability may arise purely as an artifact of unequal valuation to spatially distributed amenities. Consider a city in which dwellings are distinguished only by their access to amenity A. If new dwellings are constructed with high access to A, they will compete equally with all other dwellings in the city, all of which will face proportional declines in willingness to pay. But if the city also has a second amenity, B, which only half the population values, dwellings will no longer be perfectly substitutable. The B-loving half of the population will tend to live in dwellings with high access to B. If new housing is added with high access to B, B-loving residents will be willing to pay more for it than B-indifferent residents. Demand for other dwellings with high access to B will decline more than demand for dwellings with low access to B. If B is a spatially accessed or spatially distributed amenity—such as a place of employment, a park, a view, air quality, school quality, or walkability—then demand will exhibit spatially decaying substitutability. With brief reflection, one can convince oneself that virtually every amenity and dwelling feature is disproportionately valued by some segment of the population, and most are spatially accessed or distributed. Thus, one should expect to find some degree of imperfect spatial substitutability at every scale.
Mense (2023, 6), however, adds an important interpretive wrinkle, arguing that “market integration” does not require substitutability. He finds this effect in regional supply shocks caused by weather that delays completion of (mostly) single-family houses in Germany. He finds strong propagation of supply shocks throughout the entire housing market, crossing the line from owned to rental housing stock. He interprets this finding as propagation via vacancy chains, noting that a large share of moves in Germany (14.8 percent) are transitions from rental to ownership. He also shows that supply shocks are associated with potentially large changes in the number of new listings, suggesting long vacancy chains. (Point estimates cluster around four new vacancies per housing unit completed, and standard errors allow anything from zero to eight). Mense’s finding implies that observable, market-level substitutability is an emergent phenomenon distinct from substitutability in individual choice sets.
Spatially decaying substitutability clearly exists. But its magnitude, its similarities across cities and segments of the housing market, and the relative importance of different sources of imperfect substitutability are all open questions. Distinguishing among the mechanisms—information frictions, search behavior, moving costs, and heterogeneous preferences—requires evidence at the level of individual search behavior, information, and mobility.
Micro-level Evidence
Although the literatures that motivated this paper are largely agnostic about the possible reasons that local demand curves might slope downward, a richer understanding of the topic requires some qualitative and quantitative knowledge of the several channels through which imperfect substitutability might arise. This section reviews several types of evidence in extant research, usually found in papers focused ultimately on broader questions.
Housing search: Evidence from interviews
Qualitative research can help ground economists’ understanding of how people gather information about potential dwellings. If information and search have low costs, then those frictions can be ruled out as primary sources of imperfect spatial substitutability. However, this author found that the qualitative literature was sparse and narrow. Ample room remains for descriptive research to illuminate the home-finding process.
A geography and sociology literature predating widespread internet use documented the practices of small samples of searchers. Regrettably, the sampling procedures were often nonrandom, and it is difficult to compare outcomes across studies. One example is Rossini (1998), who surveyed 606 recent buyers in Greater Adelaide, Australia. The typical searcher “inspected” about 50 properties before buying, but with large dispersion. Search usually covered a few neighboring suburbs: “over 70% of purchasers looked only in the suburb they purchased or in the adjoining suburbs” (8).
Oddly, this line of inquiry largely faded with the advent of web-based search. A few recent papers shed some light on search in the internet age:
- MacLennan and O’Sullivan (2012) surveyed 1,683 recent homebuyers in Strathclyde, Scotland. They were distressed to learn that half of respondents bought the only house they visited; even more among younger, lower-income buyers. Only one in eight of the highest income group did so. Instead, high-income buyers were very broad in their searches, visiting on average 12 local government areas out of a possible 19.
- Chen and Lin (2012) surveyed 82 recent homebuyers, almost all of whom were New York City residents and college graduates. Their mean searcher visited 2.85 ZIP codes over the course of 7.2 months and moved 7.9 miles from her previous home.
- Lin (2020) studied the Manhattan rental market, which is uniquely dependent on brokers, many of whom are part time. On average, brokers have listings of 8.3 rentals in 4.2 buildings in 2.4 Manhattan neighborhoods (out of 28) and 2.0 community districts (out of 12).
The most insightful recent evidence comes from a large, collaborative investigation of the residential decisions of low-income urbanites. DeLuca and Jang-Trettien (2020) review and summarize this literature, which relies on 1,200 interviews with hundreds of systematically sampled low-income families over five US cities and 17 years.
Their key findings are that most moves are reactive and characterized by sequential (not joint) decision-making about residence and schools. They find that “low-income families often narrowed their search to just a few crucial priorities, most of which involved the attributes of the dwelling itself, rather than an assessment of different neighborhoods.” To the extent that they did consider location, they “relied on block by block micro-knowledge they had acquired for neighborhoods they were familiar with, while also feeling pessimistic about searching beyond the boundaries of what they knew.” By contrast, the same researchers found that affluent families considered a broader set and explicitly balanced tradeoffs.
In a small but complementary study, Boschmann (2011, 672) surveyed 30 low-income households in Columbus, Ohio. He draws three principal conclusions: “(1) these individuals live transitory lives, frequently switching jobs and residences; (2) residential choice is highly influenced by proximity to bus lines; (3) individuals primarily choose places of employment relative to their commuting mobility.”
These findings correspond to important informational and transportation limitations facing low-income renters, with the potential consequence of spatially decaying substitutability. Similarly rich and multifaceted evidence on other types of housing-market participants would be welcome, to flesh out a more complete qualitative view of the labor market.
Housing search: Evidence from real-estate websites
The internet era has massively expanded the information available to—and about—home searchers. Several authors have been able to take advantage of proprietary data to describe the aspects of housing search that leave digital fingerprints.
Quantitative evidence on search is the most promising source of potential microfoundations for understanding spatial substitutability. These data include information about searchers (and potentially bidders) who did not buy. And the data allow researchers to test spatial hypotheses such as how search breadth responds to economic and physical conditions.
Badarinza, Balasubramaniam, and Ramadorai (2024) use data from Rightmove “covering over three-quarters of all housing transactions in the UK,” including rental contracts, from 2019 to 2022 (2). They track multiple stages of the housing search process by linking detail-view clicks, requests to contact the seller or lessor (presumably with the intent of visiting the property), and registered sales. They find wide variation in the geographic scope of search (2024, figure 1). To measure this geography, they define search radius as the square root of the product of the standard deviations of latitude and longitude in properties searched: r = (σlat σlon)½. This standardization appears to be novel.
FIGURE 1A. Properties listed for sale, search radius data from Badarinza et al. (2024, figure 1)
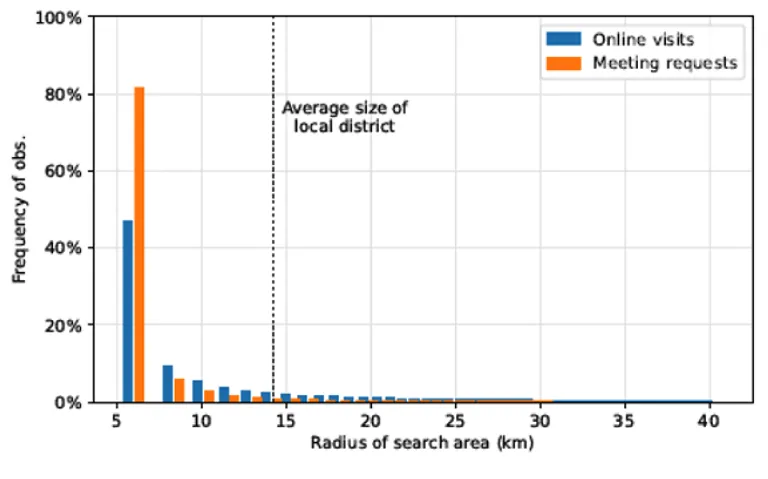
FIGURE 1B. Properties listed for rent, search radius data from Badarinza et al. (2024, figure 1)
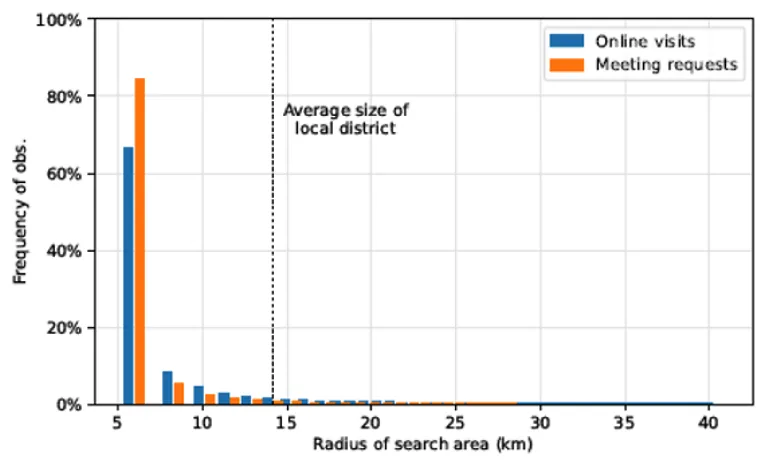
Source: Cristian Badarinza, Vimal Balasubramaniam, and Tarun Ramadorai, “In Search of the Matching Function in the Housing Market,” 2024, Working Paper.
In their sample, the median buyer views properties online across a 10.4 km radius but narrows to a 1.7 km radius in the next stage of search, requests for direct contact with the seller. Renters search more narrowly: 3.7 km in the first stage and 1.45 km in the second.
Piazzesi, Schneider, and Stroebel (2020) show how rich microdata and search modeling can be combined to yield important insights into housing market dynamics; the modeling aspects are discussed later below. Their key empirical contribution comes from email alerts generated by user-defined parameters on trulia.com. They study the San Francisco Bay region from 2006 to 2012, a unique period of almost monotonic home price decline. For each ZIP code, they define three potential submarkets based on price. They find that many searchers are “narrow,” setting alerts for a single municipality or ZIP code. But other searchers are “broad,” looking across a large region and often focusing on the low end of the market.
Rae and Sener (2016) offer a similar empirical investigation of prospective buyer search in an expensive city. They use London data from Rightmove. These data have the benefit of Rightmove’s “Draw-a-Search” feature, which allows users to create their own polygons on a map rather than following administrative divisions. Like Piazzesi et al., they find a wide dispersion of search areas. Half of users define search areas of five square kilometers or less; a quarter search less than one square kilometer. But at the other extreme are 15 percent of searchers defining a search area of more than 30 square kilometers.
FIGURE 2. Intense search for low-priced properties, Rae and Sener (2016, figure 6)
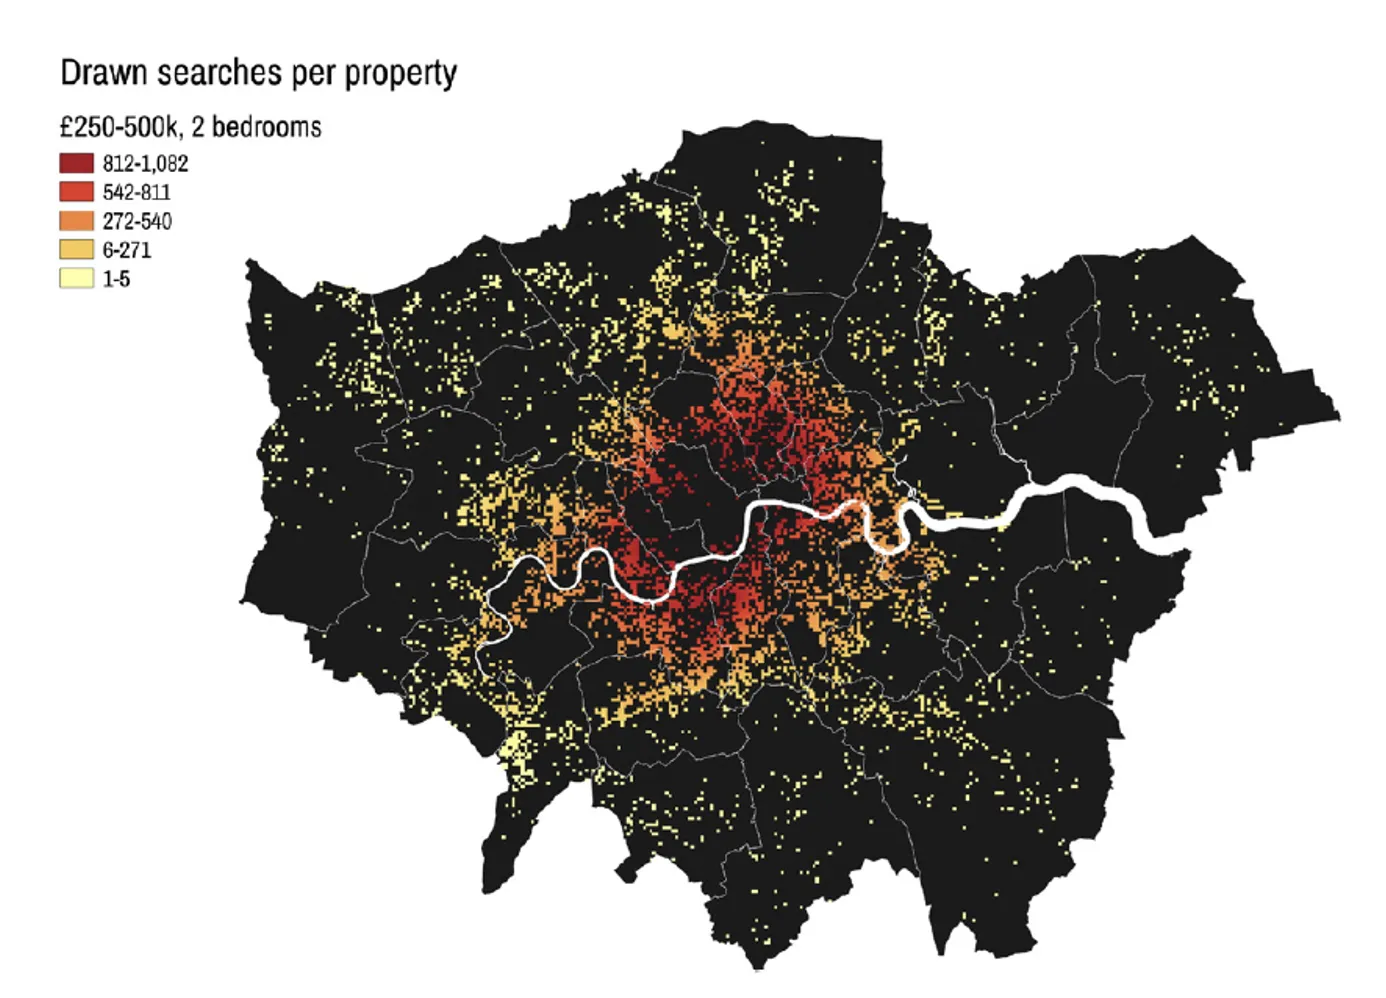
Source: Alasdair Rae and Ebru Sener, “How Website Users Segment a City: The Geography of Housing Search in London,” Cities 52 (March 2016): 140–47, https://doi.org/10.1016/j.cities.2015.12.002.
The London data reveal optimistic search behavior: people search for low-cost homes in high-value locations. As a result, the search-per-property ratio for modestly priced, centrally located properties was hundreds of times higher than for similar properties in suburban locations. Unrealistic optimism in web search allows us a glimpse of the usually invisible part of a demand curve, sloping down to impossibly large quantities at implausibly low prices. It’s also a reminder that search behavior does not imply a willingness to pay at or near current prices.
Gargano, Giacoletti, and Jarnecic (2020) use the 2017–19 web search data of 9,000 unique users of realestate.com.au, the largest Australian real estate website. Like others, Gargano et al. observe huge variation in search breadth and intensity across users. The interquartile range in their data is from 2.4 to 10.3 unique postcodes viewed in a month.[11] They find that searchers from postcodes with higher recent price growth searched more broadly, consistent with slacker collateral constraints. The authors also find that postcodes which receive less search attention are cheaper than other postcodes and experience larger positive price effects from increased attention. Although this finding is identified using an instrument of questioned validity,[12] it provides correlational evidence consistent with search-and-matching models.
Aside from their unique settings in time and place, the great limitation of this literature is that it captures only one artifact of searchers’ processes. The diversity of website use certainly suggests comparable diversity in the more advanced aspects of the search process, but the differences in activity may be attenuated or magnified in subsequent steps. Diversity of use may also reflect diversity of searcher characteristics. For example, to this reader, Piazzesi et al.’s broad searchers seem suspiciously like investors intending to flip houses or use them as short-term rentals: bargain hunters indifferent to ZIP code but focused on locations with retail and entertainment amenities, they end up purchasing in locations inhabited by young, impecunious parents.[13]
Nonetheless, this young literature has already yielded important insights. And many interesting descriptive questions remain unanswered, such as identifying how search practices differ depending on market conditions.
Evidence from moving data
Several researchers have used address-change data to track moves, which provide indispensable evidence on the resolution of housing searches. However, with researchers asking questions specific to their own applications, the published record contains far less relevant information than the data obviously contain. This section reviews the two most relevant papers.
Mast (2025) uses confidential US Census Bureau moving data and the Infomap algorithm to group Census Tracts into districts based on the number of moves observed between tracts. He finds that moves are concentrated within narrow, contiguous geographic areas. His modeling choices scale the districts, which are unions of Census Tracts, to average about 40,000 residents. Mast’s districts are, arguably, proxies for spatial substitutability. A spatially larger district indicates a wider move-shed, suggesting that local movers’ housing demand declines more slowly across space. Using data provided by Mast, I found that the lowest-density districts have lower populations (figure 3). But above the bottom quartile of density, district population is invariant, consistent with spatial substitutability being the inverse of density. Inverse-density substitutability could arise from either preferences or search behavior.
To explore potential determinants of varying spatial substitutability, I regressed the log land area of Mast’s districts on indicators in the federal Transportation Communities Explorer database.[14] As table 2 shows, the districts are smaller in places with fewer cars and higher job access, renter share, transit frequency, and physical barriers (water share and physical barriers such as major roads and airports). Perhaps surprisingly, metro area population and income (relative to the metropolitan median) are insignificantly associated with district land area. In unpublished work, Mast shows that the rate of tract-to-tract moves is much higher among same-district tracts than equally proximate different-district ones, as shown in figure 4.[15] This suggests that spatial substitutability declines with distance at an uneven rate. Mast’s findings and the current analysis of his districts offer some justification for the common practice, in empirical papers, of assuming perfect substitutability within a locality and imperfect or zero substitutability outside. The two-level model common in quantitative spatial economics papers (reviewed below) is a good example. But Mast’s research also cautions that extant administrative boundaries align poorly with movers’ behavior.
TABLE 2. Analyzing Mast (2025) districts
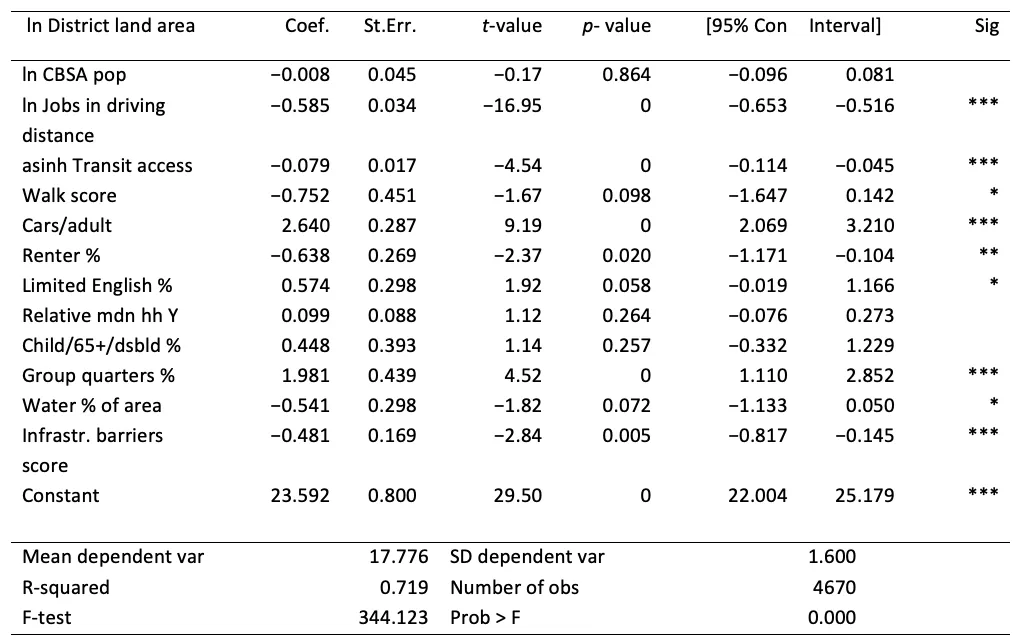
Source: Mast (2025), American Community Survey (2010-2014), Equitable Transportation Communities Explorer, https://dwrowlands.com/projects/etc-explorer/.
*** p<.01, ** p<.05, * p<.10
In parallel work, Ziff (2025) uses Stochastic Block Modeling to divide the City of Chicago into districts based on moving data (from InfoUSA). Unlike Mast, she constructs districts from Census Blocks rather than tracts and allows the districts to be noncontiguous. Some Ziff districts appear to be natural neighborhoods; others consist of scattered blocks.[16]
Although Ziff does not explore this angle, it is possible that the noncontiguity reflects the interaction of typology and space, as in Ramoutar’s work on Chicago. That is, someone who rents luxury apartments will move only between Census Blocks that contain such units, skipping over intervening blocks containing only cheap apartments or for-sale units.
Ideally, researchers could combine search with moving data for the same individuals to understand how search processes and information lead up to the final purchase or rental. But moving data on their own likely contain many further insights that can suggest the spatial scales of individual preferences for housing.
FIGURE 4. Proximate tracts are highly connected by moves only within the same district
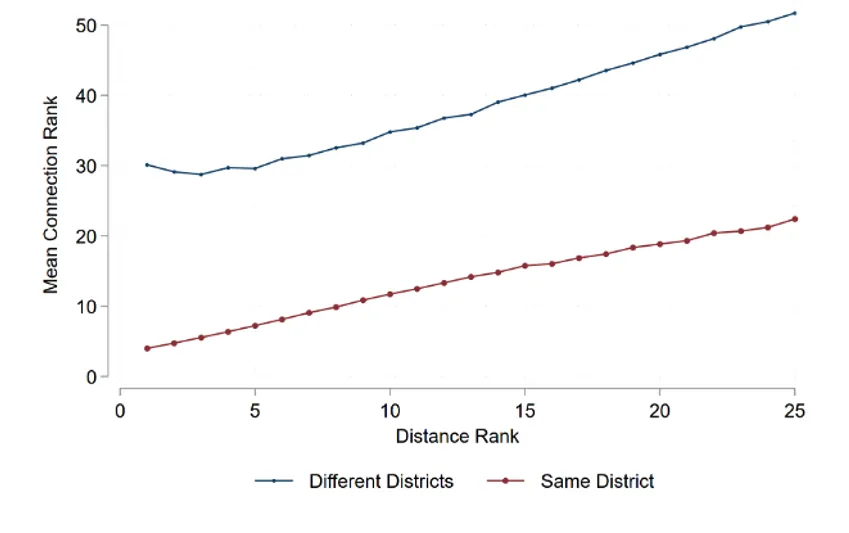
Source: Unpublished chart by Evan Mast.
Information use
Relatively little research has been conducted to learn how different groups of housing searchers access information. If information access is poor, informational frictions may be an important source of imperfect spatial substitutability. In the era of public, free real-estate listing websites, it is hard to imagine that information is a major barrier to purchasers. But it is possible that renters, who face a fragmented and often informal informational environment, might face significant costs learning about the rents, qualities, and neighborhood amenities of potential dwellings.
Internet search, however, is quite new. Krysan (2008) reports the results of the Detroit Area Study undertaken in 2004. The internet was used by 28 percent of housing searchers, a newspaper by 36 percent. However, among prospective buyers, neither method was as popular as looking for yard signs or working with a real estate agent (2008, table 1). Kroft and Pope (2014) show that Craigslist significantly disrupted the inefficient and costly rental information market, leading to a 10 percent decrease in rental vacancies. Boeing and Waddell (2017) characterize a snapshot of Craigslist rental listing data in mid-2014. These data are rich on many dimensions. Although they cannot be readily linked to transactions or buyers, future researchers may find other ways to employ them to understand spatial aspects of housing supply.
Several research approaches have noted that search processes and information sources differ by race and income groups. Newburger (1995) found that Black Boston homebuyers were more likely to look for listings in the Boston Herald than their White neighbors, who favored the Boston Globe. And Black searchers used fewer information sources overall. Farley (1996) found that Black searchers in Detroit, distrusting brokers, relied more on personal networks, newspaper ads, and driving around. Revisiting Detroit a decade later, Krysan (2008) found fewer distinctions between races, especially among homebuyers. Still, Black renters were more likely than White ones to use personal networks, and Black searchers encountered more difficulties. Boeing, Besbris, Schachter, and Kuk (2021) show that Craigslist is more prevalent and Craigslist listings contain more detailed information in higher-income, whiter neighborhoods.
As noted above, DeLuca and Jang-Trettien (2020) found that poor movers were likely to rely on their own or their networks’ knowledge of specific geographic areas. DeLuca, Wood, and Rosenblatt (2019, 570) describe how low-income African American families in Mobile and Baltimore found new housing units:
Respondents were most likely to receive information about housing from their relatives who lived nearby and were also likely themselves to be living in poor neighborhoods. Most often, these network members shared the addresses of “For Rent” signs they had seen in nearby windows, or the contact information of a “friend of a friend” who was leasing an available unit.
For voucher holders, lists of available units provided by the local agency were a valuable resource. However, given the scarcity of available units that both accepted housing vouchers and could pass an inspection, voucher holders typically accepted the first offer.
Harvey, Fong, Eden, and DeLuca (2020) tested the reach of this logic by interviewing a random sample of families across the income spectrum. They found that households of all incomes shared the aspirational goal of a carefully selected “forever home.” Rental dwellings, by contrast, were viewed as “temporary stops.” Not surprisingly, few low-income families were in a position to realize the aspirational goal. Low-income family moves were usually reactive and based on thin information.
Bergman, Chan, and Kapor (2020) used a randomized control trial to show that, when presented with a measure of school quality on the popular website GoSection8, voucher holders were much more likely to choose highly rated schools. This can be reconciled with DeLuca et al.’s findings without great difficulty: whether for rational or behavioral reasons, lightly informed choices can be significantly altered by the availability of more information.[17]
Technology not only makes information easier to obtain, it can increasingly filter and organize information to directly inform pricing decisions. Raymond (2025) finds that the digitization of county real estate records facilitated the entry of algorithmic housing investors in the early 2000s. Their entry systematically shifted prices, halving the racial home price disparity in the Southeast. Looking ahead, the use of algorithms and large language models by individual and professional housing searchers offers a fertile field for research on the role of information in spatial housing demand.
For our purposes, the available evidence suggests that there is ample possibility of informational frictions leading to lower spatial substitutability among low-income renters. This might explain why Mast’s move-based districts are larger in places with a higher renter share (Mast 2025, table 2). But it cannot explain Badarinza et al.’s finding that renters search an area one-eighth as large as buyers on the same website—that must be explained by differing preferences. Further inquiry into these empirical patterns can inform how spatial substitutability should be incorporated into formal economic models.
Operational Frameworks
Economics offers several modeling frameworks through which the growing body of evidence can be used to better understand the importance of substitutability, which has implications for many questions in urban economics. For example, Baum-Snow and Duranton (2025, 71) point out that if housing submarkets are imperfectly substitutable, empirical estimates of housing supply elasticities will depend on whether the identifying variation in demand is concentrated in submarkets with above- or below-average supply elasticities.
Spatial search and matching
The theoretical framework of search and matching models is obviously well-suited to housing markets. In search theory, incomplete information and timing frictions cause departures from the classic model where each household optimizes across all locations. If search is geographically clustered, spatially varying housing demand can arise endogenously from searchers’ being unequally attentive to supply in different places.
Piazzesi et al. (2020), discussed above, is a promising treatment that integrates diverse search types. In the model, the authors allow broad searchers to endogenously crowd into busier market segments, matching the regularity observed in search data. This behavioral response yields the unintuitive result that an increase in listings in a specific ZIP code can result in slower, not faster, housing searches there, since the new listings endogenously attract broad searchers. At the most general level, Piazzesi et al.’s work reveals that the geographic parameters of search are “shallow” phenomena, emerging from the balance between different types of searchers in overlapping submarkets that clearly vary in spatial extent. Any search for “deep” parameters of spatial substitutability is likely to be frustrated. And researchers should be conservative about extrapolating even the best-identified findings to other times and places.
A potential avenue of further research within the search and matching framework is to model how endogenous search choices change with economic conditions, both across time and in the cross section of cities. So far, no branch of inquiry has offered useful heuristics on how one might expect spatiality of search or substitutability to differ in tighter or looser housing markets.
Quantitative spatial economics
Another promising framework which could embed a rich fabric of spatial substitutability is the recent growth of quantitative spatial economics. Substitutability between neighborhoods is an important parametric input into quantitative spatial economics models, but little evidence exists to discipline the choice of those parameters.
Ahlfeldt, Redding, Sturm, and Wolf (2015) advanced the study of cities by deriving a computable model of a complex city. Their model allows for scattered employment and variation among city blocks. Block housing demand is influenced by commuter market access—a weighted average of the commuting time to jobs—and local amenities, some of which are endogenous. Within blocks, all housing units are perfectly substitutable and residential floor space is supplied elastically. In the model, households draw an idiosyncratic, pairwise utility shock that randomizes the value of all possible block-job combinations to generate realistic scattering of people and commutes across blocks. Thus, people do not usually commute to the nearest job. The idiosyncratic draws are not spatially correlated; a household’s best block-job combinations might be located anywhere in the city. As a consequence, the spatial decay in housing substitutability is a two-level step function: homes within a given block are perfectly substitutable, and those elsewhere in the city are equally and imperfectly substitutable.
In application, Ahlfeldt et al.’s extremely granular data allow them to study Berlin blocks of about five hectares and 274 residents. They calibrate the substitutability parameters of the model to account for geographic wage dispersion at this level.
Couture, Gaubert, Handbury, and Hurst (2023) use a similar model to look at downtown gentrification, a situation in which unequal demand for certain amenities plays a key role. The authors specify a “demand system similar to a nested logit” (7), with high substitution elasticity among neighborhoods of the same type and low substitutability between neighborhoods of different types.
Couture et al. borrow Ahlfeldt et al.’s block-level calibration for within-type substitutability. They call it an “amplification parameter,” noting that a household’s neighborhood match quality increases with city size: the more neighborhoods, the more match quality draws, the better chance of generating an excellent match. (This mechanical feature could of course be scaled away, but it may also be a reasonable reflection of real-world dynamics.) Couture et al. apply the borrowed block-level parameter data for US Census Tracts, which are scaled to have populations around 4,000. Furthermore, they show (2023, table 3) that the magnitude of their results is quite sensitive to this parameter.
Assuming that Ahlfeldt et al.’s substitutability parameter is correct for city blocks, would the correct parameter for Census Tracts be smaller or larger? One can construct a story in favor of either direction.
Baum-Snow and Han (2024) go some distance toward answering that question but can only confirm that either is possible. They use a model very similar to that of Couture et al. in order to estimate US Census Tract–level price elasticities of housing supply. As part of their structural estimation, they must pin down the parameters of a housing demand system based on a nested Frechet distribution. They estimate a tract-level, within-municipality elasticity of substitution either lower (3.9) or higher (8.5) than the block-level, metro-wide substitutability parameter estimated by Ahlfeldt et al. (6.83).[18]
As a framework, quantitative spatial economics holds promise for implementing richer models of spatial substitutability. The work undertaken so far, however, has received little guidance from other literatures in how to model spatial substitutability and what magnitudes appear to be reasonable. Mast (2025) suggests that districts of about 40,000 are the right low-level geography. As Couture et al. show, the implicative stakes are high.
Neighborhood choice and sorting
An older literature that has directly incorporated and gauged the importance of substitutability, usually at an abstract level, is the study of neighborhood choice. This literature can be thought of as a simplification of quantitative spatial economics, as it typically makes the employment side of the city exogenous.
Quigley (1985) argues that earlier research on housing choice was empirically flawed because it assumed independence of irrelevant alternatives (IIA), that is, that the relative odds of choosing between any two alternatives are unaffected by whether other options are in the choice set. IIA is unlikely in the case of houses, because some—especially those close together—are more substitutable than others. He hypothesizes that searchers pick a town, then a neighborhood, then a dwelling. Testing IIA with data on 584 renters who moved to metro Pittsburgh and responded to a 1967 survey, he finds large departures at both the neighborhood and town level, which imply that substitutability between dwellings and neighborhoods varies. Without accounting for the variation in spatial substitutability, his exercise would have underreported the degree to which renters were responsive to car commute time and neighborhood racial composition.
Bayer, McMillan, Murphy, and Timmins (2016) introduce intertemporal dynamic considerations into a model of neighborhood choice. They use mortgage applications and housing transactions in the San Francisco Bay Area from 1994 to 2004 to show that the dynamic model outperforms a static counterpart. They model the Bay Area’s geography as three large regions composed of neighborhoods with different characteristics. Each household has a high preference for one of the regions, but no idiosyncratic neighborhood attachment. The model performs quite well, which is consistent with high substitutability between neighborhoods within large regions.
They incorporate significant moving costs, which are a potential source of departure from the classic Rosen–Roback framework of additive, compensated amenities. In Bayer et al.’s model, only current movers have re-optimized around each period’s evolution of expected amenity flows. Those current movers cannot capture the gains to the barrier of entry, however: incumbent owners increase prices to fully price in the value of expected amenities, returning us to a world where amenities are, from the perspective of housing demand, purely additive and fully compensated. A key assumption in generating this result is full information on both sides. Thus, Bayer et al.’s result would not erase imperfect substitutability microfounded in incomplete information or search.
Anenberg and Kung (2020) use a similar neighborhood choice model to investigate the effects of a relative increase in housing supply within one part of a metro. Regrettably, the authors misreport their findings, claiming to offer a test of housing supply as a potential solution to unaffordability across an entire metropolitan area. Their assumption that population is perfectly elastic to housing supply (8), however, implicitly washes out any price effect via supply increases. Instead of answering the question they pose in the paper’s introduction, Anenberg and Kung offer an answer to the present paper’s question, although at an intermediate level of geographic aggregation. By allowing the housing stock of a single public use microdata area (PUMA) to increase while holding the citywide household-to-housing ratio equal to one, they effectively isolate the intra-metropolitan substitution effect.
In their estimates, substitutability across PUMAs is high. Price differences between PUMAs are mostly the result of “amenities” such as the college-educated population share. They estimate metro-specific PUMA rent elasticities with respect to (relative) new housing supply between −0.04 and −0.10.
Zabek (2024) uses a Rosen–Roback model to show that depressed regions such as Appalachia and the Rust Belt are inhabited by people with stronger local ties, via negative selection into emigration. Strong ties lead to lower real wages in declining places, as people who would otherwise migrate instead remain and accept lower wages. Although Zabek does not consider sub–metro area geographies, his regional logic could translate to hyperlocal ties.
This framework may be the best for understanding how individual preferences scale up to market-level outcomes. For instance, how many spatially indifferent searchers are needed to fully integrate two markets? It may also be relatively easy to enrich these models by allowing substitutability to differ between equidistant pairs of submarkets.
Segmentation of housing submarkets
Finally, one cannot ignore a long literature intended to improve the work of tax appraisers. This literature is largely built around the goal of partitioning cities into perfectly substitutable submarkets where home prices comove. The papers largely use property-level data and reduced-form methods. However, a series of reviews has found the literature lacking. Although intended to be a practitioner’s tool, submarket analysis has not arrived at recommendations for best practice or even an approximate spatial scale.
Watkins (2001, table 1) reviews the literature through the late 20th century, summarizing 18 previous papers. He concedes that submarket analysis has not been embraced by wider scholarship, partly because it is internally inconsistent. Keskin and Watkins (2017) note that submarkets have been identified in various papers with average sizes that range from one thousand to three million residents (1452). Case, Clapp, Dubin, and Rodriguez (2004) tried to address some of the disagreements by executing a four-way competition on a common data set, which covered 60,000 transactions in Fairfax County, Virginia, from 1967 to 1991. They find that nearest-neighbor data is especially useful for out-of-sample prediction, regardless of the method employed. Their competition did not yield a clear winner, however, nor does it seem to have heavily influenced subsequent scholarship.
Pryce (2013) renews a critique made earlier by Bartik (1987) and Epple (1987) and shows theoretically that comovement of hedonic factor prices (in this context, the prices implied by a regression of sale prices on house attributes such as the number of bathrooms) does not guarantee that two houses are in the same submarket (nor do differences in factor prices guarantee that they are in different submarkets). Instead, he aims to recover the idea of submarkets based on substitutability, which goes back to Rapkin et al. (1953) and Grigsby (1963).
Pryce sets out four desirable criteria for submarket identification strategy, notably including robustness to “continuity in the substitutability space.” To satisfy his own criteria, he proposes cross-price elasticity of price
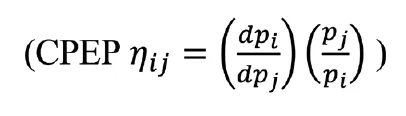
as a measure of substitutability. That is, places where prices comove are substitutable and can, at some degree of substitutability, be treated as parts of the same submarket. Pryce acknowledges the obvious objection that prices may comove for reasons unrelated to substitutability, such as interest rates or wage fluctuations. For instance, one can imagine two neighborhoods that both respond to one industry’s business cycle fluctuations despite little direct substitution.
To simplify CPEP, Pryce proposes a gradient
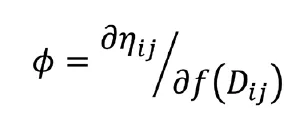
in distance as the simplest summary statistic for microgeographic variation in substitutability. His own empirical application to Glasgow, however, shows that spatial substitutability is far from uniformly decaying; some suburbs have prices that comove mostly with other, noncontiguous areas. Because Pryce’s model uses only a single metropolitan area, it is difficult to know how much of the comovement of prices is due to macroeconomic factors. Replicating Pryce’s work across several metros in the same country would be a step toward testing whether CPEP is a strong candidate for measuring substitutability.
While authors such as Beenstock, Feldman, and Felsenstein (2020) have applied and advanced Pryce’s approach to other data, others have rebuffed the critique. Bhattacharjee, Castro, Maiti, and Marques (2016) argue that similarity in hedonic characteristics and hedonic prices is sufficient for close substitutability.
The clearest take-away from this large, pragmatic strand of research is that empirical, reduced-form approaches are unlikely to define housing submarkets in consistent ways. Instead of relying on the data to speak, economists will need a richer approach founded in qualitative, theoretical, and microdata research.
Future Research Directions
Economists still have much to learn about how the demand for housing decays across space. Although imperfect spatial substitutability is demonstrated by, or has implications for, many areas of research, no literature has confronted the problem directly.
Future research can build on this incomplete body of knowledge in several directions:
- Qualitative research into search processes, information sources, and segmentation—especially for rental markets—can improve the microfoundations of modeling efforts.
- Descriptive research from large real estate website and address-change databases could offer unparalleled evidence into individual search behaviors and, implicitly, preferences over space.
- Theoretical modeling can help bridge from individual preferences to market outcomes, identifying what conditions need to be met to achieve levels of market integration across space.
- Empirical research is needed in all dimensions. In particular, it would be helpful to generate stylized facts about what demographics, housing stock characteristics, and market conditions are likely to increase or decrease spatial substitutability.
Acknowledgments
The author thanks Hector Blanco, Leah Brooks, Andrew Crouch, Josh Ferdelman, Emily Hamilton, Eli Kahn, Desen Lin, Taylor Marr, Evan Mast, Andreas Mense, Fern Ramoutar, Daniel Ringo, Alex Tabarrok, Michael Wiebe, two anonymous reviewers, and participants in the DC Urban Economics Day.
References
Ahlfeldt, Gabriel M., Stephen J. Redding, Daniel M. Sturm, and Nikolaus Wolf. 2015. “The Economics of Density: Evidence from the Berlin Wall.” Econometrica 83 (6): 2127–89. https://doi.org/10.3982/ECTA10876.
Albouy, David, Gabriel Ehrlich, and Yingyi Liu. 2016. “Housing Demand, Cost-of-Living Inequality, and the Affordability Crisis.” Working Paper No. 22816, National Bureau of Economic Research.
Anenberg, Elliot, and Edward Kung. 2014. “Estimates of the Size and Source of Price Declines Due to Nearby Foreclosures.” American Economic Review 104 (8): 2527–51. https://doi.org/10.1257/aer.104.8.2527.
———. 2020. “Can More Housing Supply Solve the Affordability Crisis? Evidence from a Neighborhood Choice Model.” Regional Science and Urban Economics, Special Issue on Housing Affordability, 80 (January): 103363. https://doi.org/10.1016/j.regsciurbeco.2018.04.012.
Anenberg, Elliot, and Daniel Ringo. 2025. “Housing Market Congestion: The Effects of New For-Sale Supply on Home Prices and Sale Hazards.” Working paper.
Asquith, Brian J., Evan Mast, and Davin Reed. 2023. “Local Effects of Large New Apartment Buildings in Low-Income Areas.” The Review of Economics and Statistics 105 (2): 359–75. https://doi.org/10.1162/rest_a_01055.
Badarinza, Cristian, Vimal Balasubramaniam, and Tarun Ramadorai. 2024. “In Search of the Matching Function in the Housing Market.” Working paper.
Bartik, Timothy J. 1987. “The Estimation of Demand Parameters in Hedonic Price Models.” Journal of Political Economy 95 (1): 81–88. https://doi.org/10.1086/261442.
Baum-Snow, Nathaniel, and Gilles Duranton. 2025. “Housing Supply and Housing Affordability.” Working Paper No. 33694, National Bureau of Economic Research.
Baum-Snow, Nathaniel, and Lu Han. 2024. “The Microgeography of Housing Supply.” Journal of Political Economy 132 (6): 1897–1946.
Bayer, Patrick, Robert McMillan, Alvin Murphy, and Christopher Timmins. 2016. “A Dynamic Model of Demand for Houses and Neighborhoods.” Econometrica 84 (3): 893–942. https://doi.org/10.3982/ECTA10170.
Beenstock, Michael, Dan Feldman, and Daniel Felsenstein. 2020. “Identifying Local Housing Markets Through Revealed Preference.” Journal of Property Research 37 (2): 118–46. https://doi.org/10.1080/09599916.2020.1714698.
Bergman, Peter, Eric Chan, and Adam Kapor. 2020. “Housing Search Frictions: Evidence from Detailed Search Data and a Field Experiment.” Working Paper No. 27209, National Bureau of Economic Research.
Bhattacharjee, Arnab, Eduardo Castro, Taps Maiti, and João Marques. 2016. “Endogenous Spatial Regression and Delineation of Submarkets: A New Framework with Application to Housing Markets: Endogenous Spatial Regression and Delineation of Submarkets.” Journal of Applied Econometrics 31 (1): 32–57. https://doi.org/10.1002/jae.2478.
Blanco, Hector. 2023. “Pecuniary Effects of Public Housing Demolitions: Evidence from Chicago.” Regional Science and Urban Economics 98 (January): 103847. https://doi.org/10.1016/j.regsciurbeco.2022.103847.
Boeing, Geoff, Max Besbris, Ariela Schachter, and John Kuk. 2021. “Housing Search in the Age of Big Data: Smarter Cities or the Same Old Blind Spots?” Housing Policy Debate 31 (1): 112–26. https://doi.org/10.1080/10511482.20 19.1684336.
Boeing, Geoff, and Paul Waddell. 2017. “New Insights into Rental Housing Markets Across the United States: Web Scraping and Analyzing Craigslist Rental Listings.” Journal of Planning Education and Research 37 (4): 457–76. https://doi.org/10.1177/0739456X16664789.
Boschmann, E. Eric. 2011. “Job Access, Location Decision, and the Working Poor: A Qualitative Study in the Columbus, Ohio Metropolitan Area.” Geoforum 42 (6): 671–82. https://doi.org/10.1016/j.geoforum.2011.06.005.
Butts, Kyle. 2022. “Difference-in-Differences with Geocoded Microdata.” Journal of Urban Economics: Insights 133. https://doi.org/10.1016/j.jue.2022.103493.
Case, Bradford, John Clapp, Robin Dubin, and Mauricio Rodriguez. 2004. “Modeling Spatial and Temporal House Price Patterns: A Comparison of Four Models.” The Journal of Real Estate Finance and Economics 29 (2): 167–91. https://doi.org/10.1023/B:REAL.0000035309.60607.53.
Chen, Cynthia, and Haiyun Lin. 2012. “How Far Do People Search for Housing? Analyzing the Roles of Housing Supply, Intra-Household Dynamics, and the Use of Information Channels.” Housing Studies 27 (7): 898–914. https:// doi.org/10.1080/02673037.2012.725827.
Couture, Victor, Cecile Gaubert, Jessie Handbury, and Erik Hurst. 2023. “Income Growth and the Distributional Effects of Urban Spatial Sorting.” The Review of Economic Studies, April. https://doi.org/10.1093/restud/rdad048.
Damiano, Anthony, and Chris Frenier. 2020. “Build Baby Build? Housing Submarkets and the Effects of New Construction on Existing Rents.” Working paper, Center for Regional and Urban Affairs.
Davidoff, Thomas. 2015. “Supply Constraints Are Not Valid Instrumental Variables for Home Prices Because They Are Correlated with Many Demand Factors.” Critical Finance Review 5:177–206.
DeLuca, Stefanie, and Christine Jang-Trettien. 2020. “‘Not Just a Lateral Move’: Residential Decisions and the Reproduction of Urban Inequality.” City & Community 19 (3): 451–88. https://doi.org/10.1111/cico.12515.
DeLuca, Stefanie, Holly Wood, and Peter Rosenblatt. 2019. “Why Poor Families Move (And Where They Go): Reactive Mobility and Residential Decisions.” City & Community 18 (2): 556–93. https://doi.org/10.1111/cico.12386.
Diamond, Rebecca, and Tim McQuade. 2019. “Who Wants Affordable Housing in Their Backyard? An Equilibrium Analysis of Low Income Property Development.” Journal of Political Economy 127 (3): 1063–1117. https://doi. org/10.1086/701354.
Epple, Dennis. 1987. “Hedonic Prices and Implicit Markets: Estimating Demand and Supply Functions for Differentiated Products.” Journal of Political Economy 95 (1): 59–80. https://doi.org/10.1086/261441.
Ermisch, J. F., J. Findlay, and K. Gibb. 1996. “The Price Elasticity of Housing Demand in Britain: Issues of Sample Selection.” Journal of Housing Economics 5 (1): 64–86. https://doi.org/10.1006/jhec.1996.0004.
Farley, Reynolds. 1996. “Racial Differences in the Search for Housing: Do Whites and Blacks Use the Same Techniques to Find Housing?” Housing Policy Debate 7 (2): 367–85. https://doi.org/10.1080/10511482.1996.9521225.
Fischel, William A. 1980. “Zoning and the Exercise of Monopoly Power: A Reevaluation.” Journal of Urban Economics 8 (3): 283–93. https://doi. org/10.1016/0094-1190(80)90032-7.
Gargano, Antonio, Marco Giacoletti, and Elvis Jarnecic. 2023. “Local Experiences, Search and Spillovers in the Housing Market.” Journal of Finance 78 (2): 1015–1053. https://doi.org/10.1111/jofi.13208.
Glaeser, Edward L., and Bryce A. Ward. 2009. “The Causes and Consequences of Land Use Regulation: Evidence from Greater Boston.” Journal of Urban Economics 65 (3): 265–78. https://doi.org/10.1016/j.jue.2008.06.003.
Grigsby, William G. 1963. Housing Markets and Public Policy. University of Pennsylvania Press. https://doi.org/10.2307/j.ctv5rf5s1.
Hamilton, Bruce W. 1978. “Zoning and the Exercise of Monopoly Power.” Journal of Urban Economics 5 (1): 116–30. https://doi.org/10.1016/0094- 1190(78)90040-2.
Harvey, Hope, Kelley Fong, Kathryn Edin, and Stefanie DeLuca. 2020. “Forever Homes and Temporary Stops: Housing Search Logics and Residential Selection.” Social Forces 98 (4): 1498–1523. https://doi.org/10.1093/sf/ soz110.
Henderson, J. Vernon. 1991. “Optimal Regulation of Land Development Through Price and Fiscal Controls.” Journal of Urban Economics 30 (1): 64–82. https://doi.org/10.1016/0094-1190(91)90045-9.
Keskin, Berna, and Craig Watkins. 2017. “Defining Spatial Housing Submarkets: Exploring the Case for Expert Delineated Boundaries.” Urban Studies 54 (6): 1446–62. Urban Studies 54 (6): 1446–62.
Kroft, Kory, and Devin G. Pope. 2014. “Does Online Search Crowd Out Traditional Search? Evidence from Craigslist.” Journal of Labor Economics 32 (2): 259–303. https://doi.org/10.1086/673374.
Krysan, Maria. 2008. “Does Race Matter in the Search for Housing? An Exploratory Study of Search Strategies, Experiences, and Locations.” Social Science Research 37 (2): 581–603. https://doi.org/10.1016/j.ssresearch.2007.06.001.
Lee, Jinhyung, Nicholas Irwin, Elena Irwin, and Harvey J. Miller. 2021. “The Role of Distance-Dependent Versus Localized Amenities in Polarizing Urban Spatial Structure: A Spatio-Temporal Analysis of Residential Location Value in Columbus, Ohio, 2000–2015.” Geographical Analysis 53 (2): 283–306. https://doi.org/10.1111/gean.12238.
Li, Xiaodi. 2022. “Do New Housing Units in Your Backyard Raise Your Rents?” Journal of Economic Geography 22 (6): 1309–52. https://doi.org/10.1093/ jeg/lbab034.
Lin, Chuanhao. 2024. “Do Households Value Lower Density: Theory, Evidence, and Implications from Washington, DC.” Regional Science and Urban Economics 108: 104023.
Lin, Desen. 2020. “Housing Search and Rental Market Intermediation.” SSRN working paper. https://doi.org/10.2139/ssrn.3714128.
Lin, Desen, and Susan M. Wachter. 2020. “Land Use Regulation, Regulatory Spillover and Housing Prices.” SSRN Scholarly Paper. https://doi.org/10.2139/ ssrn.3363947.
MacLennan, Duncan, and Anthony O’Sullivan. 2012. “Housing Markets, Signals and Search.” Journal of Property Research 29 (4): 324–40. https://doi.org/ 10.1080/09599916.2012.717102.
Mast, Evan. 2025. “Off the Beaten Tract: Constructing a New Neighborhood Geography from Migration Data.” SSRN working paper. http://dx.doi. org/10.2139/ssrn.4857389.
Mense, Andreas. 2023. “Secondary Housing Supply.” LSE Department of Geography and Environment, Geography and Environment Discussion Paper Series, no. 40 (April): 1–59.
Newburger, Harriet. 1995. “Sources of Difference in Information Used by Black and White Housing Seekers: An Exploratory Analysis.” Urban Studies 32 (3): 445–70. https://doi.org/10.1080/00420989550012915.
Pennington, Kate. 2025. “Does Building New Housing Cause Displacement?: The Supply and Demand Effects of Construction in San Francisco.” Working paper.
Piazzesi, Monika, Martin Schneider, and Johannes Stroebel. 2020. “Segmented Housing Search.” American Economic Review 110 (3): 720–59. https://doi. org/10.1257/aer.20141772.
Pollmann, Michael. 2023. “Causal Inference for Spatial Treatments.” Working paper.
Pryce, Gwilym. 2013. “Housing Submarkets and the Lattice of Substitution.” Urban Studies 50 (13): 2682–99. https://doi.org/10.1177/0042098013482502.
Quigley, John M. 1985. “Consumer Choice of Dwelling, Neighborhood and Public Services.” Regional Science and Urban Economics 15 (1): 41–63. https://doi. org/10.1016/0166-0462(85)90031-6.
Quintero, Luis. 2023. “Fewer Players, Fewer Homes: Concentration and the New Dynamics of Housing Supply.” Working paper.
Rae, Alasdair, and Ebru Sener. 2016. “How Website Users Segment a City: The Geography of Housing Search in London.” Cities 52(March): 140–47. https://doi.org/10.1016/j.cities.2015.12.002.
Ramoutar, Fern. 2024. “Market Power in Residential Real Estate: Evidence from Chicago Rental Properties.” Working paper.
Rapkin, Chester, Louis Winnick, and David M. Blank. 1953. Housing Market Analysis. Housing and Home Finance Agency.
Raymond, Lindsey. 2025. “The Market Effects of Algorithms.” Working paper.
Rossini, Peter. 1998. “Assessing Buyer Search Behaviour for Residential House Purchasers in Adelaide.” Conference Paper presented at the Fourth Annual Pacific-Rim Real Estate Society Conference, Perth, Western Australia.
Rusk, David. 1993. Cities Without Suburbs. Woodrow Wilson Center Press.
Tomalty, Ray, and Alan Mallach. 2016. America’s Urban FutureFuture: Lessons from North of the Border. Island Press.
US Census Bureau. 2014. American Community Survey, 2010–2014 American Community Survey 5-Year Estimates. US Census Bureau. https://www.census.gov/programs-surveys/acs/data.html.
Watkins, Craig A. 2001. “The Definition and Identification of Housing Submarkets.” Environment and Planning A 33 (12): 2235–53. https://doi.org/10.1068/a34162.
White, Michelle J. 1975. “The Effect of Zoning on the Size of Metropolitan Areas,” Journal of Urban Economics 2 (4): 279–90. https://doi.org/10.1016/0094-1190(75)90029-7.
Yudhishthu, Zak. 2024. “Supply and Demand in My Backyard: How New Affordable Housing Affects Nearby Rental Prices.” Macalaster College Honors Thesis.
Zabek, Mike. 2024. “Local Ties in Spatial Equilibrium.” American Economic Journal: Macroeconomics 16 (2): 287–317.
Zabel, Jeffrey, and Maurice Dalton. 2011. “The Impact of Minimum Lot Size Regulations on House Prices in Eastern Massachusetts.” Regional Science and Urban Economics 41 (6): 571–83. https://doi.org/10.1016/j. regsciurbeco.2011.06.002.
Ziff, Anna. 2025. “Beyond the Local Impacts of Place-Based Policies: Spillovers Through Latent Housing Markets.” Working paper.
About the Author
Salim Furth is a senior research fellow and director of the Urbanity project at the Mercatus Center at George Mason University. His research focuses on housing production and land use regulation. He frequently advises local governments and testifies before state and federal legislatures. Furth earned his PhD in economics from the University of Rochester.
Notes
[1] Pollmann (2023) critiques this approach; Butts (2022) offers improvements.
[2] The median building is 14 units. Pennington (2025) reports that median rent of surrounding one-bedroom apartment listings is $1,891. The point estimates of the anticipatory effect sizes shown in her figure 6 appear to be between $30 and $50. Taking the low end of that range, the effect would be 1.5 percent. The area of a circle with a 1.25-km radius is 4.9 square kilometers.
[3] Another threat to identification is that builders can delay completion in response to price conditions. That would yield the opposite pattern of what Pennington observes.
[4] The area of a Manhattan street block is typically 80 × 274 meters.
[5] It is possible that high- and low-rent buildings could both experience a +6 percent amenity effect from nearby new construction while high-rent buildings (only) experience a –9 percent substitution effect. But in this context, it seems likely that added amenities would be tilted toward the new, higher-earning residents and might even crowd out amenities valued by low-income residents, as when a boutique replaces a bodega.
[6] Diamond and McQuade (2019) estimate the effect of LIHTC construction on nearby home prices. Their results—that LIHTC boosts home prices in cheap areas and lowers it in affluent areas—is consistent with (dis)amenity effects. But LIHTC renters are unlikely to be homebuyers, so Diamond and McQuade’s approach would be less likely to identify a local supply effect where one existed.
[7] The authors emphasize that the congestion effect over several surrounding miles is quantitatively important because it affects a much larger number of properties.
[8] Those discussing monopoly zoning power circa 1980 proposed that larger jurisdictions would zone more strictly to take advantage of their monopoly power by raising prices. But those who discuss zoning spillovers in the 2020s typically believe that small jurisdictions will be hesitant to loosen zoning because they are too small to generate affordability gains from expanded supply. The mechanism is the same. The presumed political goals have changed.
[9] In the Chicago market, building size is a proxy for quality. Larger buildings are usually newer and have better amenities.
[10] An exception would be the bargaining surplus in an existing landlord–tenant relationship, where some of the moving costs are incurred irrespective of distance.
[11] A typical Australian postcode contains 9,000 people, almost the same as a US ZIP code.
[12] The authors instrument for price growth with unavailable land, an instrument which Davidoff (2016) argues is invalid. They acknowledge the critique, but do not show that it is inapplicable to their context. Worse, the unavailability of land in one’s own postcode might especially be a motive for searching in other postcodes, which would violate the exclusion restriction.
[13] Piazzesi et al. (2022, 749) model buyers as occupants. They make no strong claims on this, noting instead that searcher characteristics are “a promising area for future work.”
[14] The Transportation Communities Explorer was a data compilation available from the US Department of Transportation during January 2025. The sources include American Community Survey data at the Census Tract level and travel times computed using proprietary routing software from Esri. The final data vintage remains available on the personal website of its creator: DW Rowlands Solutions, Equitable Transportation Communities Explorer, accessed December 1, 2025, https://dwrowlands.com/projects/etc-explorer/.
[15] Personal communication, May 2025.
[16] Ziff uses the districts she constructed to estimate the spillovers of spatially targeted tax incentives in Chicago. She finds that the tax breaks raise property values in the treatment area but decrease values in same-district blocks at least 400 meters away. Because the tax incentive is available for both residential and nonresidential development, it may be a shock to both local demand and supply. The results are most easily explained as a reallocation of demand from control to treated blocks.
[17] That is, households may act on convenient information because it is cheap and/or because it is salient.
[18] Baum-Snow and Han find the higher estimate when including municipal fixed effects (2024, 1939).
Suggested Citation
Salim Furth, “Substitutability in the Demand for Housing over Small Distances,” Mercatus Policy Research, Mercatus Center at George Mason University, February 2026.
Metadata
© 2026 by Salim Furth and the Mercatus Center at George Mason University
JEL codes: R21, R31, D83
Keywords: housing demand, spatial analysis, housing search, literature review
Disclaimer
The views expressed in Mercatus Policy Research are the authors’ and do not represent official positions of the Mercatus Center or George Mason University.

