- | Labor Markets Labor Markets
- | Working Papers Working Papers
- |
The Economic Importance of Flexible Income: Evidence from a Survey of App-Based Workers
What nearly 3,000 Instacart shoppers reveal about work, income, and public policy
Abstract: Using new data from a weighted survey of 2,705 active Instacart workers (referred to as “shoppers” throughout the study) linked to administrative records on platform engagement, earnings, and tenure, we examine how platform work fits into workers’ broader labor-market activity and employment preferences. We find that the vast majority of shoppers use Instacart for relatively few hours a week and as a supplemental source of income: 85.7 percent of shoppers average fewer than 10 active hours per week on the platform, and the median shopper averages 2.1 hours per week. For most workers, these earnings are layered onto broader portfolios of work and income, including traditional employment, self-employment, retirement income, and other household income sources, rather than serving as a stand-alone source of labor income. “Supplemental” describes Instacart’s place in workers’ broader income portfolios, not the importance of the earnings: Shoppers often use the income to support household budgets, manage irregular expenses, and maintain financial resilience.
The relevant alternative to Instacart is often not a regular-hours job but another flexible arrangement, especially for mothers, caregivers, and older workers, for whom standard job schedules may not readily accommodate feasible earning opportunities. For most shoppers, flexibility, autonomy, and control over when and how much to work appear central to why the arrangement fits; for a meaningful minority, Instacart appears to serve as a flexible bridge while they seek more stable jobs with predictable earnings and benefits. Taken together, these findings suggest that Instacart functions as a flexible adjustment margin: an earning opportunity that shoppers use only a few hours a week to supplement income around existing jobs, caregiving responsibilities, retirement transitions, and other constraints. The results highlight the importance of policy approaches that preserve flexible earning opportunities while improving security and stable employment pathways for workers who need them.
I. Introduction
Independent work—such as freelancing, app-based work, contracting, spot-markets, or other forms of solo self-employment—has grown over the past decades, drawing tens of millions of Americans into arrangements that sit outside the traditional employer-employee relationship.1This phenomenon has occurred along with substantial shifts in how people engage in work. With far lower barriers to entry and improved networks of buyers and sellers, the variety of people and experiences has grown as well.2The policy debates that have followed, however, have struggled to keep pace with the diversity of experiences within that workforce.3
One prominent segment of the independent workforce is those who engage in app-based platform work. A broad range of income-earning activities falls under this app-based umbrella, including grocery delivery, rideshare, food courier, crafts, handyman services, and online used and new goods sellers.4These activities are often characterized in shorthand as supplemental or casual, with workers picking up extra income around the edges of their primary source of employment. Yet the flexibility of these app-based platform work arrangements means that some can choose to treat these opportunities as a primary source of income as well.5This creates a wide distribution on the role of platform work from both the workers’ perspective and the policymakers’ perspective.
Two common views shape the policy debate. One treats platform work as a low-intensity supplemental activity that warrants limited policy attention. The other treats it as a structural substitute for traditional employment, often motivating proposals to reorganize app-based independent work into standard employee relationships.
To examine these competing interpretations, we conducted a weighted survey of 2,705 active Instacart shoppers and linked their responses to administrative records on platform engagement, earnings, and tenure. Our findings suggest that neither view fully captures the role platform work plays for many shoppers.
For most shoppers, the ability to earn income through a flexible, on-demand arrangement—on their own schedule, around caregiving obligations, alongside other jobs, or during periods of labor market transition—appears central to the work’s value. The vast majority of shoppers say Instacart allows them to work hours that a traditional job typically would not offer, suggesting that this type of scheduling flexibility does not have a straightforward equivalent in conventional employment. The administrative data reinforce this point: Instacart work is overwhelmingly low-hour, with 85.7 percent of shoppers averaging fewer than 10 active hours per week on the platform. But low hours do not imply that platform work is disconnected from the broader labor market. Most shoppers use Instacart alongside other sources of work and income, and among supplemental earners—shoppers who self-report Instacart as supplemental and average fewer than 10 active Instacart hours per week—67.0 percent currently hold a traditional job. Moreover, among supplemental earners who had a traditional job before joining Instacart, 77.6 percent still hold one today, suggesting that platform work more often layers onto existing employment than replaces it.
At the same time, the platform appears to serve different functions across workers. More than 7 in 10 shoppers say that if Instacart income disappeared, they would look for another gig or platform job, suggesting that many workers would seek to replace this kind of flexibility rather than take a traditional job as an employee. Mothers and caregivers report distinctive scheduling constraints that traditional jobs often do not accommodate, while older workers frequently use Instacart as a flexible source of supplemental income during retirement or retirement transitions. While most shoppers value the flexibility and autonomy associated with platform work, a meaningful minority appear to use Instacart as a bridge while seeking traditional jobs that offer greater stability, predictable earnings, and access to benefits.
Taken together, these patterns suggest that neither of the two common views fully captures the role of supplemental platform work. Instacart is “side income” in the sense that it is not the primary source of work income for many shoppers. But “side income” describes where the income sits relative to other earnings; it does not describe what the income does. The data suggest that, for many shoppers, Instacart functions as a flexible adjustment margin—a way to add earnings around existing jobs, caregiving responsibilities, retirement, income gaps, or other constraints that standard work arrangements may not accommodate.
Our findings raise important questions about policies that would substantially reduce the availability of flexible platform arrangements, including policies that would require this work to be reorganized into traditional employer-employee relationships. For most workers in the survey sample, standard employment does not appear to be a close substitute for the degree of flexibility and autonomy these arrangements provide. It is important to distinguish between the desire to improve access to valuable nonwage benefits associated with traditional employer-employee relationships and the reality of traditional work arrangements themselves.
Concurrently, a smaller share of workers appears financially exposed, using Instacart income as a primary financial lifeline during periods of limited employment or labor market transition. For these workers, the findings suggest that restricting the arrangement currently sustaining them may do little to address the underlying constraints they face. What this group may need is broader improvements in the labor market conditions that shape their options: workforce training and skills development, access to affordable childcare, and stronger local labor markets.
Three questions organize what follows. First, how meaningful is supplemental Instacart income to the households that earn it? Second, does Instacart appear to supplement, expand, or substitute for traditional employment? Third, how does the role of platform work vary across workers’ circumstances and needs?
II. Understanding Supplemental Platform Work
Question 1. How meaningful is supplemental platform income?
Within our analysis, and across the literature broadly, “supplemental” carries an assumption that is worth making explicit. It implies a relative positioning across income sources, even when the structure, demand, and return to work are potentially volatile from day to day and week to week. When working from the perspective of a more stable and scheduled traditional employment arrangement, the comparison across income sources is easier. In the context of an on-demand source of income, the term is less clear.
Most shoppers in our sample average fewer than 10 active hours per week. The natural inference is that the income from shopping is marginal, but the role an income stream plays in a budget does not depend on the number of hours behind it.
Supplying relatively few hours to an on-demand source of income does not necessarily mean that the income is unimportant. The financial environment surrounding many households has grown measurably more turbulent over the past several decades, with month-to-month and year-to-year earnings becoming more volatile.6The dispersion of household income has widened across the distribution, and a striking share of families reports that they could not cover a modest unexpected expense out of savings without borrowing or cutting back elsewhere.7When earnings arrive unevenly and liquid buffers are thin, a small but reliable and fast-access income stream can matter disproportionately to its dollar value, because its function is not to raise the standard of living so much as to smooth consumption.8
App-based platform work, which often offers an on-demand source of earnings through a hosted marketplace of buyers and sellers of goods and services, can offer a source of stabilizing income. Studies using bank account data show that platform income tends to rise when primary-job earnings fall,9and that access to it dampens the sensitivity of household spending to negative income shocks.10This finding suggests that flexible platform work can function as a form of consumption insurance, allowing workers to adjust labor supply when earnings from a primary job fall.
One study found that workers who turn to platform-based work were disproportionately likely to be carrying debt or absorbing a recent income shock.11 Simple metrics such as average platform hours or average earnings can fail to capture this important function of platform income: helping households stabilize spending when other income falls or becomes volatile.
Question 2. Does platform work expand or substitute for labor market participation?
Whether platform work expands labor supply or substitutes for more traditional work arrangements depends on what a shopper would be doing in the absence of the platform.
If the marginal shopper is someone who would otherwise hold a traditional job, then the platform substitutes across forms of work, and the effect on participation is largely compositional. If instead the marginal shopper is someone who would otherwise be out of the labor force, or working fewer hours than they would prefer because suitable jobs are unavailable, then the platform may expand both the number of people working (the extensive margin) and the hours worked by those already working (the intensive margin).
Platform work has the potential to expand participation because traditional work arrangements often rely on fixed schedules and blocks of hours. This rigidity can be costly and shape who is able to participate, particularly workers with preexisting constraints on when they can work. Temporal flexibility can therefore be a binding constraint on participation, especially for workers with caregiving responsibilities. Because caregiving responsibilities are disproportionately borne by women, this mechanism may be particularly relevant to women’s labor-market participation. Because observed labor supply is filtered through these scheduling constraints, it may understate the work that people would be willing to perform on schedules they can control. An arrangement that unbundles when and how much people work can draw in participation that rigid arrangements would prevent, increasing aggregate participation rather than simply substituting for other work.
Alternatively, the demand side for labor and the economic geography of opportunity can shape the option set faced by workers.12In settings where traditional jobs are scarce, poorly paid, or difficult to combine with workers’ other responsibilities, an app-based platform may function as an additional way to earn income or as a substitute for traditional jobs that are unavailable or unattractive.13This does not mean that platforms benefit from weak local labor markets or that workers prefer platform work in every respect. Rather, the role of platform work depends on the alternatives available to workers: It may expand labor-market participation for some while providing an alternative source of income for others who face scarce, poorly paid, or poorly fitting traditional jobs.
Question 3. What role does platform work play for different workers?
Given the rise of these nontraditional work arrangements in both number and social prevalence, what exactly do workers want from these sources of income? Generally, the literature has found that the core benefit of these work arrangements is flexibility. The value of flexibility has been at the center of a number of studies, often attempting to estimate the value app-based platform workers place on the flexibility offered.14This is generally done by estimating what workers would pay, or give up in wages, to obtain control over when and how much they work.
One of the key findings in this literature has been that the average valuation is modest, but the distribution of valuations is wide. One study has found that a minority of all workers are often willing to forgo a significant amount to ensure they have control over their schedules, while others place little weight on that flexibility.15
The question, then, is not whether workers value flexibility, but how much, which workers, and against what alternative.
The value of schedule control draws from two distinct literatures, one on the positive value of control, and the other on the negative effects of lacking that control. Workers may value the ability to decide when and how much they work on a given day. At the same time, workers may incur costs when they lack control over their schedules and face schedule instability.16Unpredictable employer-controlled scheduling—hours that shift on short notice and cannot be planned around—imposes documented costs on income stability, health, and family life.17The flexibility workers seek from an on-demand arrangement offers an alternative: control over their own time rather than exposure to someone else’s discretion.
What workers are willing to give up to obtain control over their schedule is the clearest signal of how much they want it, and that flexibility carries costs. Traditional labor markets attach a penalty to flexible or reduced hours, so that jobs permitting nonlinear schedules tend to pay less per hour. A meaningful share of the gender earnings gap reflects exactly this penalty as it widens around childbirth and career interruptions.18The size of that penalty depends on the structure of the specific occupation—on whether workers are close substitutes for one another or whether long, continuous hours carry a disproportionate return.19
Workers broadly value flexibility, but its importance—and what workers are willing to give up to obtain it—varies across workers and circumstances. A single legal status or benefits arrangement may need to serve workers who approach the platform with very different needs.20This is why understanding the characteristics of worker preferences across work arrangements is so important.
III. Data
Our data come from a survey of 2,705 active Instacart shoppers, which was fielded in February 2026 and linked to administrative records on platform hours, earnings, and tenure. The sample is more than double the size of comparable platform-worker surveys, including economist Jonathan Gruber’s survey of Uber drivers, and is restricted to shoppers who were active on the platform at the time of fielding.21This selection allows the analysis to focus on workers with recent and ongoing engagement rather than lapsed or occasional users. Echelon Insights programmed and administered the survey on behalf of the Mercatus Center. Instacart provided Echelon with the contact list of active shoppers and separately provided the coauthors with administrative records containing the respondent ID used to link survey responses to platform hours, earnings, and tenure.22The coauthors received no direct personal identifiers. Survey design, questionnaire development, analysis, interpretation, and conclusions were conducted independently by the coauthors.
For the main comparisons in this report, we use an earner classification that combines self-reported status with an administrative measure of platform work intensity—average active Instacart hours per week. This approach addresses a common challenge in survey research: self-reported work categories do not always align cleanly with observed work data.23 Indeed, some shoppers in our sample who described Instacart as their primary source of work income nonetheless averaged only a handful of active hours on the platform. Active hours refer to the time from accepting an order until delivering it to the customer. Supplemental earners are shoppers who self-report Instacart as supplemental and average fewer than 10 active Instacart hours per week. Primary earners are shoppers who self-report Instacart as primary and average more than 20 active Instacart hours per week. Workers in the middle range, or whose self-reported status and administrative hours do not align clearly, are classified as indeterminate and excluded from direct supplemental-versus-primary comparisons.24
IV. Demographic and Work Characteristics
This section establishes the demographic profile of Instacart shoppers, benchmarked against the US working population, and introduces the primary versus supplemental earner classification used throughout the report. It then examines the work and income profile of shoppers across three groups: all shoppers, supplemental earners, and primary earners.
4.1 Demographic profile
Table 1 presents the weighted demographic profile of the survey sample, benchmarked against US workers using the Current Population Survey, the CPS Annual Social and Economic Supplement (ASEC), and the American Community Survey.25Several features of the Instacart shopper population differ noticeably from the broader US workforce.
The demographic composition of our weighted survey sample is also broadly consistent with figures reported in Instacart’s 2025 Economic Impact Report.26That report similarly found that approximately 61 percent of shoppers are women and 50 percent are parents of children under age 18; it also reported a similar concentration of shoppers in the 25–54 age range. This consistency provides a useful cross-check and increases confidence that the survey sample reflects the broad demographic profile of Instacart shoppers.
Figure 1 shows that, compared with the broader US workforce, Instacart shoppers are disproportionately female, concentrated in prime working ages, and more likely to be parents. Women account for 61.5 percent of shoppers, compared with 47.1 percent of US workers. More than three-quarters of shoppers (77.5 percent) are ages 25–54, compared with 64.4 percent of the US employed workforce. Half of shoppers (50.0 percent) report children in the household, compared with approximately 39 percent of US households.
The educational profile skews toward vocational training and some postsecondary education. The largest share of shoppers (41.1 percent) report some college or an associate degree, and 23.2 percent hold a bachelor's degree or higher, compared with 44.9 percent of US workers age 25 and over.
The racial composition of Instacart shoppers also differs from the broader workforce. White shoppers represent 50 percent of the sample, compared with 76.3 percent of US workers. Black shoppers account for 27.5 percent of the sample, which is more than twice their 12.8 percent share of national employment. Hispanic shoppers represent 15.0 percent of shoppers.27
Most Instacart shoppers are insured (80.8 percent), though this remains below the national average of 89 percent for US workers.
Taken together, the demographic profile points toward a workforce navigating a distinct set of labor market conditions. Shoppers are disproportionately female, are racially diverse, have more postsecondary education than four-year-degree attainment, and are more likely than the typical US worker to be balancing caregiving alongside paid work. These characteristics shape how platform income functions in workers’ lives, which is a theme that runs through the sections that follow.
4.2 Work and income profile
Table 2 below presents the work and income profile of all shoppers alongside the supplemental and primary earner groups.
The vast majority of all shoppers (83.1 percent) reported at least one source of income other than Instacart. Only 16.9 percent of all shoppers identified Instacart as their sole reported income source. Among this group, most lived in households where another person also contributed income—typically a spouse, partner, or other family member who was the primary income contributor. A smaller group—221 respondents—either lived alone and supported themselves or reported contributing the most income in a multiple-person household.28
Among shoppers classified as either supplemental or primary using the combined self-reported status and administrative-hours criteria, supplemental earners account for 93.6 percent and primary earners for 6.4 percent (see figure 2 above). Workers whose reported status and administrative hours do not align clearly are excluded from this comparison.
The contrast between the two groups is substantial, as figure 3 illustrates. Among supplemental earners, 67.0 percent currently hold a traditional job outside Instacart, 48.8 percent work 31 or more hours per week at their other jobs, and only 8.5 percent are unemployed apart from their Instacart work. These workers are, by most conventional measures, layering Instacart onto an existing employment base. Primary earners look markedly different. Only 10.2 percent currently hold a traditional job, while 31.4 percent report app-based, freelance, informal, or own-business work and 25.7 percent are unemployed.
Most classified shoppers are supplemental earners, but the smaller primary-earner group differs in ways that illustrate the range of circumstances in which shoppers use the platform. Supplemental earners look like workers adding a flexible income stream to an existing employment base, while primary earners look more like workers using Instacart during periods of weaker attachment to traditional employment or greater reliance on app-based work.
The administrative data also show a sharp difference in actual platform engagement across earner types. The typical supplemental earner averages only about 1.4 active Instacart hours per week, while the typical primary earner averages about 26.2 hours.
Across the full sample, platform engagement is heavily concentrated among low-hour users, as shown in figure 4. In the full sample, 85.7 percent of all shoppers average fewer than 10 active Instacart hours per week, 11.8 percent fall between 10 and under 25 hours, and only 2.5 percent average 25 or more hours.
This distribution underscores a central finding of the report: For most shoppers, Instacart represents regular but limited platform engagement rather than a full-time work commitment. Low administrative hours and substantial attachment to other work should be read together. For most shoppers, low Instacart hours do not indicate weak labor market attachment; rather, they are consistent with Instacart serving as a flexible margin layered around other jobs, income sources, and household responsibilities. Low hours, however, should not be interpreted as low importance. As the next section shows, even supplemental earnings can play a meaningful role in household budgets.
V. Supplemental Income
The central question in this section is not simply whether Instacart income is primary or supplemental, but what function the income performs. A low-hour supplemental income stream may still matter if it helps workers smooth expenses, build a financial cushion, or add earnings in time blocks that other jobs do not accommodate.
5.1 Why do supplemental earners turn to Instacart?
Among supplemental earners, multiple motivations coexist, as shown in figure 5. Asked why they became Instacart shoppers, 66.3 percent cited extra spending money, 52.2 percent cited covering basic household or general expenses, 33.7 percent cited covering irregular income gaps, and 33.1 percent cited flexibility or schedule control. Smaller shares cited saving for future goals or emergencies (23.5 percent) or insufficient hours in a primary job (13.3 percent).29
Supplemental income serves multiple purposes for shoppers. The most commonly cited reason for becoming an Instacart shopper is to earn extra spending money, but financial-support and income-smoothing motivations are also widespread: 66.7 percent of supplemental earners selected at least one reason related to covering basic expenses, smoothing irregular income, or making up for insufficient hours elsewhere.30The fact that the same low-hour arrangement serves different functions for different workers is itself a finding: ‘Supplemental’ describes Instacart’s role relative to other work, not the importance of the income to household budgets.
5.2 How important is supplemental income to household budgets?
Figure 6 shows that for many supplemental earners, Instacart income appears to play a meaningful role in household finances. Just over half of supplemental earners, 51.9 percent, say losing Instacart income would make it at least somewhat difficult to cover expenses. This includes 30.0 percent who say losing the income would make it somewhat difficult, 15.0 percent who say it would be very difficult, and 6.8 percent who say they could not cover expenses without it. By contrast, 34.0 percent say they would miss the income but could manage without it, and 14.1 percent say they could easily get by without it.
The reported uses of Instacart income reinforce this picture, as shown in figure 7. The most common use is food, selected by 51.0 percent of supplemental earners. 31Other frequently reported uses include debt payments, 31.7 percent; transportation, 31.4 percent; housing, rent, mortgage, or utilities, 30.5 percent; the overall household budget, 23.1 percent; and emergency funds, 22.9 percent. Entertainment and recreation, by contrast, is reported by 21.1 percent.
A useful additional analysis examines respondents who selected exactly one use of Instacart income in Q19. Among the 44.5 percent of supplemental earners who selected only one item, the most common response was “no specific use—it goes into the overall household budget,” selected by 51.8 percent of single-use respondents. Food was the next most common single-use response, at 11.3 percent, followed by housing at 8.6 percent and debt payments at 8.1 percent. The dominance of the overall-household-budget response is itself informative: When respondents identify only one use, they most often describe Instacart income as integrated into household finances rather than earmarked for a single discretionary purchase.
To impose more structure on the select-all-that-apply responses, we organize reported uses of Instacart income into broad categories drawing on the major expenditure components used in the Bureau of Labor Statistics’ Consumer Expenditure Surveys.32Among supplemental earners, 64.0 percent report using Instacart income for at least one core expense, including food, housing, transportation, health expenses, or childcare and education. Another 47.0 percent report using the income for financial resilience, including debt payments, savings or investments, or emergency fund contributions. By comparison, just 21.1 percent report using Instacart income for entertainment or recreation. An additional 23.1 percent say the income has no specific use but goes into the overall household budget, a response that may itself indicate that Instacart earnings are integrated into ordinary household finances rather than treated as separate discretionary income.33
If Instacart income were no longer available, most supplemental earners say they would seek another flexible income source, as shown in figure 8. Nearly three-quarters, 73.4 percent, report that they would look for another gig or platform job. At the same time, many would also make household budget adjustments: 32.6 percent would cut back on nonessential spending; 24.8 percent would cut back on food or other basic necessities; 17.1 percent would delay or skip debt payments; 16.9 percent would fall behind on rent, mortgage, or utilities; 11.9 percent would rely more on credit cards, loans, or borrowing; and 8.5 percent would seek government or community assistance.
Reported financial impact is also consistent with expected behavioral responses. Supplemental earners who say losing Instacart income would be very difficult or impossible to manage are far more likely to report that they would delay debt payments, fall behind on housing or utilities, borrow money, or seek assistance. This internal consistency strengthens the interpretation that, for a meaningful subset of supplemental earners, Instacart income plays an important role in household financial stability.
Although the analysis above focuses on supplemental earners, we also examined several outcomes for all shoppers. Among all shoppers, 63.6 percent say losing Instacart income would make it at least somewhat difficult to cover expenses, including 36.8 percent who say it would be very difficult or that they could not cover expenses and 26.8 percent who say it would be somewhat difficult. Similarly, 67.0 percent report using Instacart income for at least one core household expense. Food is the most common use, at 54.1 percent, followed by housing at 37.4 percent, transportation at 34.9 percent, and debt payments at 34.3 percent.
We also examined whether these patterns differed by household income and family circumstances. Lower-income supplemental earners appear somewhat more financially exposed: 59.5 percent say losing Instacart income would make it at least somewhat difficult to cover expenses, compared with 51.9 percent of supplemental earners overall; parents and caregivers show a smaller difference, at 54.6 percent. These subgroup results are descriptive and broadly reinforce the main findings; full results are reported in appendix table A1.
The subgroup results reinforce a broader theme that recurs throughout the report: Instacart serves different functions for different shoppers. For some, the income primarily supports household budgets; for others, its value is closely tied to the ability to earn around existing responsibilities and constraints. These functions can coexist, especially for shoppers who rely on both the income and the flexibility.
VI. Labor Market Dynamics
This section examines Instacart work as a labor market phenomenon: how it fits within workers’ broader employment histories, what alternatives workers perceive, and what role the platform plays in enabling additional labor force participation.
6.1 Work portfolios and labor market trajectories
Across the full survey sample, Instacart fits into a broad portfolio of work arrangements rather than a single employment model. Most shoppers combine Instacart with traditional wage employment; others layer it onto app-based, freelance, informal, or self-employment work; and some use it during periods of unemployment, caregiving, retirement, or labor market transition. Table 3 summarizes these work and income portfolio measures for all shoppers and supplemental earners.
More than half of all shoppers currently hold a traditional job, nearly half report wage or salary income outside Instacart, and about three in ten report income from independent contracting, app-based work, business income, or self-employment. Another 18 percent report income from other sources (e.g., investments, retirements, Social Security or disability benefits). Only 16.9 percent report Instacart as their only income source. When wage/salary income and other self-employment or independent work are grouped together, 65.9 percent of all shoppers report some work income outside Instacart, as shown in figure 9.
This layering pattern is especially clear among supplemental earners, as shown in figure 10. Among this group, 67.0 percent currently hold a traditional job, 48.8 percent work 31 or more hours per week at other jobs, and 63.3 percent report wage or salary income outside Instacart.34When wage/salary income and other self-employment or independent work are grouped together, 80.4 percent of supplemental earners report some work income outside Instacart. Only 5.5 percent report Instacart as their only income source. Taken together, these patterns suggest that for many supplemental earners, Instacart functions as one component of a broader income portfolio rather than as a stand-alone source of labor income.
The before-and-after employment data point in the same direction. Across all shoppers, 68.6 percent had a full-time or part-time traditional job before joining Instacart.35Separately, 17.1 percent reported doing app-based gig work, while 26.7 percent reported at least one form of app-based, freelance, informal, or self-employment work. The latter is a broader composite that includes the app-based gig-work category. Smaller shares were previously stay-at-home parents or caregivers (6.5 percent) or unemployed and looking for work (8.2 percent). Because the question allowed multiple selections, these categories are not mutually exclusive.
Figure 11 shows that, among all shoppers who had a traditional job before joining Instacart, 62.7 percent still report holding a traditional job today. The continuation of traditional employment is even stronger among supplemental earners: Among those who had a traditional job before joining Instacart, 77.6 percent still hold one today. These before-and-after patterns shift the interpretation from job replacement to layering. If most supplemental earners who had traditional jobs before joining Instacart still hold traditional jobs today, then Instacart is better understood for this group as an added labor-supply margin rather than as a direct substitute for standard employment.
Shoppers’ stated reasons for joining Instacart reinforce the same point. Among all shoppers who cite financial-need motivations, 74.2 percent had a traditional job before joining Instacart and 68.2 percent currently hold one. Among those who cite flexibility or schedule control, 73.1 percent had a traditional job before Instacart and 60.3 percent currently hold one. These patterns suggest that financial need and flexibility are not simply markers of labor market detachment. Many shoppers are already working, but they use Instacart to adjust around income needs, hours constraints, or scheduling incompatibilities in existing jobs.
Altogether, Instacart appears to serve as a flexible adjustment margin within a broader labor market portfolio, especially for supplemental earners. For these workers, the relevant question is often not whether Instacart replaces traditional employment, but how it complements and expands existing sources of work and income.
6.2 Labor market participation, gender, and parenthood
The relationship between Instacart work and labor market participation also varies by gender and parenthood. Mothers in the sample do not appear to have substantially weaker connections to the labor market than shoppers overall. Rather, their distinctive constraint concerns the fit between available jobs and their schedules. Women with children are far more likely than other shoppers to report caregiving-related barriers to traditional job schedules and to say they would only seek replacement work if it offered Instacart-like flexibility. Full gender-by-parenthood labor market profiles are reported in appendix table A2.
Women with children were much more likely than other groups to report being stay-at-home parents or caregivers before joining Instacart, as shown in figure 12. Among all shoppers, 13.3 percent of women with children reported this pre-Instacart status, compared with 3.2 percent of women without children, 5.2 percent of men with children, and 0.8 percent of men without children.
This pattern supports the interpretation that a meaningful subset of mothers and caregivers views Instacart as a labor market expansion. For these workers, the relevant counterfactual may not be a traditional job with a less flexible schedule. It may be fewer hours of paid work, more difficulty sustaining paid work, or no additional earnings at all. This is why the labor-market role of Instacart differs across groups: For many shoppers it supplements existing employment, but for some mothers and caregivers it may expand the set of feasible earning opportunities.
The caregiving constraint appears even more clearly in the follow-up questions. Among shoppers who do not currently hold a traditional job, 44.6 percent of women with children say family, school, or health circumstances make traditional jobs difficult. That is roughly double the share among women without children, 21.1 percent, and men with children, 23.5 percent, and more than triple the share among men without children, 13.8 percent.
A similar pattern appears among shoppers who say Instacart allows them to work hours that traditional jobs typically would not offer. In that group, 56.2 percent of women with children cite family responsibilities as the reason they cannot work those same hours in a traditional job, compared with 36.8 percent of men with children, 16.4 percent of men without children, and 13.7 percent of women without children, as figure 13 shows.
These patterns suggest that flexibility is not merely a preference layered on top of labor market attachment. For some parents, especially mothers, flexibility is a condition of participation, as shown in figure 14. This interpretation is also consistent with replacement-job preferences: Women with children are the group most likely to say that, if Instacart were unavailable, they would look for another job only if it offered the same flexibility as Instacart (53.5 percent), compared with 46.5 percent of women without children, 46.4 percent of men with children, and 42.9 percent of men without children.
Many mothers in this sample are already participating in the labor market, often while balancing multiple forms of work and caregiving responsibilities. The evidence suggests that flexibility in when and how work is performed is especially important for this group. For many mothers, flexible platform work appears to make paid work possible in ways that standard job schedules often do not accommodate.
6.3 Perceived job availability and replacement alternatives
Before joining Instacart, many shoppers perceived meaningful limits in their local labor markets. Among all shoppers, 28.8 percent reported that full-time or steady part-time jobs were limited in their area, and 12.6 percent reported that jobs were very limited, for a combined 41.4 percent who perceived constrained job availability. Only 15.2 percent described jobs as plentiful, while 9.1 percent said they were already employed or not looking.
Figure 15 shows that perceived job constraints were especially high among shoppers who entered Instacart from outside traditional employment. Among shoppers who did not have a traditional job before joining Instacart, 54.1 percent said jobs were limited or very limited, compared with 35.6 percent among those who previously held a traditional job. Perceived job scarcity was even higher among shoppers who had previously been unemployed and looking for work, 68.9 percent, and among those who had previously been stay-at-home parents or caregivers, 54.8 percent. These patterns suggest that weak local labor markets were part of the entry story for a meaningful subset of shoppers, particularly those entering from outside standard employment.
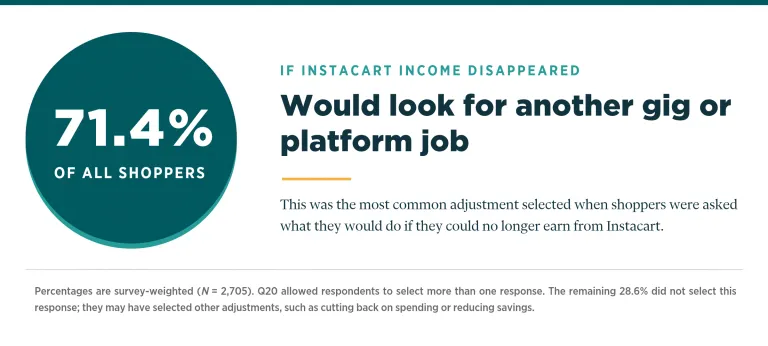
If shoppers could no longer earn income from Instacart, 71.4 percent said they would look for another gig or platform job. This was the most commonly reported response, although respondents could select multiple options, including cutting spending, reducing savings, or borrowing. The finding suggests that many shoppers would seek to replace Instacart with another flexible work arrangement.
At the same time, perceived job scarcity does not fully explain the broader appeal of Instacart. As figure 16 shows, across all shoppers, 48.0 percent say that if Instacart were unavailable, they would look for another job only if it offered the same flexibility as Instacart, compared with 39.1 percent who say they would look for a traditional job with regular hours. Another 12.9 percent say they would not seek additional work. Taken together, a majority of shoppers either require Instacart-like flexibility or would not seek additional work at all.
The same pattern is even stronger among supplemental earners. In that group, 50.5 percent say they would seek another job only if it offered the same flexibility as Instacart, compared with 35.0 percent who would seek a traditional regular-hours job. Another 14.5 percent say they would not seek additional work. For many supplemental earners, then, the relevant counterfactual is not standard regular-hours employment. It is often another flexible arrangement—and for some workers, no additional work at all. This distinction matters for policy interpretation: If workers would replace Instacart only with work that offers comparable scheduling control, then policies that reduce access to flexible platform work may not shift workers into traditional employment. It also helps explain why low-hour platform work can still be highly valued: Its value lies not only in the income earned, but in the specific type of earning opportunity it provides.
Among shoppers who do not currently hold a traditional job, the reasons for nontraditional employment are mixed. Some appear to prefer flexible gig work, some are actively looking for traditional employment, and others cite family, school, health, pay, hours, or qualification barriers.
As a whole, these findings suggest that shopping with Instacart should not be understood simply as a fallback for workers unable to find traditional jobs. Job availability matters, especially for shoppers entering from outside traditional employment. But for many shoppers, the more relevant distinction is between work arrangements that allow flexible scheduling and those that do not.
Among shoppers who do not currently hold a traditional job, Q13 asked why not; the results are shown in figure 17. Some workers appear oriented toward traditional employment: 31.3 percent say they are actively looking for a traditional job. Others cite constraints that make traditional jobs difficult: 27.0 percent cite family, school, or health circumstances. Nearly half—47.6 percent—selected at least one response indicating a preference for flexibility or satisfaction with their current arrangement: 37.5 percent say they prefer the flexibility of gig work, while 16.9 percent say they are satisfied with their current arrangement or not interested in traditional employment. Because the question allowed multiple responses, these categories overlap.
This heterogeneity is important. The nontraditional-work population includes workers who are actively seeking traditional employment, workers constrained by family or health circumstances that make traditional employment difficult, workers dissatisfied with pay or hours in traditional jobs, and workers who genuinely prefer the autonomy of flexible work.
6.4 Age heterogeneity: Flexibility salience and life-stage functions
Instacart also appears to serve different labor market functions at different life stages. One of the clearest age gradients is flexibility salience, measured by the share of workers who say that, if Instacart were unavailable, they would look for another job only if it offered the same flexibility as Instacart. Figure 18 shows that this share rises steadily with age: 35.0 percent among workers ages 18–24, 44.5 percent among ages 25–34, 50.2 percent among ages 35–44, 57.3 percent among ages 45–54, 57.4 percent among ages 55–64, and 63.8 percent among ages 65 and older.
The age pattern suggests that flexibility becomes more important as workers age. Younger shoppers are more likely to treat Instacart as one option among many possible jobs. Older shoppers, especially those approaching or past retirement age, appear more likely to value work that can be scaled around other income sources, health needs, family obligations, or retirement transitions.
Other labor market measures point in the same direction. Current traditional employment falls from 51.9 percent among shoppers ages 18–24 to 20.5 percent among shoppers ages 65 and older (see figure 19). Among the 65-and-over group, 55.0 percent currently report being retired, and 40.3 percent report having been retired before joining Instacart. This response is consistent with a bridge-employment interpretation: For some older workers, platform work may provide a flexible earned-income supplement rather than a conventional job replacement.
These results should be interpreted cautiously given the small size of the oldest age group. But the overall pattern is consistent: As workers age, scheduling flexibility becomes increasingly central to why Instacart fits their circumstances.
6.5 Worker preferences over classification status
Shoppers often find themselves in a position where they balance preferences regarding flexibility, autonomy, predictable income, job stability, and benefits. Bundled across these preferences are both norms and regulations related to work status classification. “Preferences over classification” is one way to assess the characteristics that Instacart shoppers value. Across our sample, we found that a majority of Instacart shoppers who expressed a clear preference preferred independent contractor status.36
Preferences over classification tended to align with what we might expect. The strongest independent contractor preference appears among shoppers who both value the flexibility Instacart provides and do not identify conventional employment as their preferred alternative. Nearly 80 percent of this group preferred independent-contractor status.37Current work situations show a similar pattern: Retired shoppers had the highest share preferring independent-contractor status, while shoppers who were unemployed and looking for work had the lowest.38 Employee preference was also more common among shoppers who were actively looking for a traditional job or those reporting constrained employment alternatives.39These employee-preferring shoppers represent an important but smaller subgroup; most shoppers who expressed a clear preference favored independent-contractor status.
Taken together, these patterns suggest that, for many employee-preferring shoppers, Instacart may function less as a preferred long-term arrangement and more as a bridge while they seek more standard employment opportunities.
Collectively, the classification results are better interpreted as signaling broader work-arrangement preferences rather than preferences over legal status explicitly. For many contractor-preferring shoppers, Instacart is a good option because it can be layered around existing jobs, other platforms, or personal responsibilities. For employee-preferring shoppers, by contrast, Instacart appears to function more as a bridge while they seek work with attributes they value more: greater stability, predictable earnings, job security, and benefits.
6.6 Summary of labor market dynamics
Taken together, the labor market evidence suggests that Instacart functions as a flexible adjustment margin rather than a simple substitute for traditional employment. For many shoppers, the platform layers onto existing jobs and other income sources. For others—especially workers facing caregiving, school, health, retirement, or scheduling constraints—Instacart appears to make additional labor force participation possible under conditions that traditional jobs may not accommodate.
One policy implication is that the relevant counterfactual varies across workers. For most shoppers, the alternative to Instacart may be another gig job. For others, especially mothers with caregiving constraints and older workers seeking flexible bridge employment, the alternative may be less work or no additional earnings at all.
VII. Implications for Policy Design
Instacart work is typically limited in hours and supplemental in its role within workers’ broader income portfolios, but it is economically significant for most shoppers. For many workers surveyed, Instacart provides income that can be layered onto existing employment, caregiving, retirement, and other obligations. The platform is therefore best understood as a flexible adjustment margin: It often supplements existing employment but can also expand feasible labor-market participation for workers facing caregiving, health, school, retirement, or scheduling constraints.
Because Instacart functions for most shoppers as low-hour, flexible supplemental work, policy should be evaluated in part by whether it expands or contracts workers’ feasible earning opportunities. The goal should be to preserve access, flexibility, and scheduling control while addressing any concrete risks through targeted measures.
7.1 Limited platform engagement and supplemental work can still be economically meaningful
“Supplemental” should not be equated with “unimportant.” Among supplemental earners, 51.9 percent say losing Instacart income would make it at least somewhat difficult to cover expenses, and 64.0 percent use the income for at least one core expense, including food, housing, transportation, health expenses, or childcare and education. The most common reasons they became shoppers were to earn extra spending money (66.3 percent) and cover basic or general expenses (52.2 percent).
These findings suggest that low-hour platform work can be an important source of household income even when it is not a worker’s primary source of earnings. Policies that reduce access to flexible supplemental earning opportunities may therefore have real consequences for household budgets, especially for lower-income workers, caregivers, and others with constrained schedules.
7.2 Flexibility is part of the economic function of the work
Flexibility is not merely a preference for convenience; for most shoppers, it is what makes work feasible. Supplemental earners use Instacart around full-time and part-time jobs, caregiving responsibilities, school schedules, health constraints, and retirement transitions. Parents of young children and older workers stand out as groups for whom standard job schedules may be a poor fit.
Among all shoppers, 87.4 percent say Instacart allows them to work hours that a traditional job typically would not. Moreover, 60.9 percent say that, if Instacart were unavailable, they would either look for another job only if it offered comparable flexibility (48.0 percent) or not seek additional work (12.9 percent). In a separate question, 71.4 percent of all shoppers said they would look for another gig platform job if they could no longer earn income from Instacart.40 These questions therefore measure different aspects of the counterfactual and should not be presented as if they offered the same response options.
For most shoppers, then, the relevant alternative may be another flexible arrangement—or for some, no replacement work at all. A decline in available orders or in the number of shoppers able to participate should not automatically be interpreted as workers finding equivalent earnings opportunities in traditional jobs. If the effects of regulations reduce the availability of platform work, some workers may be unable to replace the lost income with traditional jobs that accommodate their schedules. This is especially relevant for mothers and caregivers, older workers, and others for whom flexibility is a condition of labor-market participation.
Policies governing platform work can affect more than pay per task or active hour. They also affect the number of orders available, how many shoppers can access work, whether work is available at preferred times, and whether workers can combine platform work with other jobs or platforms. Higher pay per task or compensated hour does not necessarily translate into higher total income if a policy reduces available orders, limits participation, restricts low-hour engagement, or makes it harder to work at preferred times.
New York City provides an important illustration of this tradeoff. Following implementation of the city’s original restaurant-delivery minimum-pay regime, the city’s official data show that average hourly earnings increased, while total worker hours fell 38 percent, on-call hours fell 72 percent, average hours per worker fell 21 percent, and the number of workers performing trips fell 21 percent.41Deliveries increased by only 5 percent. These figures are descriptive, come from restaurant-delivery apps rather than Instacart specifically, and may reflect other changes; they do not establish that the regulation caused the observed changes. They nevertheless illustrate a mechanism relevant to this study: Higher pay and utilization among continuing workers may coincide with less access to intermittent or low-hour supplemental work across the broader pool of workers.
This tradeoff is especially relevant for the shoppers in this study, approximately 93.6 percent of whom are supplemental earners. Across the sample, 85.7 percent average fewer than 10 Instacart hours per week, and the median shopper averages 2.1 hours per week. Although many work relatively few hours on the platform, 87.4 percent say Instacart allows them to work hours that a traditional job typically would not offer, and 60.9 percent say they would either require comparable flexibility or would not seek additional work if Instacart were unavailable. For these workers, reduced access to platform work may therefore represent the loss of a flexible source of supplemental income that cannot easily be replaced by conventional employment.
Moreover, NYC’s current framework goes beyond setting a minimum payment for completed deliveries. It specifies which time is compensable and how platforms must calculate pay, including requirements related to trip time, on-call time, alternative payment methods, and utilization.42These additional requirements may address legitimate concerns, but they can also increase compensation and compliance costs and constrain platforms’ ability to adjust matching, scheduling, log-in access, and order allocation—potentially reducing access to intermittent or low-hour work.
While the NYC before-and-after figures were descriptive, a working paper using structural-break tests on the city’s published quarterly data finds the same general pattern—higher realized pay alongside a contraction in on-call hours and reduced active workforce, using a different comparison window.43Separately, a published difference-in-differences study using Chicago as a comparison city finds that the regulation reduced ride-hailing trip volume and increased ride-hailing fares in New York, consistent with drivers reallocating labor toward delivery work in response to the pay standard. This study provides more direct evidence of a behavioral response, although it concerns cross-platform labor reallocation rather than delivery-worker participation itself.44
Evidence from Seattle provides a comparison with a more direct causal design. A difference-in-differences study of Seattle’s 2024 task-level pay standard found that increases in base pay per task were partially offset by a substantial reduction in average tips, which were a major component of delivery pay.45Among highly attached incumbent drivers, the policy also led to fewer tasks completed per month, fully offsetting the increase in pay per task and producing no long-run increase in monthly earnings. Drivers experienced more unpaid idle time and longer distances driven between tasks, and the study found no evidence of meaningful gains in earnings, leisure, or work-related costs for this group.
The authors of the Seattle study interpret the evidence as consistent with a mechanism in which relatively open entry allowed higher pay per task to attract or retain more labor than the available volume of delivery work could absorb. The resulting competition for tasks increased waiting, reduced utilization, and lowered the number of tasks available to incumbent drivers. The study found no increase in exit from delivery work, suggesting that the adjustment occurred through task scarcity and unpaid idle time rather than workers immediately leaving the market. The estimates are strongest for highly attached incumbent drivers; less-attached workers experienced small and statistically insignificant changes in monthly earnings, but relatively few remained active, making those estimates less precise.
The Seattle and NYC findings also provide a useful contrast with a platform-led intervention that reports more favorable results in a different institutional setting. A natural-experiment study of Lyft in Los Angeles examined a platform-led weekly earnings guarantee combined with greater trip-level pay transparency. The intervention increased driver earnings, hours, utilization, and completed trips. The contrast suggests that design choices may affect whether higher compensation is accompanied by task scarcity and reduced access or by greater engagement and utilization.46
Taken together, the NYC, Seattle, and Lyft evidence, while not directly comparable, suggests that policymakers should evaluate delivery-work regulations along both the intensive margin—pay per task, hourly earnings, and utilization—and the extensive margin—who can participate, how many tasks and hours are available, and whether workers retain the ability to use the platform intermittently. Higher pay for workers who remain active may coexist with reduced access for others. The relevant policy outcome is therefore not only the compensation attached to a completed task, but also the broader set of earning opportunities available to workers. Policies that improve one margin—such as pay per task or compensated hour—while reducing another—such as available work or scheduling flexibility—do not necessarily make the majority of platform workers better off.
7.4 Workers have diverse needs
The central policy question is how to improve security for platform workers while preserving the flexibility and access that make the arrangement valuable to many shoppers. Classification is central to this debate because moving workers from independent-contractor status into a conventional employee relationship may expand access to employer-provided benefits and protections, but it may also change the flexible, intermittent work arrangements on which many shoppers rely.
Most shoppers (80.8 percent) already report having health insurance or other health coverage, obtained through a range of sources. This finding does not mean that benefits are irrelevant. Rather, it suggests that shoppers differ in the forms of security they already have and the benefits they value. Some may place greater value on health coverage, while others may prioritize cash earnings, flexibility, predictable income, retirement savings, paid leave, training, or advancement opportunities. Because Instacart work is often supplemental and involves relatively limited platform hours, these needs differ from those of workers whose primary employment relationship is a full-time employee job.
This diversity is consistent with evidence from Gruber’s survey showing that Uber workers vary substantially in their existing coverage and the benefits they value. Workers who already receive health insurance through a family member or another job may have less need for employer-provided health insurance and place greater value on other forms of compensation or flexibility. A policy that assumes all workers need the same benefits—or that reclassification is the necessary route to security—may impose the costs of a more traditional employment relationship without addressing the concerns that matter most to individual workers.
The policy challenge is therefore to expand workers’ options and address concrete risks without eliminating the flexible arrangements on which many currently rely. Additionally, reclassification of workers from contractors to employees should not be treated as synonymous with greater benefits access. Traditional benefits are often tied to full-time work, tenure, and a single employer—conditions that do not describe most shoppers in this sample. A legal change in classification may therefore impose the costs of a more traditional employment relationship without ensuring that low-hour workers receive the full benefits associated with that model. Indeed, descriptive evidence from a statewide reclassification attempt found a reduction of contracting opportunities without a subsequent increase in traditional jobs for affected occupations.47
7.5 Key takeaway
Overall, the findings suggest a policy mix that preserves access to flexible platform work while expanding workers’ opportunities across the broader labor market. Platform-specific policies should address concrete risks without reducing access to the flexible earning opportunities on which many shoppers rely. Broader workforce policies should draw on existing evidence about which interventions expand employment opportunities, increase earnings, and improve pathways to stable work in the broader labor market. The objective should be to expand and improve workers’ labor-market opportunities without narrowing the range of work arrangements available to them or undermining flexible earning opportunities.
VIII. Conclusion
The evidence in this study complicates simple narratives about platform work. Instacart shoppers are overwhelmingly supplemental earners: Most work relatively few hours on the platform, 67.0 percent of supplemental earners hold a traditional job, and 48.8 percent work at least 31 hours per week at other jobs. Yet supplemental does not mean insignificant. For many households, Instacart income helps pay for necessities such as food, housing, transportation, debt, savings, emergencies, and the general household budget. More than half of supplemental earners say losing Instacart income would make it at least somewhat difficult to cover expenses.
The labor-market evidence sharpens this interpretation. Instacart is not simply a substitute for traditional employment. For many shoppers, it is a flexible adjustment margin that fits around existing jobs, caregiving responsibilities, school, health needs, retirement transitions, or local labor-market constraints. If supplemental earners could no longer earn income from Instacart, 73.4 percent say they would look for another gig or platform job. This suggests that many workers value not only the income Instacart provides, but also the particular flexibility and scheduling control associated with the arrangement.
For some groups, especially mothers and older workers, flexible platform work may make additional labor-force participation possible under conditions that standard job schedules do not accommodate. For others, Instacart serves as a bridge while they seek more stable employment, predictable earnings, or access to benefits. These differences underscore that platform work serves multiple functions across workers and households.
These differences have important implications for policy. A sound policy mix should preserve access to flexible platform work while expanding workers’ opportunities across the broader labor market. Platform-specific policies should address concrete risks without narrowing the flexible earning opportunities on which many shoppers rely, while broader workforce policies should draw on existing evidence about which interventions expand employment, increase earnings, and improve pathways to stable work. Because many shoppers cannot readily replace platform work with conventional employment, policies should be evaluated not only by their effects on pay, but also by whether they preserve access to feasible earning opportunities. The objective should be to expand and improve workers’ opportunities without imposing a single, one-size-fits-all work arrangement or undermining the flexible earning opportunities that many workers depend on.
Appendix A. Survey Methodology
A.1 Survey design and sample
The survey was fielded from February 2 through February 12, 2026. Echelon Insights programmed and administered the survey on behalf of the Mercatus Center at George Mason University. Instacart provided Echelon with the contact list of active shoppers and separately provided the research team with administrative records containing the respondent ID used to link survey responses to platform hours, earnings, and tenure. The coauthors independently designed the study and questionnaire, conducted the analysis, and determined the interpretation and conclusions.
The sample consists of 2,705 active Instacart shoppers recruited through the platform. Active shoppers were defined using recent platform activity during the sampling window. Respondents received a $5 Amazon gift card upon completion, and the survey took approximately 8–10 minutes to complete.
Survey responses were linked to platform administrative records using a respondent ID. The research team received de-identified survey responses and administrative records linked through that respondent ID. The research team did not receive shopper names, email addresses, phone numbers, or other direct personal identifiers. Pearl IRB determined the study to be exempt human-subjects research under 45 C.F.R. § 46.104(d)(2)(i) on November 19, 2025 (IRB ID 2025-0676).
A.2 Weighting and analytic sample
Survey responses were weighted to match known demographic and platform-engagement characteristics of the active Instacart shopper population. The respondent-level weight is used for percentage estimates throughout the paper unless otherwise noted. The weights sum to the analytic sample size of 2,705 respondents.
Several questions allow respondents to select more than one answer. For these questions, each percentage is the weighted share selecting the specified response, and categories do not sum to 100 percent.
A.3 Administrative measures
Instacart provided administrative measures of platform engagement for the shoppers included in the survey. These measures include average weekly batches, average weekly P2P3 hours, platform tenure, weeks since last activity, lifetime batches, and total administrative earnings over the aligned observation period.
P2P3 hours measure the time from batch acceptance to delivery. The paper refers to this measure as active Instacart hours.
The primary work-intensity categories for all shoppers are fewer than 10 hours per week, 10 to fewer than 25 hours per week, and 25 or more hours per week. Administrative earnings are measured over the aligned three-month observation period; when monthly earnings are reported, total earnings over that period are divided by three.
A.4 Earner classification
The paper’s primary comparisons use a classification that combines respondents’ self-reported role for Instacart with administrative platform hours.
- Supplemental earners: Respondents who identify Instacart as a supplemental source of work income and average fewer than 10 active Instacart hours per week, as measured in administrative records.
- Primary earners: Respondents who identify Instacart as a primary source of work income and average more than 20 active Instacart hours per week, as measured in administrative records.
- Indeterminate earners: All other respondents, including those averaging between 10 and 20 active Instacart hours per week and those whose self-reported role does not align clearly with their administrative hours.
The classification produces 1,487 supplemental earners, 101 primary earners, and 1,117 indeterminate earners. Among the 1,588 shoppers whose self-reported role and administrative hours align clearly, 93.6 percent are supplemental earners and 6.4 percent are primary earners. The classification is intended to distinguish clearly limited platform engagement from sustained high-intensity engagement; it does not imply that supplemental workers are financially unaffected by Instacart income.
A.5 Derived measures
Traditional employment includes respondents who report full-time or part-time employment at a traditional job. Current work-arrangement measures are based on Q11, which asks respondents about their situation apart from shopping with Instacart. Nontraditional work includes other app-based gig work, freelance or independent contracting, informal work, and running a business. Q11 is select-all-that-apply, so these categories can overlap.
The lower-income supplemental-earner measure uses total household income reported in ranges and household size. Each income range is assigned its midpoint. Household size is approximated as the number of adults plus children across the reported child-age groups; top-coded household-size responses use the lower-bound value. Respondents are classified as lower income if imputed annual household income is below 200 percent of the federal poverty guideline for its household size. This measure is approximate because both income and household size are reported categorically.
For analyses of reported uses of Instacart income, core expenses include housing, transportation, food, health expenses, and childcare or education. Financial resilience includes debt payments, savings or investments, and emergency-fund contributions. Entertainment or recreation is reported separately. These categories are constructed groupings of select-all-that-apply responses and are not mutually exclusive.
For analyses of why supplemental earners became shoppers, financial-need motivations include covering basic household expenses, covering irregular income gaps, and making up for insufficient hours in another job. Financial-cushion motivations include extra spending money and saving for future goals or emergencies. Flexibility or schedule control is reported separately. These motivation groupings can overlap.
For classification-preference analyses, the survey asks whether respondents would rather shop with Instacart as an employee or an independent contractor, with “Not sure / Indifferent” as a third response. The main cross-tabulations focus on respondents expressing a clear preference. Questions asking why respondents prefer employee or contractor status are descriptive follow-up questions asked only of respondents who selected the corresponding status.
A.6 Subgroup heterogeneity: Lower-income households and parents
Among supplemental earners, the role of Instacart income varies by household income and family circumstances, as shown in table A1. Two groups are especially important to distinguish: lower-income households, defined here using a household income measure adjusted for household size relative to the federal poverty guidelines,48and parents or caregivers.
Lower-income supplemental earners show the clearest signs of elevated financial reliance on their Instacart work. Among all supplemental earners, 51.9 percent say losing Instacart income would make it at least somewhat difficult to cover expenses; among lower-income supplemental earners, that share rises to 59.5 percent. Lower-income supplemental earners are also somewhat more likely to say losing the income would be very difficult or make them unable to cover expenses—27.7 percent, compared with 21.8 percent overall. Their reported uses of Instacart income point in the same direction: 68.4 percent use the income for core expenses, while only 16.6 percent report using it for entertainment or recreation.
Parents and caregivers show a more modest but still consistent pattern. They are slightly more likely than supplemental earners overall to report financial vulnerability if Instacart income disappeared, 54.6 percent compared with 51.9 percent, and more likely to use the income for core expenses, 68.0 percent compared with 64.0 percent. They are also somewhat more likely to cite flexibility or schedule control as a reason for joining Instacart, 35.4 percent compared with 33.1 percent overall. For this group, the more distinctive parenthood pattern is not financial vulnerability alone, but the way caregiving responsibilities interact with the need for flexible work.
A.7 Gender-by-parenthood labor-market profile
Table A2 reports the full gender-by-parenthood labor-market profile referenced in the paper. Women and men are shown separately by whether children are present in the household. The table is descriptive and survey-weighted.
A.8 Limitations
The survey is cross-sectional. The analysis describes associations among shopper characteristics, platform engagement, financial reliance, and preferences; it does not estimate causal effects.
Many survey questions are select-all-that-apply, and categories can overlap. Income questions are reported in ranges, so midpoint-coded income and poverty-adjusted measures are approximate. Survey weights adjust the respondent sample to match known characteristics of the active shopper population but cannot eliminate all possible sources of nonresponse or measurement error.
Appendix B. Survey Instrument
The instrument below reproduces the respondent-facing question wording and response options used in the survey. The recruitment invitation, internal variable names, and programming tags are omitted. Skip conditions and exclusive-response instructions are retained where they affect who was asked a question or how responses were coded. Response options that were randomized in the field instrument are presented in a fixed order here.
Section A. Background
Q1. In what year were you born? (Single response)
- Year of birth (dropdown)
Q2. What is your gender? (Single response)
- Male
- Female
- Gender not listed here, please specify
- Prefer not to say
Q3. What is your race or ethnicity? (Select all that apply)
- White
- Black or African American
- American Indian or Alaskan Native
- Asian
- Hawaiian or Pacific Islander
- Hispanic or Latino (of any race)
- Two or more races
- Prefer not to say (exclusive)
Q4. What is the highest level of school completed or the highest degree received? (Single response)
- Less than high school
- Some high school, no diploma
- High school graduate (or GED)
- Some college, no degree
- Associate degree (2-year)
- Bachelor’s degree (4-year, e.g., BA, BS)
- Some graduate school, no degree
- Graduate or professional degree (e.g., MA, PhD, JD, MD)
Q5. How many adults (aged 18 and older) are in your household, including yourself? (Single response)
- 1
- 2
- 3
- 4
- 5
- 6 or more
Q6. How many children in your household are in each age group?
- Under 6 years old: 0, 1, 2, 3, 4, or 5+
- 6–12 years old: 0, 1, 2, 3, 4, or 5+
- 13–17 years old: 0, 1, 2, 3, 4, or 5+
Q7. Do you currently have health insurance or health coverage through any of the following? (Select all that apply)
- Insurance through a current or former employer or union (this could be from your own employer or union or from a family member)
- Insurance purchased directly from an insurance company (purchased by yourself or another family member)
- Medicare, for people 65 and older or people with certain disabilities
- Medicaid, Medical Assistance, or any kind of government-assistance plan for those with low incomes or a disability
- TRICARE or other military healthcare
- VA (enrolled for VA healthcare)
- Indian Health Service
- Any other type of health insurance or health coverage plan
- Not insured (exclusive)
Q8. During the last 12 months, did money go into any retirement savings plans for you? (Select all that apply)
- 401(k), 403(b), or similar employer plan
- Traditional pension plan (defined benefit)
- Individual Retirement Account (IRA)
- Self-employed retirement plan (SEP-IRA, SIMPLE, Keogh)
- None of the above—I did not participate in any retirement plan in the last 12 months (exclusive)
Section B. Work and hours
Q9. At present, which of the following are sources of income for you—not including Instacart? (Select all that apply)
- Salary or wages from a full-time or part-time regular job
- Income from independent contracting or app-based work (other than Instacart)
- Income from a business venture or self-employment (entrepreneurial or small business)
- Income from investments, rental property, or royalties (interest, dividends, rent, trusts)
- Income from retirement accounts, pensions, or annuities
- Income from Social Security, veterans’ benefits, or disability benefits
- Income from public assistance or government transfer programs (e.g., unemployment, welfare, SNAP)
- Other miscellaneous income (e.g., child support, alimony, gifts, or other)
- None of the above—Instacart is my only income source (exclusive)
- Prefer not to say (exclusive)
Q10. Thinking about all your work-related income right now, is Instacart currently your: (Single response)
- Primary source of work income (your main job or business—where you usually earn the most money or spend the most hours)
- Supplemental source of work income (a side job, gig, or business that adds extra income)
Q10b. Why did you become an Instacart shopper? (Select all that apply)
Asked only if the respondent selected “Supplemental” in Q10.
- To earn extra spending money
- To cover basic household or general expenses
- To cover irregular income gaps (when hours or pay fluctuate in my main job)
- Because my primary job does not give me enough hours
- For flexibility or schedule control
- To save for future goals or for emergencies
- Other (please specify)
Definition shown to respondents: In the remaining questions, “traditional job” means work for an employer where you are a payrolled employee (part-time or full-time), receive a regular paycheck, and may have set hours or benefits (for example, working at a store, restaurant, office, or company).
Q11. Apart from shopping with Instacart, which of the following also describes your current situation? (Select all that apply)
- I have full-time employment at a traditional job
- I have part-time employment at a traditional job
- I do other app-based gig work (rideshare or delivery)
- I do freelance or independent contracting work
- I do informal work (one-off jobs, helping neighbors, or paid in cash)
- I run my own business
- I’m a student
- I’m a caregiver
- I’m unemployed and looking for work
- I’m unemployed and not currently looking for other work
- I’m retired
- None of the above (exclusive)
Q12. How many hours per week do you usually work at your other jobs, not including Instacart? (Single response)
- Fewer than 5 hours
- 5–10 hours
- 11–20 hours
- 21–30 hours
- 31–40 hours
- More than 40 hours
- I do not have other jobs besides Instacart
Q13. Which of the following describe your current work situation or reasons for not having a traditional job? (Select all that apply)
Asked only if the respondent did not select full-time or part-time traditional employment in Q11.
- I’m actively looking for a traditional job
- I prefer the flexibility to pick and choose my hours through app-based gig work
- The traditional jobs I’ve found do not pay enough
- The traditional jobs I’ve found do not offer enough hours
- Family, school, or health circumstances make traditional jobs difficult
- I do not have the qualifications or experience for the jobs I want
- I’m satisfied with my current arrangement or not interested in traditional employment
- Other (please specify)
Section C. Earnings
Q14. How much do you earn from all other jobs or work, not including Instacart, in a typical month, before taxes? (Single response)
- Less than $500
- $500–$999
- $1,000–$1,499
- $1,500–$1,999
- $2,000–$2,999
- $3,000–$3,999
- $4,000–$4,999
- $5,000–$6,999
- $7,000 or more
Q15. How much do you earn from Instacart in a typical month, before expenses? (Single response)
- Less than $200
- $200–$499
- $500–$999
- $1,000–$1,499
- $1,500–$1,999
- $2,000–$2,999
- $3,000–$3,999
- $4,000–$4,999
- $5,000 or more
Q16. Who contributes most of the income in your household? (Single response)
- I live in a multiple-person household and contribute the most income
- My spouse or partner contributes the most income
- My spouse or partner and I contribute about equally
- Another family member contributes the most income
- I live alone and support myself
Q17. What was your total household income in the past 12 months from all sources, including Instacart, before taxes? (Single response)
- Less than $15,000
- $15,000–$24,999
- $25,000–$39,999
- $40,000–$54,999
- $55,000–$74,999
- $75,000–$99,999
- $100,000–$124,999
- $125,000–$149,999
- $150,000 or more
Q18. How would losing your Instacart income affect your overall financial situation? (Single response)
- I could easily get by without this income
- I would miss this income but could manage without it
- Losing this income would make it somewhat difficult to cover my expenses
- Losing this income would make it very difficult to cover my expenses
- I could not cover my expenses without this income
Q19. When you earn money from Instacart, what do you use it for? (Select all that apply)
- Housing (rent, mortgage, or utilities)
- Transportation
- Food
- Health expenses
- Entertainment or recreation
- Savings or investments
- Childcare or education
- Debt payments (credit cards or loans)
- Emergency fund for unexpected expenses
- No specific use—it goes into the overall household budget (exclusive)
- Other (please specify)
Q20. If you suddenly could not earn from Instacart anymore, what changes would you most likely have to make? (Select all that apply)
- Look for another gig or platform job
- Cut back on nonessential spending (entertainment, dining out, or recreation)
- Reduce savings or stop contributing to an emergency fund or retirement
- Delay or skip debt payments
- Fall behind on rent, mortgage, or utility bills
- Cut back on food or other basic necessities
- Reduce spending on childcare or education
- Rely more on credit cards, loans, or borrowing from others
- Seek government assistance or community aid
- Other (please specify)
Section D. Work preferences
Definition shown to respondents: In the remaining questions, “traditional job” means work for an employer where you are a payrolled employee (part-time or full-time), receive a regular paycheck, and may have set hours or benefits (for example, working at a store, restaurant, office, or company).
Q21. Which of the following describes your situation before you started working with Instacart? (Select all that apply)
- I had full-time employment at a traditional job
- I had part-time employment at a traditional job
- I did other app-based gig work (rideshare or delivery)
- I did other freelance or independent contracting work
- I did informal work (one-off jobs, helping neighbors, or paid in cash)
- I ran my own business
- I was a student
- I was a stay-at-home parent or caregiver
- I was unemployed and looking for work
- I was retired
- None of the above (exclusive)
Q22. Before you started working with Instacart, how available were full-time or steady part-time jobs in your area? (Single response)
- Plentiful
- Somewhat available
- Limited
- Very limited—almost no available jobs
- Already employed or not looking
Q23. Does working with Instacart allow you to work hours that a traditional job typically would not offer? (Single response)
- Yes
- No
Q23b. What prevents you from working those same hours at a traditional job? (Select all that apply)"
Asked only if the respondent answered “Yes” in Q23.
- Traditional jobs have fixed schedules that do not work for me
- Traditional jobs do not offer evening or weekend hours
- Family responsibilities (childcare needs or family emergencies)
- Another job or school with conflicting hours
- Need to work very short or irregular shifts
- Health issues require flexible timing
- Other (please specify)
Q24. If Instacart were not available, would you try to find another job? (Single response)
- Yes, a traditional job with regular hours (full-time or part-time)
- Yes, but only if it offered the same flexibility as Instacart
- No, I would reduce spending or rely on savings instead of working more
- No, I would not look for other work
Q25. Given a choice, would you rather shop with Instacart as an employee or as an independent contractor? (Single response)
Respondents were shown the following descriptions before answering Q25:
Employee: Typically has an employment contract with one company. Employees are paid a regular wage or salary and may receive benefits such as health insurance, paid time off, or retirement contributions. Taxes are usually withheld from their pay. Employees generally have a set work schedule and work under the direction and standards set by their employer.
Independent contractor: Typically offers services directly to clients or companies and may work with one or several companies or clients at a time. Independent contractors are paid per job, task, or project rather than through a regular wage or salary. They handle their own taxes and benefits, set their own work schedule, and decide which jobs or deliveries to take.
- Employee
- Independent contractor
- Not sure or indifferent
Q25b. Why would you prefer to shop with Instacart as an employee? (Select all that apply)
Asked only if the respondent selected “Employee” in Q25.
- To receive benefits such as health insurance, paid leave, or retirement contributions
- To have predictable and stable wages or salary
- To have predictable hours or a schedule set by an employer
- To have tasks and performance expectations defined by an employer
- To have greater job security or ongoing employment rather than gig-by-gig work
- To have opportunities for training, advancement, or promotion within an employer’s structure
- Other (please specify)
Q25c. Why would you prefer to shop with Instacart as an independent contractor rather than as an employee? (Select all that apply)
Asked only if the respondent selected “Independent contractor” in Q25.
- I like being able to choose when and how much I work
- I want to be able to work for multiple platforms or companies at the same time
- I am already an employee at my existing job and do not need another regular job
- I have other commitments or personal circumstances that make a traditional job difficult
- I prefer to work independently rather than report to a supervisor
- I can earn more based on performance or effort
- I prefer flexibility and independence over benefits or job stability
- Other (please specify)
End of instrument
Notes
[1] Lawrence F. Katz and Alan B. Krueger, “The Rise and Nature of Alternative Work Arrangements in the United States, 1995–2015,” ILR Review 72, no. 2 (2019): 382–416; Katharine G. Abraham et al., “Measuring the Gig Economy: Current Knowledge and Open Issues” (NBER working paper no. 24950, National Bureau of Economic Research, August 2018); Andrew Garin, Emmet Jackson, and Dmitri K. Koustas, “Is Gig Work Changing the Labor Market? Key Lessons from Tax Data,” National Tax Journal 75, no. 4 (2022).
[2] Jane Dokko, Megan Mumford, and Diane Whitmore Schanzenbach, “Workers and the Online Gig Economy” (Hamilton Project Discussion Paper, Brookings Institution, December 2015).
[3] Seth D. Harris and Alan B. Krueger, “A Proposal for Modernizing Labor Laws for Twenty-First-Century Work: The ‘Independent Worker’” (Hamilton Project Discussion Paper 2015-10, Brookings Institution, December 2015).
[4] Dokko et al., “Workers and the Online Gig Economy”; Katharine G. Abraham et al., “Measuring the Gig Economy: Current Knowledge and Open Issues,” in Measuring and Accounting for Innovation in the 21st Century (University of Chicago Press, 2019).
[5] Jonathan V. Hall and Alan B. Krueger, “An Analysis of the Labor Market for Uber’s Driver-Partners in the United States,” ILR Review 71, no. 3 (2018): 705–32.
[6] Peter Gottschalk and Robert Moffitt, “The Growth of Earnings Instability in the US Labor Market,” Brookings Papers on Economic Activity 1994, no. 2 (1994): 217–72; Karen Dynan, Douglas Elmendorf, and Daniel Sichel, “The Evolution of Household Income Volatility,” B.E. Journal of Economic Analysis & Policy 12, no. 2 (2012); Bradley Hardy and James Ziliak, “Decomposing Trends in Income Volatility: The ‘Wild Ride’ at the Top and Bottom,” Economic Inquiry 52, no. 1 (2014): 459–76.
[7] Board of Governors of the Federal Reserve System, Report on the Economic Well-Being of US Households in 2024, 2025; Pew Charitable Trusts, The Precarious State of Family Balance Sheets, 2015.
[8] Diana Farrell and Fiona Greig, Weathering Volatility: Big Data on the Financial Ups and Downs of US Individual Income (JPMorgan Chase Institute, 2015); Diana Farrell and Fiona Greig, Paychecks, Paydays, and the Online Platform Economy: Big Data on Income Volatility (JPMorgan Chase Institute, 2016).
[9] Dmitri K. Koustas, “Consumption Insurance and Multiple Jobs: Evidence from Rideshare Driving” (working paper, 2018).
[10] Koustas, “Consumption Insurance and Multiple Jobs: Evidence from Rideshare Driving”; Farrell and Greig, Paychecks, Paydays, and the Online Platform Economy: Big Data on Income Volatility.
[11] Koustas, “Consumption Insurance and Multiple Jobs.”
[12] Raj Chetty et al., “Where Is the Land of Opportunity? The Geography of Intergenerational Mobility in the United States,” Quarterly Journal of Economics 129, no. 4 (2014): 1553–623; Raj Chetty and Nathaniel Hendren, “The Impacts of Neighborhoods on Intergenerational Mobility I: Childhood Exposure Effects,” Quarterly Journal of Economics 133, no. 3 (2018): 1107–62.
[13] Danny Yagan, “Employment Hysteresis from the Great Recession,” Journal of Political Economy 127, no. 5 (2019): 2505–58; David H. Autor, David Dorn, and Gordon H. Hanson, “The China Syndrome: Local Labor Market Effects of Import Competition in the United States,” American Economic Review 103, no. 6 (2013): 2121–68.
[14] M. Keith Chen et al., “The Value of Flexible Work: Evidence from Uber Drivers,” Journal of Political Economy 127, no. 6 (2019): 2735–94.
[15] Alexandre Mas and Amanda Pallais, “Valuing Alternative Work Arrangements,” American Economic Review 107, no. 12 (2017): 3722–59; Matthew Wiswall and Basit Zafar, “Preference for the Workplace, Investment in Human Capital, and Gender,” Quarterly Journal of Economics 133, no. 1 (2018): 457–507; Chen et al., “The Value of Flexible Work: Evidence from Uber Drivers.”
[16] Julia R. Henly and Susan J. Lambert, “Unpredictable Work Timing in Retail Jobs: Implications for Employee Work–Life Conflict,” ILR Review 67, no. 3 (2014): 986–1016; Susan J. Lambert, Peter J. Fugiel, and Julia R. Henly, “Precarious Work Schedules Among Early-Career Employees in the US” (EINetwork White Paper, University of Chicago, 2014).
[17] Daniel Schneider and Kristen Harknett, “Consequences of Routine Work-Schedule Instability for Worker Health and Well-Being,” American Sociological Review 84, no. 1 (2019): 82–114; Lambert et al., “Precarious Work Schedules Among Early-Career Employees in the US.”
[18] Claudia Goldin and Lawrence F. Katz, “The Cost of Workplace Flexibility for High-Powered Professionals,” ANNALS of the American Academy of Political and Social Science 638 (2011): 45–67; Marianne Bertrand, Claudia Goldin, and Lawrence F. Katz, “Dynamics of the Gender Gap for Young Professionals in the Financial and Corporate Sectors,” American Economic Journal: Applied Economics 2, no. 3 (2010): 228–55.
[19] Patricia Cortés and Jessica Pan, “When Time Binds: Substitutes to Household Production, Returns to Working Long Hours, and the Gender Wage Gap Among the Highly Skilled,” Journal of Labor Economics 37, no. 2 (2019): 351–98; Claudia Goldin and Lawrence F. Katz, “The Most Egalitarian of All Professions: Pharmacy and the Evolution of a Family-Friendly Occupation,” Journal of Labor Economics 34, no. 3 (2016): 705–46.
[20] Harris and Krueger, “A Proposal for Modernizing Labor Laws for Twenty-First-Century Work: The ‘Independent Worker.’”
[21] Jonathan Gruber, “Designing Benefits for Platform Workers” (NBER working paper no. 29736, National Bureau of Economic Research, February 2022).
[22] Pearl IRB determined the study to be exempt human-subjects research under 45 C.F.R. § 46.104(d)(2)(i), “Tests, Surveys, Interviews,” on November 19, 2025. The IRB ID is 2025-0676.
[23] Katharine G. Abraham et al., “Measuring the Gig Economy: Current Knowledge and Open Issues,” in Measuring and Accounting for Innovation in the 21st Century (University of Chicago Press, 2019).
[24] Among all 2,705 shoppers in the sample, 55.0 percent are classified as supplemental earners and 3.7 percent as primary earners. The remaining 41.3 percent fall outside the classification thresholds and are excluded from earner-type comparisons throughout the report. This methodology is unpacked further in the appendix.
[25]US Bureau of Labor Statistics, “2024 Annual Averages—Household Data—Tables from Employment and Earnings,” tables 2, 3, and 7, February 20, 2026, https://www.bls.gov/cps/cps_aa2024.htm; US Census Bureau, “Health Insurance Coverage in the United States: 2024,” September 2025, https://www.census.gov/library/publications/2025/demo/p60-288.html; US Census Bureau, “S1101: Households and Families,” 2024 American Community Survey, 1-Year Estimates Subject Tables, https://data.census.gov/table/ACSST1Y2024.S1101.
[26] Instacart, Instacart Economic Impact Report 2025, 2025, https://company.instacart.com/static/pdfs/2025-instacart-economic-impac….
[27] Race and ethnicity categories are based on a select-all-that-apply survey question and therefore do not sum to 100 percent.
[28] Among those who lived alone and supported themselves, approximately half either were unemployed and looking for work or identified themselves as students, caregivers, or retired.
[29] Question 10b is a select-all-that-apply question; respondents could report multiple motivations for becoming Instacart shoppers, so percentages do not sum to 100 percent.
[30] Financial-need motivations include selecting at least one of the following Q10b responses: covering basic household or general expenses, covering irregular income gaps, or making up for insufficient hours in a primary job. Because Q10b is select-all-that-apply, this measure identifies respondents selecting any of these reasons rather than summing across responses.
[31] Categories are not mutually exclusive because Q19 allows respondents to select all uses that apply. “Overall household budget” is reported separately because it does not map cleanly onto a single spending category.
[32] US Bureau of Labor Statistics, “Consumer Expenditure Surveys,” accessed October 21, 2026, https://www.bls.gov/cex/. The Consumer Expenditure consists of two surveys, the Interview Survey and the Diary Survey. We draw on the major expenditure categories in BLS’s published tables.
[33] Our categories draw on the major expenditure components in the BLS Consumer Expenditure Surveys (such as food, housing, transportation, healthcare, education, and entertainment). Grouping them as “core expenses” is our own addition. The financial resilience category (e.g., covering debt payments, savings or investments, and emergency fund contributions) is also our own grouping, as the BLS Consumer Expenditure Survey framework does not include a direct equivalent for forward-looking financial management uses.
[34] The 67.0 percent measure comes from a question asking whether respondents currently hold a traditional job, while the 63.3 percent measure comes from a separate question asking respondents to identify their current sources of income outside Instacart. Because these questions measure employment status and reported income sources, respectively, the responses need not align exactly.
[35] The 68.6 percent figure represents respondents who selected at least one traditional-job category. Full-time and part-time traditional employment were selected by 53.1 percent and 18.0 percent, respectively. Because the question allowed multiple selections, these categories overlap and do not sum to the combined 68.6 percent figure.
[36] We find that among Instacart shoppers who express a preference, excluding those who are unsure or indifferent, 59.5 percent prefer independent-contractor status and 40.5 percent prefer employee status. Among all shoppers, including those who are unsure or indifferent, 45.9 percent of shoppers prefer independent contractor status, 31.2 percent prefer employee status, and 23.0 percent are unsure or indifferent.
[37]Among shoppers who said they were satisfied with their current arrangement or were not interested in traditional employment and who also said Instacart allows them to work hours that a traditional job typically would not offer, 78.1 percent of those with a clear preference favored independent-contractor status.
[38]In Q11, retired shoppers had the highest share favoring independent-contractor status, at 78.0 percent, while shoppers who were unemployed and looking for work had the lowest, at 47.3 percent. These Q11 categories are select-all-that-apply and therefore are not mutually exclusive. Among shoppers who had previously done app-based gig work, done freelance or independent contracting, run their own business, or been retired before joining Instacart, 67.8 percent favored independent-contractor status.
[39] Among shoppers not currently in traditional employment, employee-preferring shoppers were more likely to report actively looking for a traditional job than contractor-preferring shoppers—41.8 percent compared with 25.4 percent. Employee-preferring shoppers were also somewhat more likely to report constrained employment alternatives: 42.6 percent said full-time or steady part-time jobs were limited or very limited before they joined Instacart. They were also more likely to have limited work outside Instacart: 48.8 percent either had no other jobs besides Instacart or worked 20 or fewer hours per week at other jobs.
[40]This question was select-all-that apply and also included adjustments such as cutting spending, reducing savings, delaying debt payments, or borrowing.
[41] New York City Department of Consumer and Worker Protection, “Restaurant Delivery App Data: October–December 2024,” accessed October 21, 2026, https://www.nyc.gov/assets/dca/downloads/pdf/workers/Restaurant-Deliver….
[42] New York City Department of Consumer and Worker Protection, “Rules Relating to Contracted Delivery Workers,” January 26, 2026, https://rules.cityofnewyork.us/rule/rules-relating-to-contracted-delivery-workers/.
[43] Boon Chuan Lim, “Platform Substitution Under New York City’s Food Delivery Pay Rule,” Research Square preprint, May 12, 2026, https://doi.org/10.21203/rs.3.rs-9578165/v1.
[44] Yunmin Choi et al., “Does Helping Hurt? How Food Delivery Minimum Wage Regulations Disrupt Ride-Hailing,” Economics Letters 264 (2026): 112930.
[45] Yuan An, Andrew Garin, and Brian K. Kovak, “Delivering Higher Pay? The Impacts of a Task-Level Pay Standard in the Gig Economy” (NBER working paper no. 34545, December 2025).
[46] Rubing Li, Xiao Liu, and Arun Sundararajan, “Platform Design, Earnings Transparency and Minimum Wage Policies: Evidence from a Natural Experiment on Lyft” (working paper, February 2026), https://arxiv.org/abs/2602.08955.
[47] Liya Palagashvili et al., “Assessing the Impact of Worker Reclassification: Employment Outcomes Post–California AB5” (working paper, Mercatus Center at George Mason University, January 2024), https://www.mercatus.org/research/working-papers/assessing-impact-worke….
[48] Lower-income supplemental earners are defined using a federal poverty level (FPL)–adjusted household-income proxy constructed from Q17 (total household income, reported in ranges) and household size (adults from Q5 plus children across age groups from Q6). Each income range is assigned its midpoint; top-coded household-size responses use the lower bound. Respondents are classified as lower income if their imputed annual income falls below 200 percent of the federal poverty guidelines for their household size. All measures are approximations given the categorical nature of the underlying variables.
SUGGESTED CITATION
Liya Palagashvili, Revana Sharfuddin, and Benjamin Glasner, “The Economic Importance of Flexible Income: Evidence from a Survey of App-Based Workers,” Mercatus Working Paper, Mercatus Center at George Mason University, Arlington, VA, November 2026.
METADATA
© 2026 by Liya Palagashvili, Revana Sharfuddin, Benjamin Glasner, and the Mercatus Center at George Mason University
JEL codes: J21, J22, J46, J68, L86
Keywords: platform work; gig economy; supplemental income; labor supply; flexible work; independent contracting; app-based work
AUTHOR CONTACT INFORMATION
Liya Palagashvili, Mercatus Center at George Mason University, [email protected]
Revana Sharfuddin, Mercatus Center at George Mason University, [email protected]
Benjamin Glasner, Economic Innovation Group, [email protected]
DISCLAIMER
The Mercatus Working Paper series allows in-house and affiliated scholars to share preliminary research findings. These papers are not peer reviewed. The views expressed are the authors’ own and do not reflect the official positions of the Mercatus Center or George Mason University.

