- | Healthcare Healthcare
- | Expert Commentary Expert Commentary
- |
ACA Plan Premiums in 2017 Higher than Expected and for Worse Coverage
Accurately accounting for all the pertinent factors reveals that 2017 ACA plan premiums are substantially higher than CBO expected for comparable coverage when the law passed.
As premiums for Affordable Care Act (ACA) insurance plans skyrocket across the country, the Department of Health and Human Services (HHS) appears to be spinning the bad news by noting that 2017 premiums are about what the Congressional Budget Office (CBO) expected they would be when the law passed in early 2010. However, CBO’s November 2009 estimate of future premiums involved significant and generally unforeseeable errors in key underlying assumptions having nothing to do with the ACA. A valid understanding of the ACA’s effect on insurance premiums would need to account for these errors.
When Congress passed the ACA, health care inflation had been relatively low for about 4 years even though this was not fully known because of data lag. CBO’s 2009 premium projection did not accurately predict that low health care inflation would continue. CBO also projected that the economy would grow much faster than it actually has; the nation’s 2016 gross domestic product (GDP) is roughly 7% lower than CBO projected it would at the time. This is important since growth in health care spending and growth in the overall economy are positively correlated. Thus, given the much slower rate of growth in overall health care spending than expected due to factors largely unrelated to the ACA, we should expect premiums to be below projections. However, in an indication of how much the ACA increased premiums, the nominal 2017 premium for the ACA benchmark plan—the plan to which the law’s subsidies are pegged—is actually 1% above what CBO expected when the law passed.
Moreover, ACA plans—extremely high deductible policies with very narrow provider networks—are generally lower quality than CBO expected when the law passed. Therefore, it not an apples-to-apples comparison to contrast 2017 premiums with what was projected in 2009. Since lower quality coverage carries lower premiums, the larger than expected premiums for the ACA benchmark plans are in effect even worse.
HHS’ report also stated that “[t]hrough 2016, Marketplace rates remained below initial projections from the independent [CBO], and below the cost of comparable coverage in the employer market.” This is misleading for the previously mentioned reasons, plus it fails to account for insurers receiving larger than expected back-end subsidies, which allowed insurers to offer lower premiums, nor does it account for the huge losses incurred by insurers. After correctly adjusting for these factors, ACA plan premiums prior to 2016 were above CBO’s initial projections and also above the cost of comparable employer coverage.
Health Care Spending Had Already Started To Slow When ACA Passed
Starting in the mid-2000s, health care inflation slowed, but the extent of this slowdown was not anticipated by CBO in 2009. From 2000 to 2005, annual health care inflation averaged about 8%. Health care inflation from 2005 through 2010 averaged about 5%. The large increase in the use of Health Savings Accounts (HSAs)—a form of tax-free savings linked to a high deductible insurance plan signed into law in 2003— and the recession (discussed next) are likely responsible for much of the slowdown in health care inflation during this period. Health inflation has averaged about 5% since the ACA passed as well.
Economy’s Lackluster Performance Big Factor In Lower Premiums
CBO made its ACA premium projections in November 2009—a few months into the start of the U.S. recovery from the Great Recession that followed the financial crisis. Throughout American history, economic growth tends to be high in the aftermath of a recession. In January 2010, CBO projected that growth in real GDP would average 3.2% from 2010 to 2016. By way of comparison, the annual GDP growth rate after the first six years of another severe recession (1981-82) averaged 4.6%.
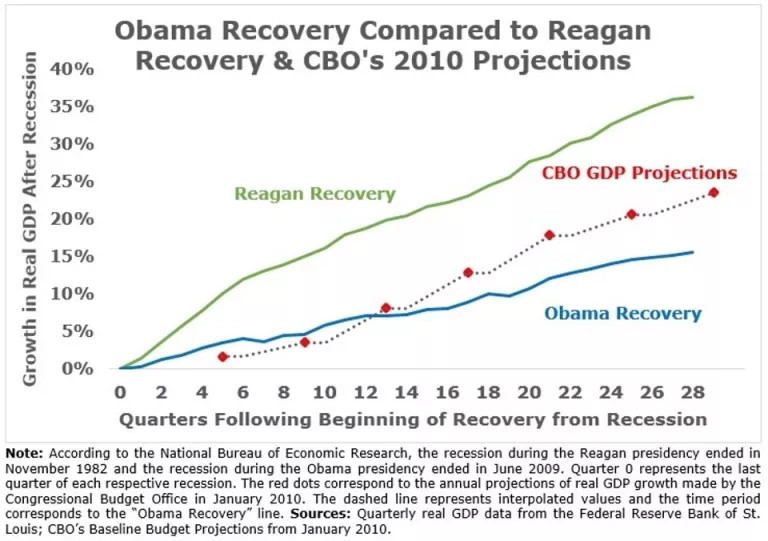
Economic growth after the Great Recession has been anemic by historical standards and relative to expectations. Annual real GDP increased just 2.1% during this most recent recovery, 50% below the average growth rate predicted by CBO and less than half the growth rate during the Reagan recovery. The weak economic recovery has produced lower health care spending, and thus lower health insurance premiums, than would have resulted with a stronger recovery.
CBO Assumed Higher Pre-2014 Health Care Inflation Than Occurred
CBO’s failure to anticipate that relatively low health care inflation would largely continue after 2009 caused their premium projections to be too high. Brookings scholars pointed out that this failure also affected CBO’s projections of employer-sponsored insurance. For example, the per enrollee cost of workplace coverage in 2014, which was much less affected by the ACA, was 12% lower than CBO expected in 2009. Since CBO assumed much higher health care inflation than occurred, it is very misleading to compare their 2009 estimates with 2017 premiums.
Pre-2017 Premiums Failed To Account For Higher Than Expected Back-end Subsidies
To accurately account for ACA plan premiums prior to 2017, it is also necessary to account for the ACA’s reinsurance program—a program that allowed insurers to reduce premiums by compensating insurers for a large share of the cost of their most expensive enrollees. CBO projected that reinsurance payments would lower premiums by about 10% in 2014. In an April Mercatus study I coauthored, we found that net reinsurance equaled about 20% of premiums—double what CBO expected. Reinsurance payments likely equaled about 14% of premiums in 2015 and will likely equal about 9% of premiums in 2016. Failing to account for these large reinsurance payments made ACA plan premiums appear much less expensive than they are.
Pre-2017 Premiums Failed To Account For Massive Losses
As late as February 2014, CBO projected that insurers would be profitable in the aggregate selling ACA plans in 2014, 2015, and 2016. This was an erroneous assumption as insurers have made massive losses selling ACA plans. I have estimated, after accounting for reinsurance payments, that the losses averaged about $400 per enrollee in 2014 and about $1,000 per enrollee in 2015. The fact that ACA plan premiums to date have been much too low to cover insurer expenses means it is very misleading to compare ACA plan premiums with what was projected.
ACA Coverage Is Lower Quality Than CBO Expected
CBO’s 2009 projections did not account for two prominent ACA plan features—extremely high deductibles and very narrow provider networks—which both lead to lower premiums. According to HealthPocket, the average deductible for the cheapest ACA plan policies will exceed $6,000 for single coverage and $12,000 for family coverage in 2017. The second lowest cost category of policies have average deductibles exceeding $3,500 and $7,000 for single and family coverage, respectively. CBO did not disclose its assumptions about ACA plan deductibles, but they are higher than many ACA advocates expected, and deductible size is inversely related to premiums all else equal.
ACA plan provider networks are also much smaller than CBO expected. In April 2014, CBO wrote that exchange plans have “lower payment rates for providers, narrower networks of providers, and tighter management of their subscribers’ use of health care than employment-based plans.” CBO also wrote that “many plans will not be able to sustain provider payment rates that are so low or networks that are as narrow.” However, the evidence suggests that average network size has narrowed significantly since 2014. Therefore, since ACA plans are worse than CBO expected—plans cover far fewer providers and have higher deductibles—its 2009 estimates of future premiums would need to be adjusted downward for a more accurate comparison with 2017 coverage.
ACA Has Produced Massive Premium Increases
The massive premium increases for 2017—an average increase of 25%—are the second major spike in individual market insurance premiums caused by the ACA. This first happened in 2014 when the ACA’s central coverage mandates and rules took effect. A Manhattan Institute study estimated that the ACA increased state-level premiums by 41% and county-level premiumsby 49% between 2013 and 2014. A rigorous Brookings Institution studyauthored by Yale economist Amanda Kowalski estimated that the ACA increased premiums by about 25% above trend between 2013 and 2014.
Since insurers had not yet fully accounted for how few relatively young and healthy people would buy plans or how many people would game the new rules and wait until they were sick to purchase coverage, the average premium increase was approximately 5.5% in 2015. It was higher in 2016, about 12% on average. Altogether, average premiums have more than doubled for individual market coverage since the ACA took effect.
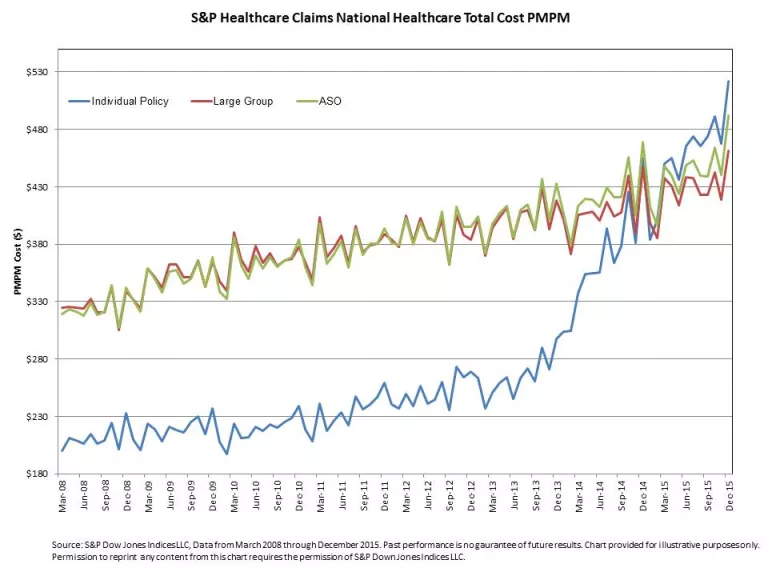
As the graph below illustrates, average medical claims for individual market enrollees surpassed average enrollee medical claims for people with employer-sponsored coverage in 2015. Although the administration as well as other ACA advocates have claimed that individual market coverage has lower premiums than employer coverage, they mistakenly fail to account for both the large reinsurance payments and the large losses.
Conclusion
A full accounting of the differences between current and previously-projected premiums must adjust CBO’s 2009 premium estimates for the lower than expected health care inflation among many other factors. Among them is the fact that ACA insurance coverage is generally more limited than CBO expected. Accurately accounting for all the pertinent factors reveals that 2017 ACA plan premiums are substantially higher than CBO expected for comparable coverage when the law passed.