- | Financial Markets Financial Markets
- | Expert Commentary Expert Commentary
- |
On Bank Size and Bank Asset Holdings
A Series on Bank Size and Concentration
We have so far explored the relatively recent decline in the large number of banks in the US, as well as the long-term institutional factors that likely contributed.. In this last post, we examine the allocation of bank assets across the economy, including the role of bank size on small business lending.
Assets in Banks, Thrifts, and Bank Holding Companies
In our second post, we showed that the number of banks and thrifts, as well as the number of bank holding companies, has been declining. This suggests that banking activity has becoming concentrated. Holding companies are part of the reason for this trend..
Figure 1 shows that the fraction of banking assets held in banking entities that operate within a parent holding company has been increasing. The fraction increased nearly 10 percentage points during the 1990s. While the fraction increased by only two percentage points in the subsequent years before the crisis, it increased by about five percentage points in 2008. 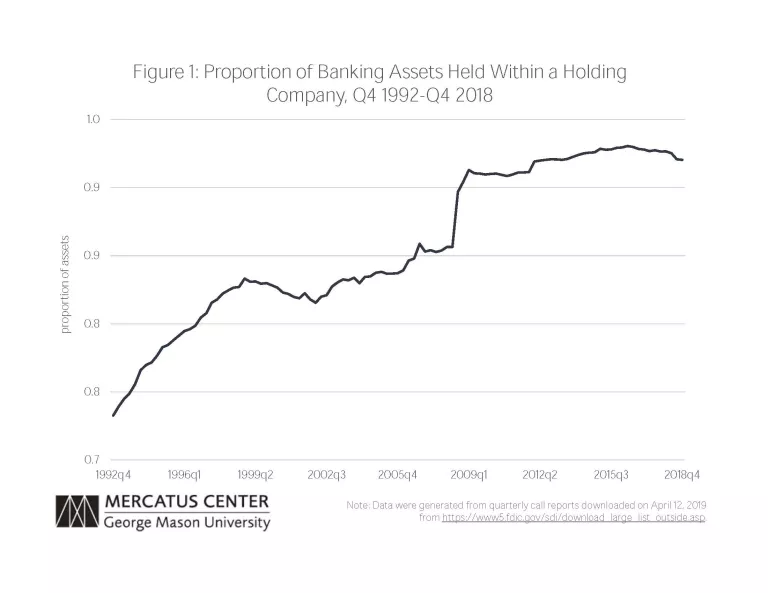
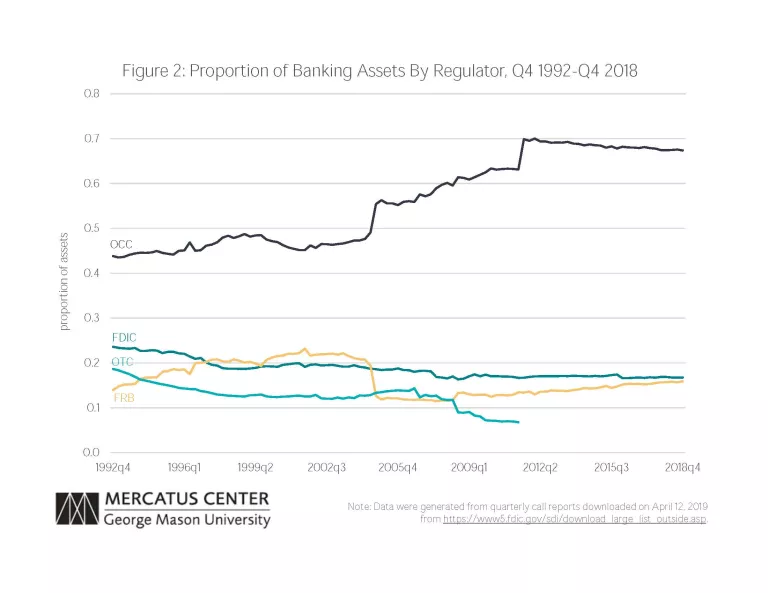
In our second post, we showed that the FDIC regulates the largest fraction of banking entities, although those entities tend to be smaller in size. The story changes when considering banking assets.
Figure 2 plots the fraction of banking assets by regulator. While the fraction of entities regulated by the OCC has been falling, the figure below shows that the OCC’s fraction of bank assets by regulator has been increasing, at just under 70 percent since the crisis. The fraction for the other regulators has been declining slightly.
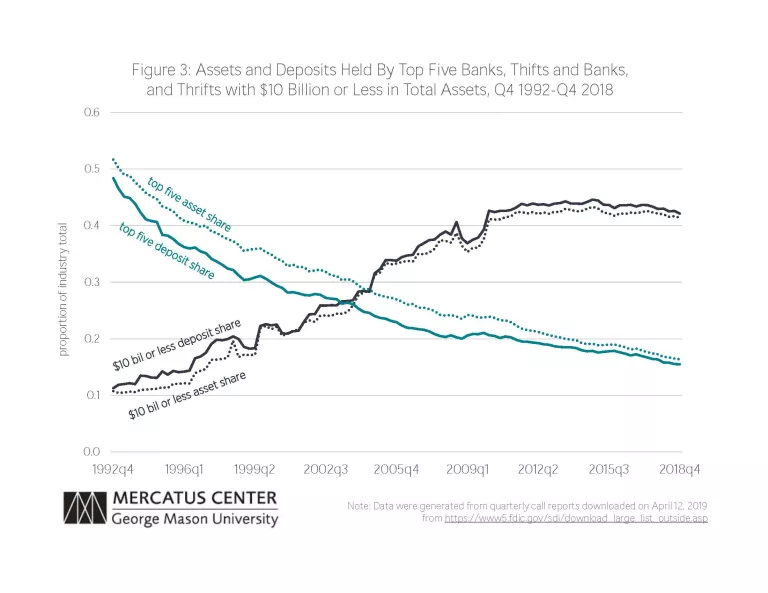
Small banks, defined as those with $10 billion or less in total assets, make up about 96 percent of all banks. Figure 3 shows that while the share of assets and deposits for this small bank category have been declining since Q2 1992, the share of deposits and assets for the top five largest banks (in terms of total assets) has not only been rising, but now exceeds that for smaller banks. That said, the trend for large banks has flattened since the recent crisis. We find qualitatively similar results in terms of small business lending.
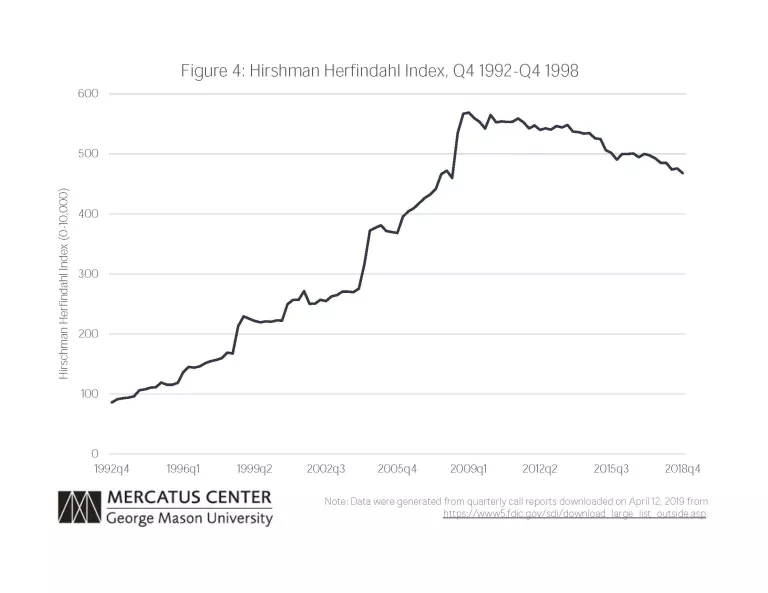
Figure 4 offers an alternative way to look at industry concentration based on the Hirschman-Herfindahl Index (HHI), calculated as the simple sum of squared (asset) shares for each bank holding company. While US horizontal merger guidelines make use of this measure, depending on the market, this figure typically gets measured at the local level.
While the index can be expressed on a 0 to 1 scale if the shares are expressed as decimal values, we use the more traditional 0 to 10,000 scaled used when the shares are expressed as a percent.
When measured at the local level, a market is deemed “highly concentrated” when the HHI equal to at least 1800.
The figure suggests that, based on a simplistic measure, the commercial banking sector is unconcentrated, and since the crisis, and the trend has declined rather than increased.
Conventional wisdom holds that small banks supply a large fraction of small business credit because they make extensive use of “soft” information, while larger banks cannot (see Berger and Black, (2011)). Initial evidence suggested that larger banks relied on quantitative criteria when making decisions concerning loan origination, while smaller banks made use of qualitative criteria (see Cole, et al. (2004)).
However, both small and large banks have made increasing use of credit scoring technologies, which offer a substitute for “soft” information. As a result, small banks may have lost their advantage in serving small businesses (see Berger and Frame (2007) and Berger, et. al. (2007)).
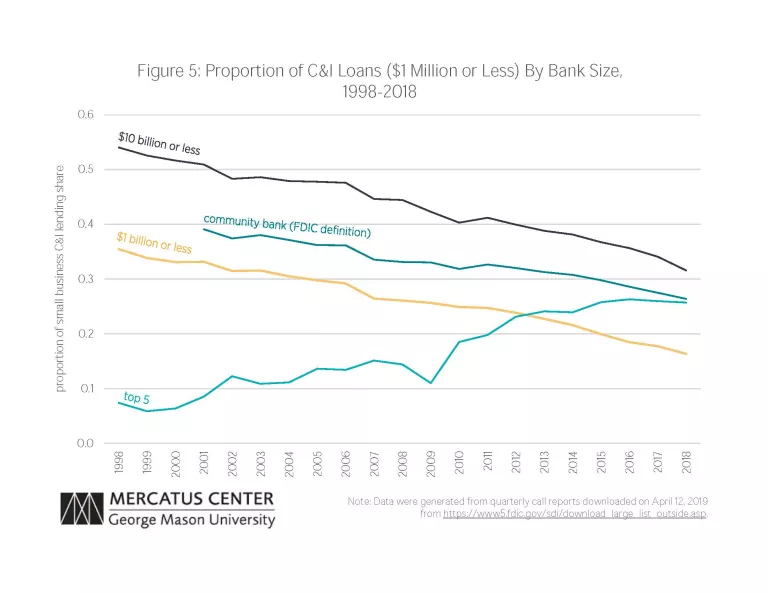
Figure 5 shows that large banks have been originating a larger fraction of commercial and industrial (C&I) loans of under $1 million, a commonly used proxy of small business lending available from call reports.
The top 5 largest banks in 1998 held about 8 percent of small business loans, and that fraction has grown to 27 percent in 2018.
For smaller banks, the story differs. In 1998, banks with parent holding companies or individual banks that had $10 billion ($1 billion) or less in total assets were originating just under about 53 percent (36 percent) of all small business C&I lending and that fraction has declined to 30 percent (16 percent) by 2018.
For FDIC-defined community banks, the fraction has fallen from about 38 percent to about 25 percent. This suggests that smaller banks, while certainly not unimportant, play an increasingly smaller role in funding small business C&I lending, while larger banks play an increasingly larger role in funding such lending.
Even with the large number of small banks still in existence, the size of the typical bank continues to increase. While small banks continue to play an important role, their influence will likely continue to diminish. Policy debates should focus more on consumer access to financial services rather than on the size of the entities providing those services.
Photo credit: Getty Images/Theodore Van Pelt/EyeEm