- | Financial Markets Financial Markets
- | Expert Commentary Expert Commentary
- |
The Recent Decline in the Number of Banks
A Series on Bank Size and Concentration
A variety of banking entities operate in the US, including different charter types such as commercial banks, savings banks and thrifts, and banks that operate within and without a parent holding company. In this post, we summarize the changes the American banking industry has experienced over time.
Banks & Bank Holding Companies
Figure 1 shows that there were 13,935 banks in the fourth quarter (Q4) of 1992, including both commercial or savings banks and thrifts. That number has declined to 5,406 in Q4 2018. The number of commercial or savings banks alone declined from 11,982 to 5,057 during that period.
There were 5,682 bank holding companies in Q4 1992, and that number has declined to 3,868 in Q4 2018. The fraction of commercial or savings banks and thrifts in holding companies has risen from about 60 percent in Q4 1992 to about 78 percent by Q4 2018. Thrifts have a lower likelihood of being in a holding company, so if we exclude thrifts, the fraction of commercial or savings banks has risen from about 69 percent in Q4 1992 to about 83 percent by Q4 2018.
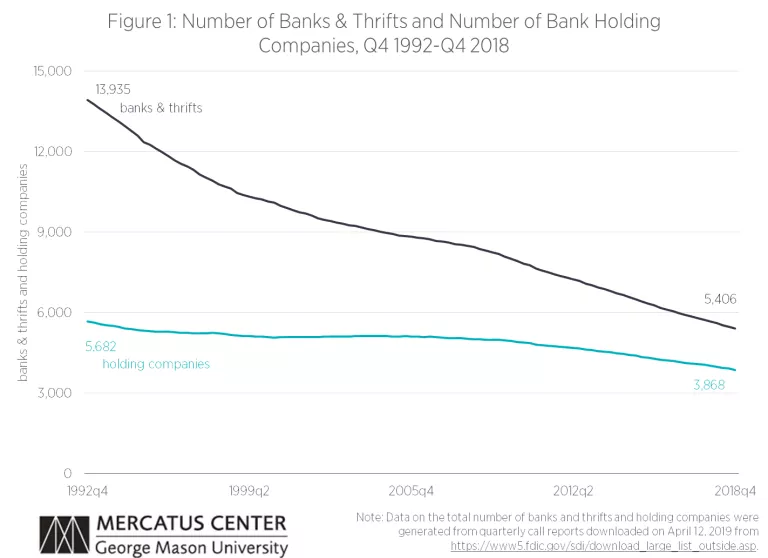
Note: Data on the total number of banks and thrifts and holding companies were generated from quarterly call reports downloaded on April 12, 2019 from https://www5.fdic.gov/sdi/download_large_list_outside.asp.
Banks by Regulator
The US currently has three federal regulators for banks:
- The Office of the Comptroller of the Currency (OCC), which serves as the prime federal regulator for nationally chartered commercial banks, and as of July 21, 2011, federally chartered thrifts.
- The Federal Reserve Board (FRB), which serves as the prime federal regulator for state-chartered commercial and savings bank members of the Federal Reserve System (FRS).
- The Federal Deposit Insurance Corporation (FDIC), which serves as the prime federal regulator for state-chartered commercial banks that have no FRS membership, state chartered savings banks and as of July 21, 2011, state chartered thrifts.
Until it merged with the OCC in July 21, 2011, the Office of Thrift Supervision (OTS) served as the prime regulator for chartered savings and loan associations, federal savings banks and state-chartered savings and loan associations.
Figure 2 depicts the fraction of all banks in the US by regulator. The FDIC regulates the largest fraction of banks, and the fraction has grown during the sample from 53 percent (or 7,431 out of 13,935 banks) in Q4 1992 to 64 percent (or 3,483 out of 5,406 banks) in Q4 2018.
The OCC regulates the second largest fraction, and aside from the increase in 2011 due to the abolishment of the OTS, the fraction has declined from about 26 percent (or 3,596 out of 13,935 banks) in Q4 1992 to about 21 percent (or 1,129 out of 5,406 banks) in Q4 2018.
The fraction of banks regulated by the FRB has been growing during the sample from almost seven percent (or 955 out of 13,935 banks) in Q4 1992 to almost 15 percent (or 794 out of 5,406 banks) in Q4 2018.
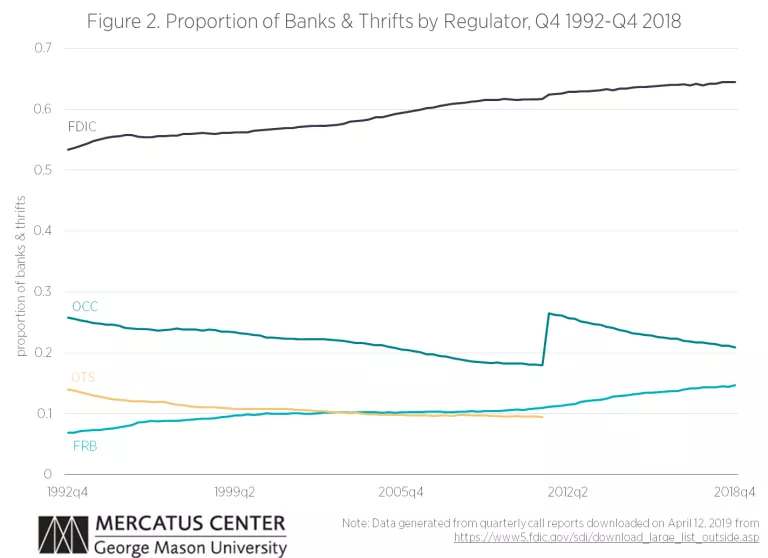
Note: Data were generated from quarterly call reports downloaded on April 12, 2019 from https://www5.fdic.gov/sdi/download_large_list_outside.asp.
Banks by Size
While Figure 1 shows that the number of banks and thrifts has been declining in recent years, most have a relatively small volume of assets under management. While no universally accepted definition of a small bank exists, we use three commonly used definitions: 1) banks with $10 billion or less in total assets, 2) banks with $1 billion or less in total assets, and 3) the FDIC’s activity-based definition of a community bank.
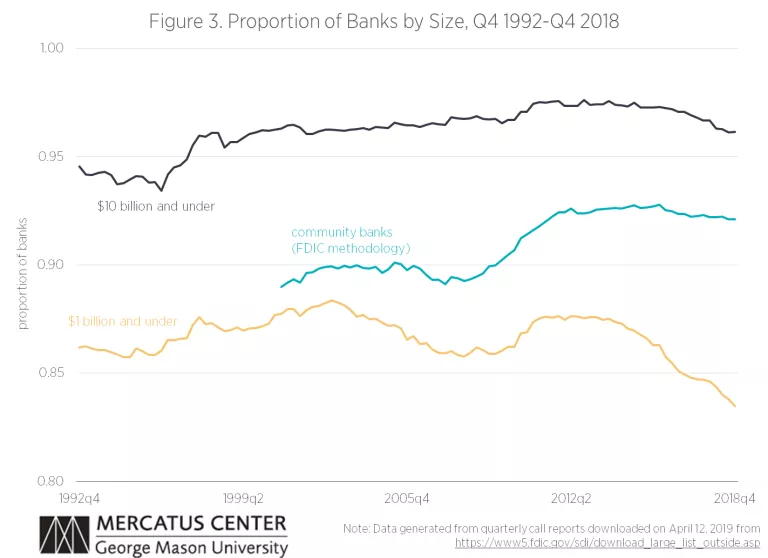
Figure 3 shows the fraction of all banks and thrifts falling in each category. The figure shows that the number of banks and thrifts with $10 billion in total assets or less has risen slightly from about 95 percent (or 13,176 out of 13,935 banks) in Q4 1992 to about 96 percent (or 5,197 out of 5,406 banks) in Q4 2018.
The number of banks and thrifts with under $1 billion in total assets has declined slightly from 86 percent (or 12,010 out of 13,935 banks) in Q4 1992 to about 83 percent (or 4,513 out of 5,406 banks) in Q4 2018.
Lastly, the fraction of FDIC-defined community banks has increased from about 89 percent (or 8,814 out of 9,904 banks) in Q4 2004, when the series was first made available, to about 92 percent (or 4,979 out of 5,406 banks) in Q4 2018.
Conclusions
The stylized facts presented here suggest that in spite of the decline in the number of banks, the US still has many small banks. In our next post, we will explore some of the institutional reasons for this finding.