- | Expert Commentary Expert Commentary
- |
US Steel Deals: A Different Kind of Protectionism, or a Freer Path to Green Trade?
A Section 232 Tariff Exclusion Request Update
Christine McDaniel & Jackson Martin
The announced U.S.-Japan steel deal is similar to the previous U.S.-EU deal. It ends the applicable section 232 tariffs and instead establishes a new quota-like regime for tariff rates. On the surface, the deals appear to be trading one type of protectionism for another. Yet the new deals include specific provisions that aim to address the steel industry’s decades-long complaints about overcapacity and an emerging interest in tracking carbon intensity.
Steel coming from the EU will only avoid the tariffs if it is “melted and poured” in the EU, which likely means a lower carbon intensity given the new green guidelines for EU steel. It also means that non-EU countries cannot use the EU as an export platform for preferential treatment into the United States or other countries. For Japanese steel, the United States and Japan will further discuss how to calculate carbon intensity. This will be an important space to watch, as a similar agreement is being negotiated with the UK.
Since January 1, the U.S.-EU deal includes a tariff rate quota regime with an annual import volume set at 3.3 million metric tons. This amount seems to be calculated using the data in the “TER under Average annual consumption for years 2015-2017 of the product that is subject of this exclusion request (kilograms).” Unfortunately, of all the data we have been collecting, that datapoint is not one of them.
According to preliminary reports, the U.S.-Japan agreement will take effect on April 1 and allow 1.25 million metric tons of Japanese steel to be imported annually before being subjected to a 25% tariff. In recent months, South Korea has also been requesting a review of the steel quota arrangement made during the Trump administration.
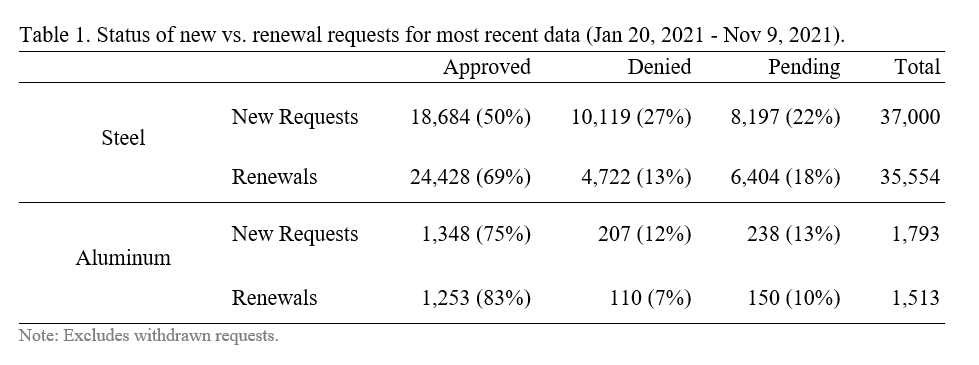
Since our last update of the relevant Mercatus Center data in March 2021, there have been 72,554 new requests for exclusions (TERs) from the steel tariffs and 3,306 new aluminum tariff exclusion requests, excluding withdrawn requests. You can view these in Table 1. Almost as many of these are renewals as they are new requests. For steel, 37,000 are new and 35,554 are requests to renew a previously approved exclusion. For aluminum, 1,793 are new requests, while 1,513 are renewals. Approval rates for renewals tend to be higher than for new requests.
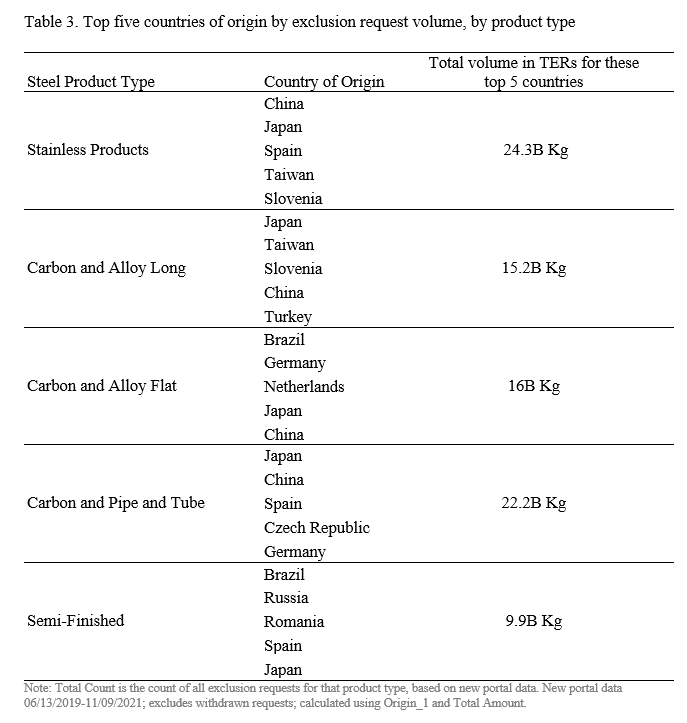
Below, we list the top five countries of origin for steel imports based on the relevant number of TERs (Table 2) and product volume subject to these TERs (Table 3).
For instance, for stainless steel products, the top countries of origin listed are China, Spain, Japan, Germany, and Taiwan. These five countries account for 69% of the number of TERs for stainless products. Overall, stainless products represent 42% of all TERs.
Similarly, for stainless steel products subject to TERs, the top countries of origin by volume are China, Japan, Spain, Taiwan, and Slovenia (Table 3). Comparing these tables, we can see that even though Germany is a popular country of origin in stainless products TERs, it is not in the top five when it comes to volume. TERs on these German products tend to be high in number but with a relatively low product volume. In contrast, the TERs with Slovenia as country of origin tend to have relatively high product volume.
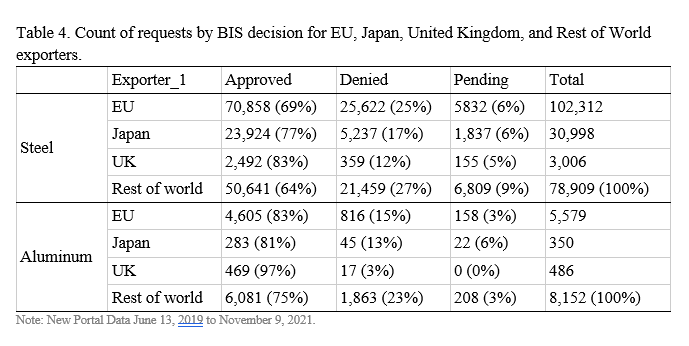
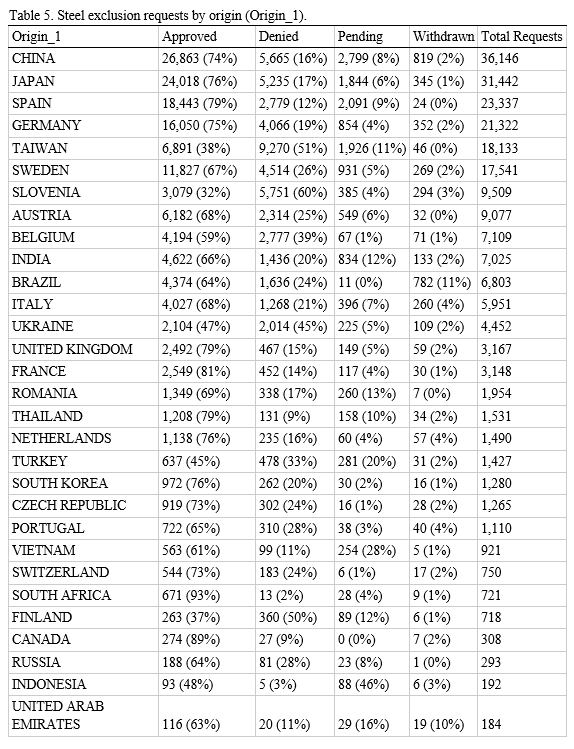
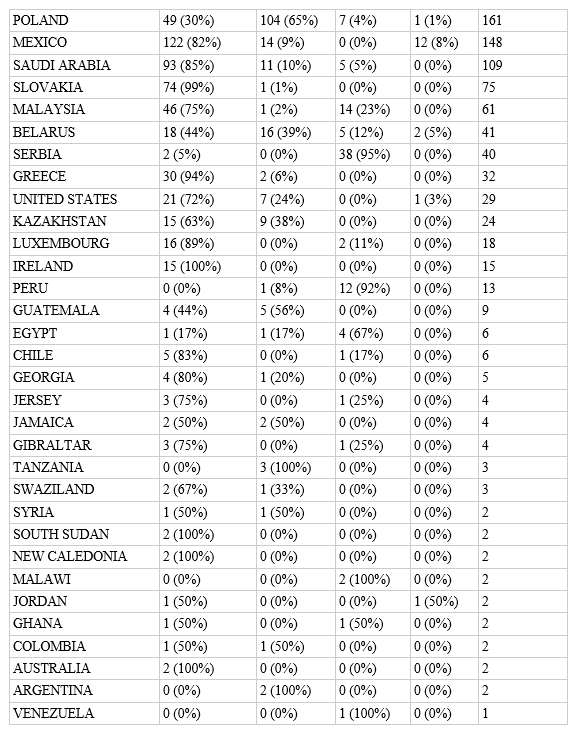
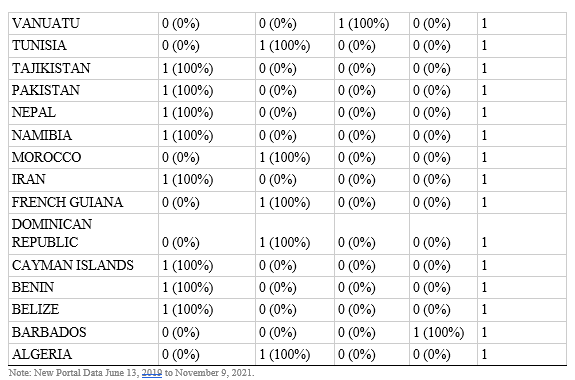
Overall, TERs that list a country from the EU, Japan or UK as exporter (Exporter_1) have higher approval rates than TERs from other countries (Table 4). Outcomes by origin across all countries are listed in Table 5 for steel and Table 6 for aluminum.