- | Housing Housing
- | Expert Commentary Expert Commentary
- |
What Are Homeownership Rates Telling Us?
Homeownership rates are inching up again, and that's great news (if we let it be)
The recent update of the Census Bureau estimates of homeownership for the third quarter of 2019 seems to confirm the continued recovery of the rate of homeownership. For the past three years, on net, all of the approximately four million new housing units added to the American housing stock have been owned homes, rather than rented homes. The homeownership rate appears to be solidly back above 64 percent, heading to 65 percent.
The aggregate homeownership rate appears to confirm the widely held belief that before the financial crisis, there was a frenzy of homebuying which suddenly lifted homeownership rates far above the long-term norm. According to this common view, these new homeowners weren’t generally households that could manage or afford the costs and responsibilities of homeownership. Aggressive lending kept boosting the housing market until the financial crisis hit us, when our chickens came home to roost. The unsustainable bubble had finally collapsed, the story concludes.
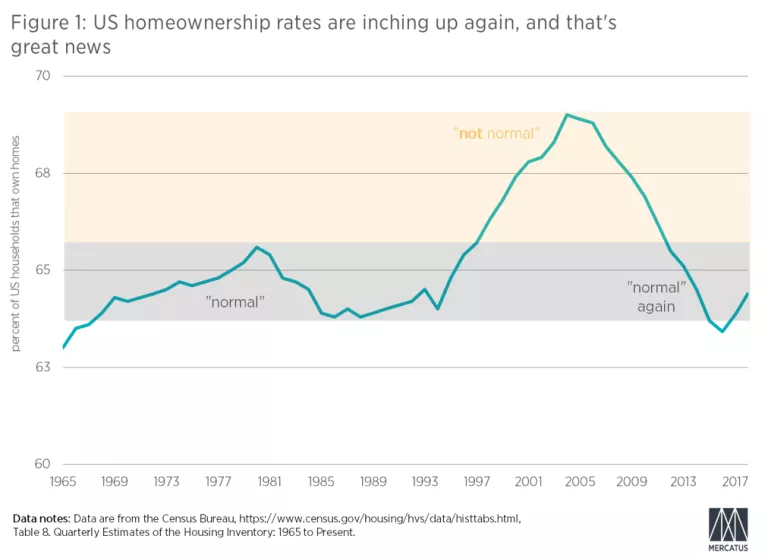
Figure 1 displays the seemingly clear story. If this story is true, then normalcy in homeownership was finally attained around 2013. The homeownership rate bottomed out in 2016. Now, at best, housing markets have returned to a reasonable level, where we should expect homeownership rates to level off, possibly along with housing starts and home prices. At worst, this is the first leg of a new bubble, and our priority should be to do what we didn’t have the discipline to do in 2003 or 2004, which is to put the brakes of the Federal Reserve’s overzealous monetary stimulus and to redouble regulatory efforts to limit mortgage lending, especially lending that is publicly subsidized.
I have argued in my book Shut Out, and in other publications, that this story is disastrously wrong. The newest update in measured homeownership rates presents an opportunity to revisit this issue and to consider what the data tell us about housing markets.
Figure 2 shows the homeownership rate by age group since 1992, the year the Census Bureau started tracking annual estimates. This figure highlights several important points regarding homeownership rates.
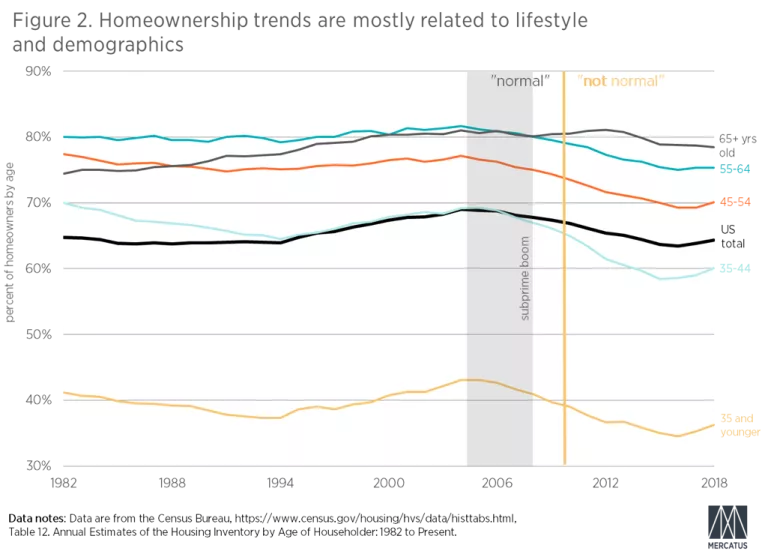
First, homeownership is mostly a product of lifecycle. The entire increase in homeownership rates from 1982 to 2004 was a product of demographics. In 2004, homeownership for all ages below 55 years was roughly at the same level it had been in 1982. Yet, the aggregate homeownership rate increased from less than 65 percent to more than 69 percent over that time. That is because older households are more likely to own their homes.
Second, the subprime mortgage boom, which ran from approximately late 2003 to mid-2007, was actually associated with a decline in homeownership. At the beginning of the subprime boom, ownership was near the high end of long-term ranges, and by the end of the subprime boom it was near the middle or bottom of those ranges. Marginal or non-conventional lending had nothing to do with rising homeownership, and if cutting it off had any effect on homeownership, it only pushed homeownership rates to unprecedented lows.
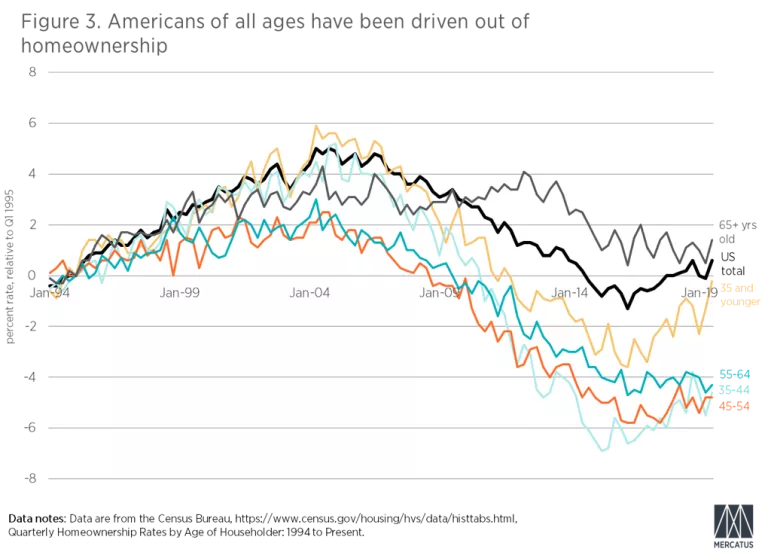
Figure 3 shows quarterly homeownership rates by age, relative to the first quarter of 1995 (1995=0). Even in this shorter time frame, the effects of demographics are clear. At points, this is an example of Simpson’s Paradox, where the national aggregate measure is higher than any of the individual components. For instance, in 2008, the national homeownership rate was more than three percent higher than it had been in 1995, but no ownership rate of any individual age group had risen that much.
Notice, from Figure 3, that today, homeownership rates for all age groups between 35 and 65 are more than 4 percent below the first quarter 1995 level. Remember, the first quarter 1995 homeownership level was already low relative to the previous fifteen years for which we have data. Any deviation below that level is already outside the late twentieth century norm. A shift of more than 4 percent is extreme.
In 2018, the US homeownership rate was 64.4 percent. If each individual age group had the same ownership rate in 2018 that it did in 1994, the 2018 US homeownership rate would have been 66.9 percent. If each age group had the same ownership rate in 2018 that it did in 1982, the US homeownership rate in 2018 would have been 68.4 percent.
Previously, homeownership slowly increased over the typical household lifetime, until only about 20 percent of households between 55 and 64 years of age have typically not been homeowners in previous decades. This has increased to 25 percent.
Furthermore, in Figure 3, the relative change in ownership over time suggests some more important points. After 2007, the more volatile ownership rates of the younger age groups were the rates that collapsed the most sharply. Those owners tend to be new owners with relatively high incomes and high leverage, because they typically had only recently become owners. They were hurt the most by collapsing home prices.
The recent rise in homeownership is heartening. It is a signal that healing and recovery is slowly happening, a decade later. But the increase has been almost entirely coming through the youngest households.
Even among households under 35 years, there is still a lot of room for recovery. Even that age group is only tickling the bottom of the range of homeownership rates that were typical before the crisis.
Yet, the other age groups over 35 years of age are faring even worse. They are stuck at homeownership levels similar to the lows of 2016. The housing bust delivered a sucker punch to millions of American households, and many of them are still down. The normal patterns of saving and owning have been disrupted. That is what led to the late decline of ownership for households above 65 years old.
Older households tend to be less leveraged, so they were less vulnerable to the collapse. Initially, households 65 years of age or more were the one age group that wasn’t particularly affected by the housing bust. But today, many of those are households that were in their 50s when the crisis hit. They have been permanently harmed. Their lower rates of ownership are persisting as they age.
Their participation in the normal American financial lifecycle has been arrested. For households who were 45 to 55 years old in 2004 to 2006, the rate of homeownership for that cohort actually decreased over the following decade. This is not because ownership for those cohorts was particularly high in 2004; it’s because ownership took a huge hit over the following decade.
The exceptional recent rise of the under-35 age group should also give pause to the idea that changing cultural norms or constraints from things like student debt are key variables here. Households across all ages didn’t suddenly decide in 2007 that they don’t like homeownership any more. And, if student debt is a binding constraint, it certainly would be odd that homeownership is only growing among households that were attending college during the crisis.
The overwhelming factor here is whether you were hit with the housing bust. Young households escaped it. They hadn’t become owners yet. So, they are finally recovering, in spite of very tight lending conditions, while other households haven’t recovered.
The key to arriving at the appropriate policy response is to turn the conventional story upside down. Rising aggregate ownership rates will be a tentative baby step toward normalcy. There will be tremendous social pressure to treat an ownership recovery as a sign of excess and as a reason to cut back on lending, building, and economic growth in general. That reaction is decidedly wrong-headed.
Much of the damage that has been done can’t be fixed. Households that lost their homes to foreclosure have generally suffered permanent losses. But for households who have held onto their homes, there is still room for more equity recovery.
Policymakers shouldn’t be afraid of rising prices, especially if new home sales of entry level homes remain at such low levels. High prices reflect both low long-term real interest rates and high and rising rents. Those high rents are a product of the lack of new supply. Until new building at price points below $200,000 increases substantially, the idea that markets are overheating or overly stimulated shouldn’t even be on the radar. Currently, fewer than 100,000 new homes below $200,000 are built annually. Before we are even approaching normalcy or sustainability in housing markets, that quantity will have to rise by several times its current level. Before the crisis, the annual sales of homes at those prices was around 500,000 units.
As I noted at the end of Shut Out, the solution so frequently cast as prudent is to put the brakes on American economic growth to avoid malinvestment or speculation. Instead, we have a free pass here to “let it rip”. This isn’t an argument to subsidize or stimulate housing. All that is required is getting out of the way—in local zoning regulations, immigration, lending regulations, and monetary policy.
Let developers build, let workers come, let buyers borrow, and create enough money to let it all happen. At long last it’s time to stop being afraid of our own shadows. When it comes to housing, if ownership among middle aged households somehow increases by 4 percent from its current levels, then we might be nearing the realm of a “normal” or “sustainable” market.
A full healing from the financial crisis will see homeownership among 55-year-olds following the lead of 35-year-olds. At best, that is unlikely to ever happen completely. But, until anything like that even begins to happen, the easy first step is to stop poisoning markets with obstacles to growth. To do that, we must come to terms with the fact that it was the bust that was the economic anomaly, not the bubble. It was a lack of demand—of money and lending and real economic activity and migration—that did these unfortunate former homeowners in, not an excess of it. The acceptance of appropriate policy solutions will require that realization.
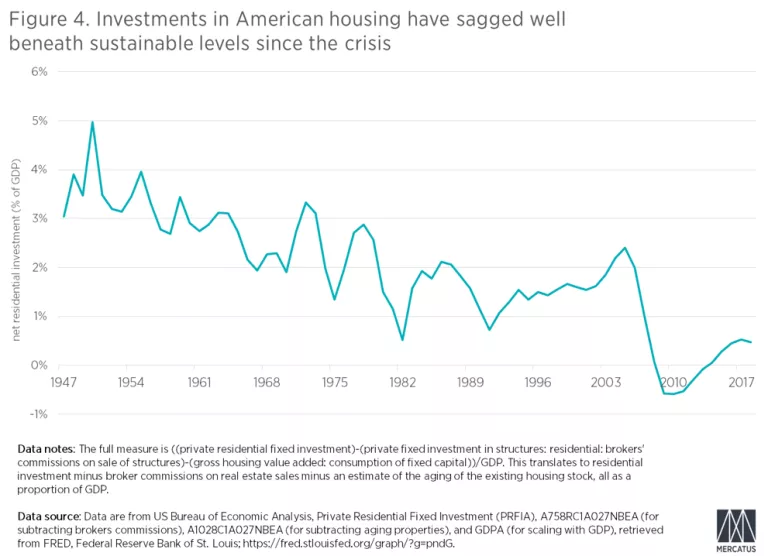
As Figure 4 makes clear, the American housing market has been far below any sustainable level of investment since the crisis. Net residential investment after the depreciation of the existing stock has been stagnant for a decade. More importantly, there never was an unusual surge of investment before the crisis. The rise in residential investment was quite moderate.
The idea that housing investment was so outrageously high that it necessitated a decade’s building depression is the virus in the zeitgeist that must be exorcised so that we can accept the fabulous news that rising homeownership and much higher levels of activity in buying, borrowing, and building are unalloyed harbingers of financial healing.
May we allow this to be just the beginning of a market with an increasing number of homeowners.
Photo by Ariel Skelley