The Department of Commerce’s first estimate for 2021 fourth-quarter real GDP growth came in at a resounding 6.9%, the highest quarterly rate since 1984. That also happened to be a year, like 2021, when the economy was rebounding from a severe recession. The 6.9% quarterly growth estimate was enough to yield 5.7% real GDP growth for 2021, topped only by -- guess what -- 1984’s 7.2%, a resounding rebound number.
After 1984, the annual growth of real GDP settled down to run in the 3% to 4% range. What should we expect for 2022 and 2023? This report provides background on the origins of the recent recession and recovery and speaks to the question.
Taking a Closer Look
As shown below, the Department of Commerce-provided graph of quarterly growth for 2018-2021 captures the dramatic character of the COVID-19 economic collapse and rebound. I call attention to the larger-than-25% magnitudes involved in the directional changes and ask the reader to consider how any kind of economic system is resilient enough to respond without encountering severe problems. No wonder there are so many empty shelves and unfilled new car lots, price increases, packed ports, and new business starts in the U.S. economy.

It’s worth remembering that the 1982-84 recession, one of the worst after World War II, was generated by the Fed’s deliberate slowing of the economy in order to kill inflation. The economy was not shuttered by government action. This time around, deliberate action was taken to shut down the economy in the hope that some of COVID’s killing power would be reduced.
One difference is that unlike the 2020-21 recession, in the 1980s, there was not much in the way of stimulus treatment. Yes, there were extended unemployment benefits, but no billions and trillions in “helicopter money” distributed to American households and businesses which left vast numbers of us with more money in the bank after the recession than before.
The Current Situation and Forecasts
As I see the current situation, we are dealing with the aftermath of a closed and restarted economy that is now on the rebound. Our most recent record-breaking GDP growth is rebound driven. Common sense and past experience tell us the recent pace will not continue, unless we get more helicopter money. So, what can we say about the near future? What will the presumably slower pace in 2022 and 2023 look like?
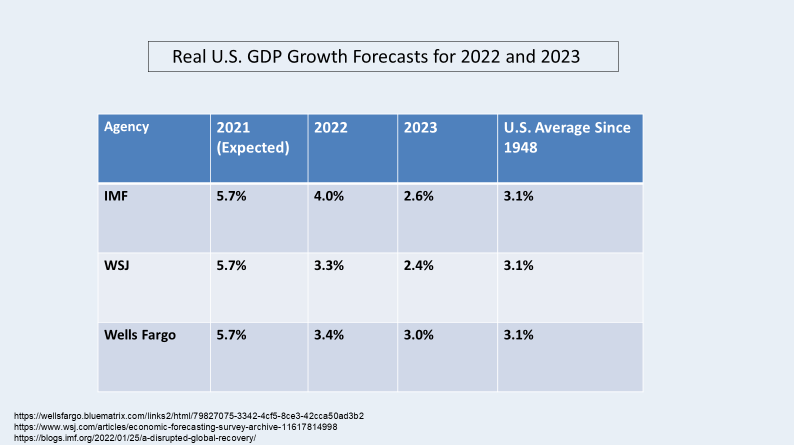
I provide here three estimates for 2022 and 2023 GDP growth along with data on the long-run average growth rate. As indicated, the International Monetary Fund, Wall Street Journal economics panel, and Wells Fargo Economics are calling for slower growth ahead that will tend to converge on the long-run average. The slower expected growth takes account of recent promises by the Fed to slow the economy.
Now, let’s take a closer look at the sudden and severe nature of the national shutdown that got the economic slowdown started, and then at the flood of helicopter money that followed. After that, we will review the effect of all of this on individual sectors.
The Severe Shutdown
In February 2020, just prior to the COVID invasion: the U.S. unemployment rate stood at 3.5%. Two months later in April, the rate peaked at 14.7% and then began heading south again. The COVID shutdown remedy was taking its toll. The unemployment rate is now back to 3.9%. With shops, factories, schools, and even walk-in health care centers closing, 2020’s first-quarter GDP dropped 5%. The next quarter’s growth fell 31.4% before soaring 33.1% in 2020’s third quarter.
For a sample of how this affected diferent sectors, let's look at long-distance travel and recall that hotels were closed early in the pandemic and, in most cases, international travel was curtailed. As detailed by CNBC, on March 12, 2020, around 1.8 million people passed through Transportation Security Administration airport checkpoints. A week later, the number was only 620,000, a drop of roughly 66%. After another week, it was only 203,000. And then in April, fewer than 100,000 people flew on most days. By January 2022, the number flying stood as high as 1,714,000. Air travel has recovered almost to pre-COVID levels, but is still well below the more than 2 million air travelers seen weekly in 2020 and 2019.
For restaurants, March 9, 2020 was the first day people started staying away. Data from Open Table, again flagged by CNBC, tell us that on March 8, there were just 1% fewer seated diners than a year earlier. A day later, the number was 14% off pace. On March 13, seatings were down 36%, year over year. By March 20, things had cratered, and dining was down 99.35%. Only after June 21 did total patronage manage to reach 50% of the prior year’s figure. In late January 2022, the level was down just 17% from a full house.
A full recovery has yet to be achieved, and the new COVID variants have a lot to do with that.
The Washington Cash Flow
In early 2020, Washington leadership responded to the COVID crisis with major injections of newly printed dollars into consumer bank accounts and, to cushion the shutdown’s effects on countless small businesses and other organizations, payments of Paycheck Protection Plan (PPP) dollars enabling the previously employed to continue receiving a paycheck. With the new cash flow, the unemployed were often being paid at least three times: first by state unemployment compensation programs, then with a federal addition to the state programs, and finally with PPP and direct federal payment.
In all, some $4 trillion entered the economy, and none of the new dollars were associated with newly produced goods and services. Instead, there were stacks of freshly printed dollars waiting to get connected with a limited supply of goods of services in a still COVID-affected economy.
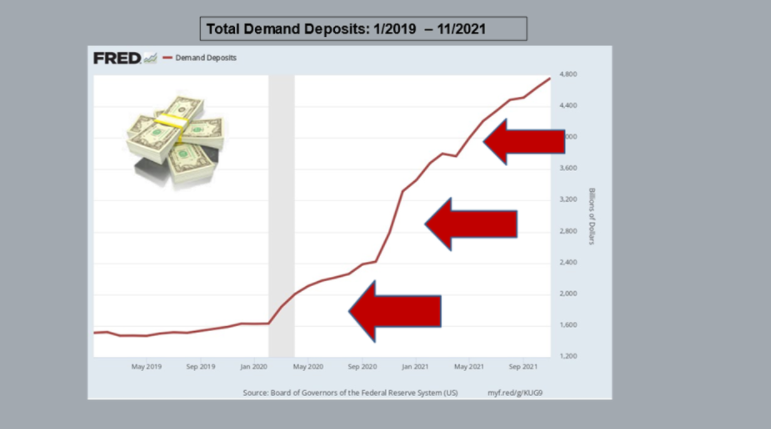
The flow of funds to consumers is partly captured by data on total demand deposits in the U.S. banking system. This is shown in the next chart. Here, it is easy to see the stair-step expansion that occurred as dollars under different stimulus programs made their way into the economy. Note that in under two years, the level of funds in demand deposits rose from $1.6 trillion, which was the previous norm, to $4.8 trillion. This implied there was more than $3 trillion in purchasing power waiting to move into the economy.
Retail Sales Effects
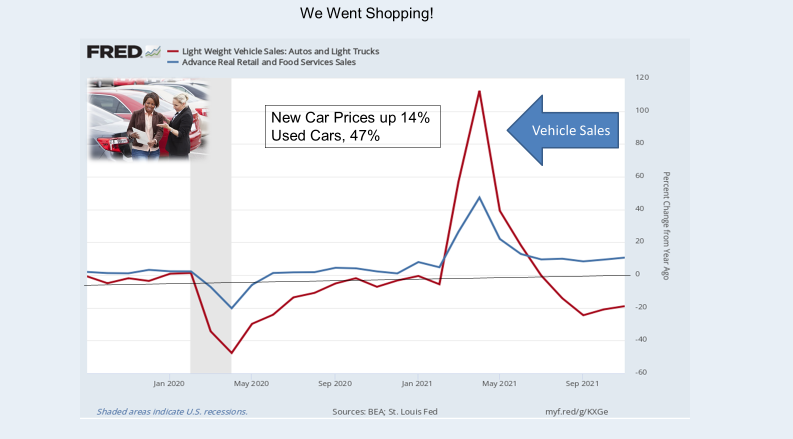
The effect of the sharp, over-the-cliff recession, the showering of stimulus money, and then the just-as-sharp upward rebound is seen graphically in the next chart showing retail sales growth for all items and for autos. Notice that once the anti-recession stimulus money had made its way into consumer bank accounts, shopping increased. Overall retail sales shot up over 40% on a year-over-year basis, and long about March and April 2021, auto sales (which are included in retail sales) rose more than 100%. As indicated on the figure, new car prices rose 14%. Used car prices, on average, jumped 47%. There were just not enough new cars available to satisfy the demand surge. This led to a huge increase in auto production, which in turn hit the limits for available semiconductors.
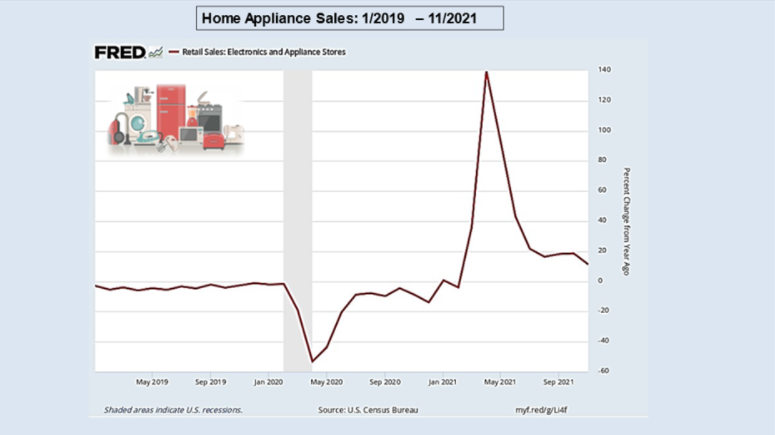
Demand for semiconductors received another shot in the arm when home-bound consumers, students, and employees began to spend more time watching movies, enjoying video games, and doing Zoom sessions that required improved TV sets and other appliances. Along with purchases of electronic devices came more purchases of dishwashers and home laundry equipment, which also called for more semiconductors. The next chart presents the picture for home appliances. Note the sharp 140% run-up in sales centered around May 2021.
Finally, as the freshly printed consumer dollars chased an ever-diminishing inventory of goods on hand, more orders were placed with Chinese consumer goods producers, since China, at the time as it is now, was the world’s production workshop. With increased U.S. purchases of Chinese goods came record-breaking growth in imports and the resulting inevitable congested U.S. harbors. There simply was not enough transportation capacity to handle the surge. The next chart shows growth in Chinese exports to the United States, which peaked with a 100% year-over-year increase long about the spring of 2021.

Eventually, Inflation Roared
The volatile rebound recovery of the turned-off and turned-on, cash-fed economy left in its wake a path of price increases triggered by a combination of packed harbors, unavailable trucks and drivers, excess demand for auto, trucks, and other major consumer goods, and trillions of dollars chasing a restricted supply of goods and services. In a few words, what had been predicted by economists since Irving Fisher's 1892 Yale dissertation and John Maynard Keynes’ clearly written 1923 “A Tracy on Monetary Reform” came true again.
When the supply of money in the economy grows faster than the supply of goods, the price level will rise. I show a simplified form of this in the next chart, which contains data on growth in U.S. demand deposits and growth in the Consumer Price Index.

What’s important here is the lag between money flowing into demand deposits and later CPI-measured inflation. It can take some time for a windfall to leave our bank accounts and truly circulate. Given the current picture, the chart suggests that inflation growth will begin to subside as 2022 comes to an end. Note that I said inflation growth will subside, which is to say we will still have inflation, but at a lower rate of growth.
Final Thoughts
The American people have experienced a COVID-driven tragedy, which has delivered severe loss of life, illnesses, and interrupted life across all dimensions. Social gatherings -- the stuff that gives us our humanity -- have been curtailed, work has been interrupted and reorganized, and the economy has crashed and rebounded in response to COVID and the politically determined remedies applied in the hope of making things better.
We now have a rebound-driven economy, one that seems headed to a more normal growth path. At this writing, the 2022-2023 future looks sound. We can only hope that we do not get another COVID surge and political response.