- | Housing Housing
- | Expert Commentary Expert Commentary
- |
Housing Supply Growth in Hawaii’s Oahu Island Is Not Exactly Blossoming
Hawaii’s island of Oahu is one of the most stunning escapes in the country. Despite the high cost of living in America’s Polynesian islands, for many, the state’s natural beauty and tropical state of mind more than make up for such monetary demands.
Mercatus senior research fellow Salim Furth recently dug into the data on housing supply in the Hawaiian island of Oahu, the third largest and most populated of the chain, from 2012 to 2018. The data can be viewed on Chart 1 below, and is also available as a dynamic map on Datawrapper.
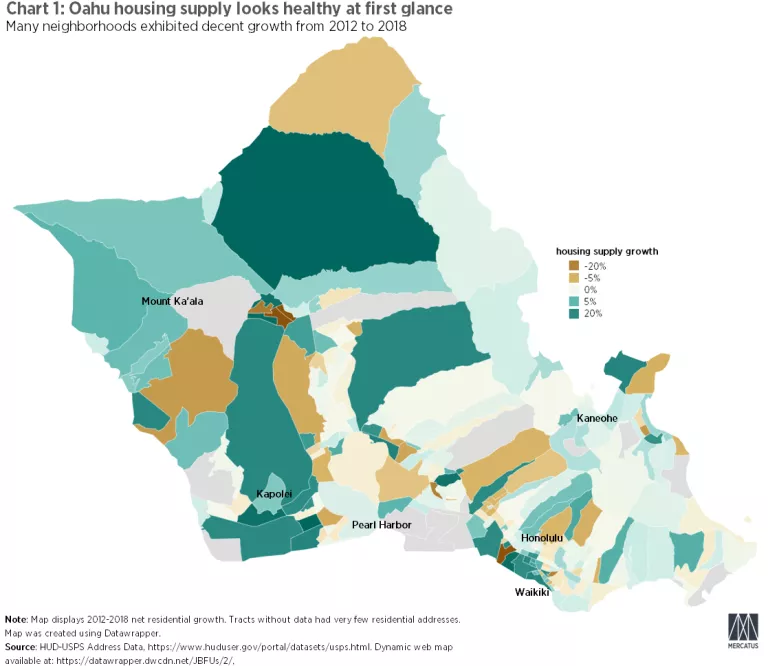
At first blush, the data may look rather encouraging. A few areas did shrink in terms of housing stock, but a good number of them did grow, and many areas saw little change either way. Right away, it should be noted that most Oahuans live in the small census tracts which reflect heavily-settled areas. Larger tracts, like the one to the North that seems to show great housing supply growth, are usually mountainous and therefore largely uninhabitable.
Some of the most impressive growth was perhaps predictably concentrated among the island’s two largest cities: Honolulu to the Southeast, and Kapolei, a golf course-dotted planned community, to the Southwest.
This may give the impression that housing in Oahu is not in a bad way, especially in comparison to other parts of the country.
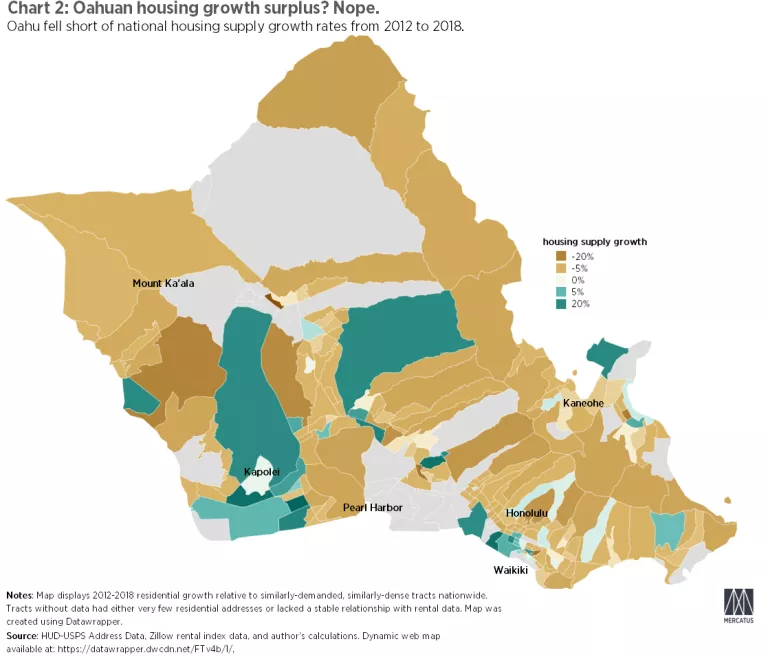
But Chart 2 shows that while Oahu may have much of the country beat when it comes to beaches, in terms of housing supply, the island is sadly falling behind. This map compares the Oahuan housing situation to that in similarly-dense, similarly-demanded census tracts across the country. A dynamic version of the map is also available on Datawrapper.
As Chart 2 displays, the vast majority of census tracts in Oahu fall at least five percent behind other similarly-situated US locales. A few districts did exhibit higher growth than comparable parts of the country; particularly, around Kapolei and some parts of south Honolulu. But overall, the comparative picture in Oahu is one of stagnation at best and falling behind on much of the island.
Interested readers should visit both charts on housing supply changes and the comparative picture on Datawrapper. You can also download the data directly along with the author’s original calculations.
Photo by Don Smith/Getty Images