ur economy is finishing its ninth year of expansion following the economic crisis of 2008 and 2009. While this expansion has been long-lasting, it has also been weak by post–World War II standards. Theories abound for this weakness. One common explanation, particularly on the right, is that the Federal Reserve’s attempts to stimulate the economy have had the perverse effect of keeping economic growth low.
In 2007 and 2008, the Federal Reserve reduced the federal-funds rate — the interest rate it targets — from 5.25 to 0.25 percent. It held that rate down for seven years. Since 2015, it has increased it in increments to 1.5 percent. The Fed has also made large-scale asset purchases to ease credit. Most of the Fed’s conservative and libertarian critics allow that some of these moves were justified as a response to a sharp recession, but maintain that the Fed has kept monetary policy too loose for too long. Its actions distorted markets so much as to amount to “financial repression.” With interest rates held low, investors moved to risky assets, including stocks, to reach for yield. Inequality worsened but the real economy did not prosper.
Many of these same critics spent the first years of the recovery warning that easy money would lead to a surge in inflation. With no such surge having occurred, the argument has shifted. The current critique is that the expansion has been artificial, and will be revealed as such as the Fed retreats from its extraordinarily accommodative policies. As interest rates rise to normal levels and the Fed’s asset holdings shrink, that is, we will see how dangerously dependent the economy has become on support from the Fed to achieve even modest growth.
There is an alternative perspective that better fits the facts. The truth is that poor Fed policy has contributed to the weakness of the expansion. But the Fed has erred by keeping money too tight, not too loose.
The best indicator of the stance of monetary policy is the rate of growth of spending throughout the economy. Accelerating growth in spending signals an expansionary policy and decelerating growth a contractionary one. In the 1970s, spending growth was high and rising, leading to high rates of inflation. During the Great Moderation that followed that period, spending grew at a relatively steady pace, averaging 5.3 percent a year. This steady pace promoted macroeconomic stability. Economic actors were able to make and coordinate their plans against a backdrop expectation that the volume of spending would keep growing at the accustomed rate. 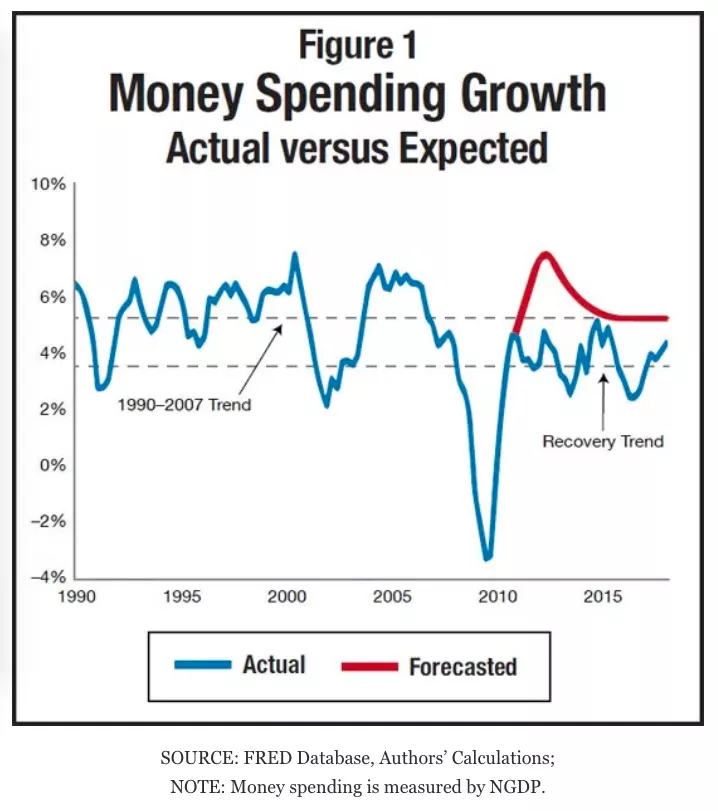
The crash of 2008 and 2009, however, saw the steepest decline in spending since the Great Depression. In its aftermath the Fed did not pursue a policy of letting spending bounce back to maintain its average growth rate. The red line in Figure 1 shows what a historically normal spending path would have looked like. A loose-money policy would have led to growth significantly above that line. Instead, as the figure shows, spending grew at a level significantly below the pre-crisis rate. It has risen at 3.7 percent per year during the recovery.
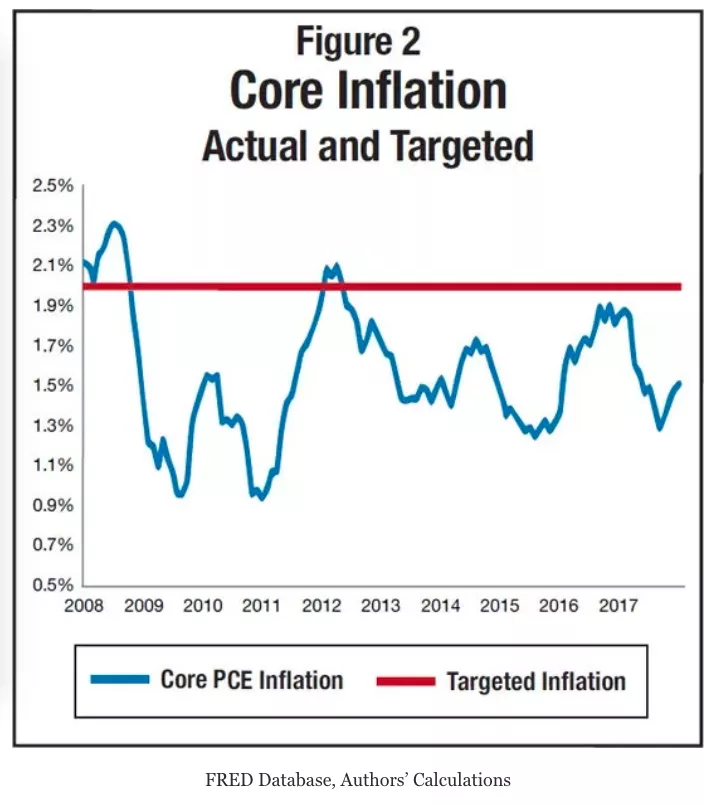
Inflation is another indicator of the stance of monetary policy, and it too has signaled tight rather than loose money. Since the end of the crisis, inflation as measured by the Fed’s preferred indicator — the core PCE price index — has averaged 1.5 percent per year. That rate is below the average level of the previous decades, and, as Figure 2 shows, also below the Fed’s target of 2 percent inflation. Both Fed officials and many outside observers call the low inflation rate a “puzzle” given loose monetary policies. But there is no mystery once you drop the assumption that monetary policy has been loose.