- | Housing Housing
- | Expert Commentary Expert Commentary
- |
The Myth about Bubble Buyers
Part Six of Kevin Erdmann's Housing Affordability Series
In previous posts, I have outlined some ways in which supply and demand play out in housing markets. Since home buyers are both suppliers and consumers of housing, it is useful to think clearly about these different roles that they play.
During the housing boom, there was an increase in homeownership which seemed to happen at the margin. Looking only at price, and only at housing expenses through a lens of ownership, it appeared as if households were “keeping up with the Joneses.” It seemed like new mortgages were enticing Americans into overbuilding and overspending on housing.
Although widely and passionately believed, the ”housing overconsumption theory” is not supported by the data. Even though mortgages were more widely available, they weren’t systematically used by households with lower incomes to buy more valuable homes.
The idea is facially plausible. From 1994 to 2004, the homeownership rate suddenly jumped from 64 percent, where it had been for some time, to 69 percent. In the years since, the rate of homeownership has dropped back down to the pre-1994 levels. This appears to be striking evidence of homeowners being enticed into more expensive properties by loose lending. Then, when that unsustainable lending inevitably ended, the market collapsed, and households now seemed to revert back to long-standing norms of shelter consumption.
This picture is misleading for a number of reasons. One reason is that homeownership rates should have been naturally rising because of age demographics. Older households tend to have higher rates of homeownership, so baby boomers are causing aggregate homeownership to rise. Adjusting for age, homeownership rates in 2004 were not outside historical norms, and the rates after the crisis have plunged far below homeownership rates that have been normal for at least forty years.
For instance, for households 45 to 54 years in age, the homeownership rate in 1982, when the Census Bureau started tracking it annually, was 77.4 percent. It bottomed out at 74.8 percent in 1991 and then recovered to 77.2 percent at the peak in 2004. By 2017, it was down to 69.3 percent!
We are all familiar with the basic, but flawed, housing bubble story. The boom period is commonly referred to as the “anybody with a pulse gets a mortgage” period and the “liar loan” period. Underwriting became lax. Many mortgages were originated without asking for or confirming the income of the borrower. After 2006, there was a foreclosure crisis. So, the idea that households that didn’t have the income to safely purchase homes were overbuying and then defaulting seemed reasonable, even though, in hindsight, it is not supported.
Conventional wisdom presumed that unqualified borrowers used loose credit to overbuild and overpay for homes that they had no business living in. It is more accurate to describe the period as a time when qualified buyers were either buying units in housing-starved cities where they might be able to earn higher incomes or were buying into less expensive cities to avoid the high costs of the housing-starved cities.
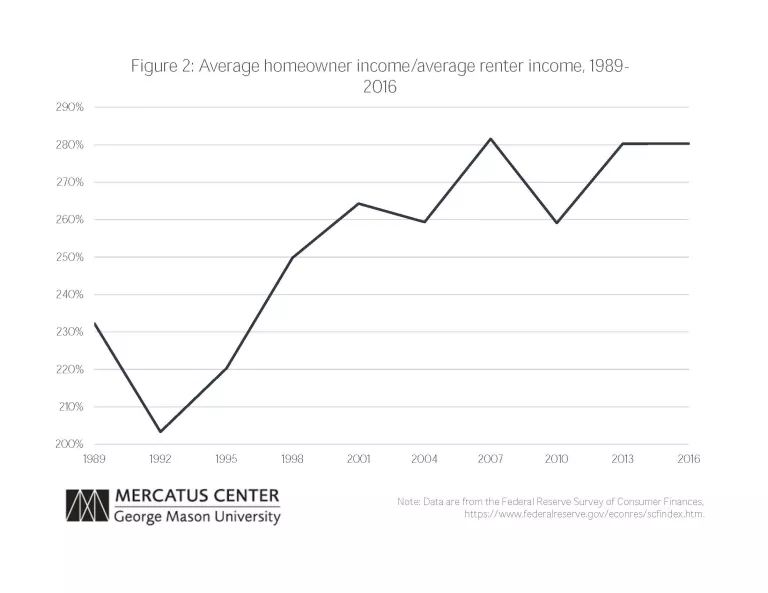
From 1992 to 2007, the relative incomes of homeowners steadily increased. By 2007, the average homeowner had an income about 180 percent higher than the average renter. During the entire housing boom period, high income was becoming more correlated with homeownership, not less.
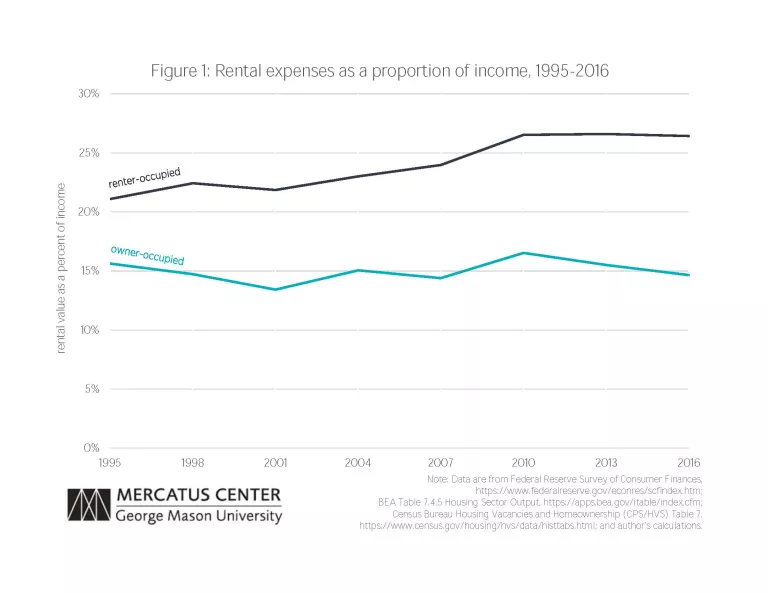
This has not reversed after the crisis. The average homeowner still has an income that is about 180 percent higher than the average renter. One reason that rents were taking a larger portion of renter income during the boom was because the remaining renters tended to have lower incomes. In the following post, I will examine what happened to rents after the bust.
Photo credit: Ariel Skelley/Getty Images