- | Regulation Regulation
- | Expert Commentary Expert Commentary
- |
New Tools and Insights Into State Regulations
Introducing the RegData Definitive Edition
The State RegData Definitive Edition is the most recent expansion of the RegData suite of data products. For the uninitiated reader, the project provides the first and most comprehensive count of states’ regulatory restrictions and has become a go-to resource for many government officials, watchdogs, academics and other experts.
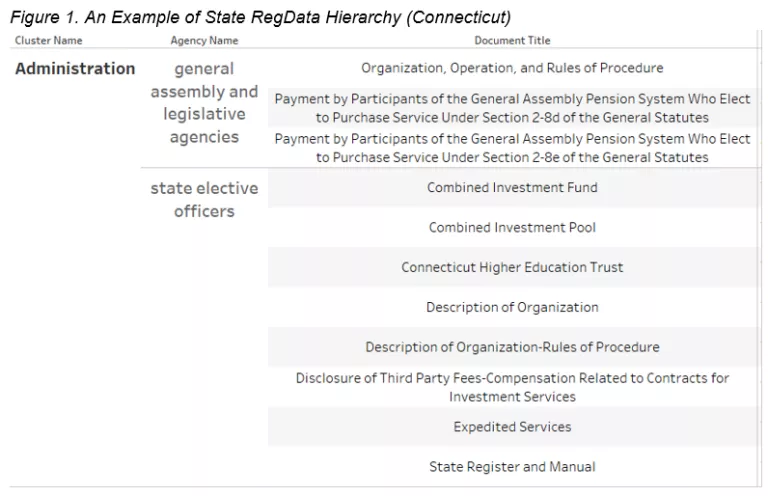
This edition not only adds a fourth year of data collection to the State RegData project, but it enriches the data by adding missing information to previous years and adding a new “agency cluster” feature that groups similar agencies together based on topic for ease of comparison across states.
As with all RegData projects, the primary unit of measurement is regulatory restrictions, or instances of the terms “shall,” “must,” “may not,” “prohibited” and “required” -- those with a direct impact on human action. These units can be aggregated to describe the regulatory impact of various states and state agencies. Additionally, State RegData can be combined with many other datasets, such as datasets released by the Bureau of Economic Analysis, to analyze the relationship between regulation and economic outcomes.
State RegData Definitive Edition is unique from other regulatory datasets because it allows the user to answer an extremely wide range of questions. It can be used to simply identify which states have more regulatory restrictions than others; but alternatively, it can answer very specific questions like “Which rule enacted by the Arizona’s Department of Transportation had the most impact on the lumber industry?”
The following section will demonstrate the flexibility and usefulness of State RegData Definitive Edition through a step-by-step exploration of a state’s regulatory code, starting at the highest level and drilling down to the lowest, using Connecticut as a test case.
Layer 1: How Much Does a State Regulate?
The simplest metrics included in the Definitive Edition are restriction and word counts, which can be used to compare states. For example, in 2022, Connecticut’s administrative code contained 99,007 total restrictive phrases, ranking it 31st among the 50 states.
But this only tells some of the story, as states focus their regulatory gaze differently depending on their economies, demographics, geography and other factors. The next recommended step would be to compare “apples to apples” the total restrictions by type of regulation -- such as the number of environmental regulations in one state relative to the number of environmental regulations in another state.
The difficulty with creating apples-to-apples comparisons come from differences in how states structure their governments and organize their administrative codes. Some states may organize their administrative codes by department or agency whereas other states might organize their administrative code into a title, chapter and part structure. In the former, the code mirrors the structure of the state government and in the latter, it is organized by subject with many different agencies contributing to any single part. The Definitive Edition attempts to address this by clustering the “middle layer” of the code’s structure into broad regulatory topics.
For example, a state that structures by subject might have a chapter called “Medical Licensing” and a different state might have a board called the “Medical Licensing Board.” While different in structure and name, both are organized under the “Health” topic, allowing for more accurate cross-state comparison.
In around half of the states, State RegData has three layers. Connecticut’s code is on the “flatter” end of the spectrum, with just two layers present in the dataset: Title and Subtitle. (See Figure 2 for an example of a subset from Connecticut’s administrative code.) For comparison, a states with a “deeper” code, like Missouri, might have Title, Division, and Chapter.
Layer 2: What Does a State Regulate?
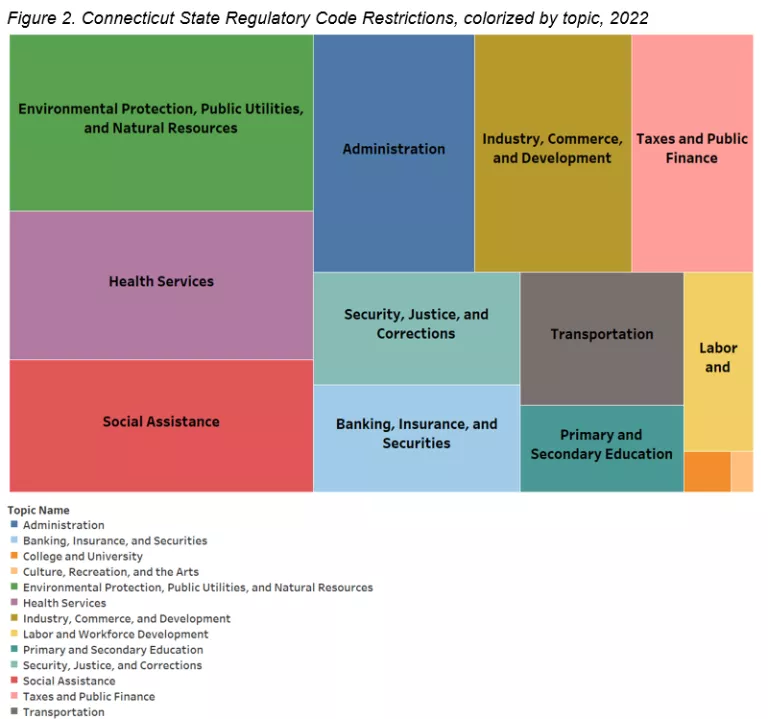
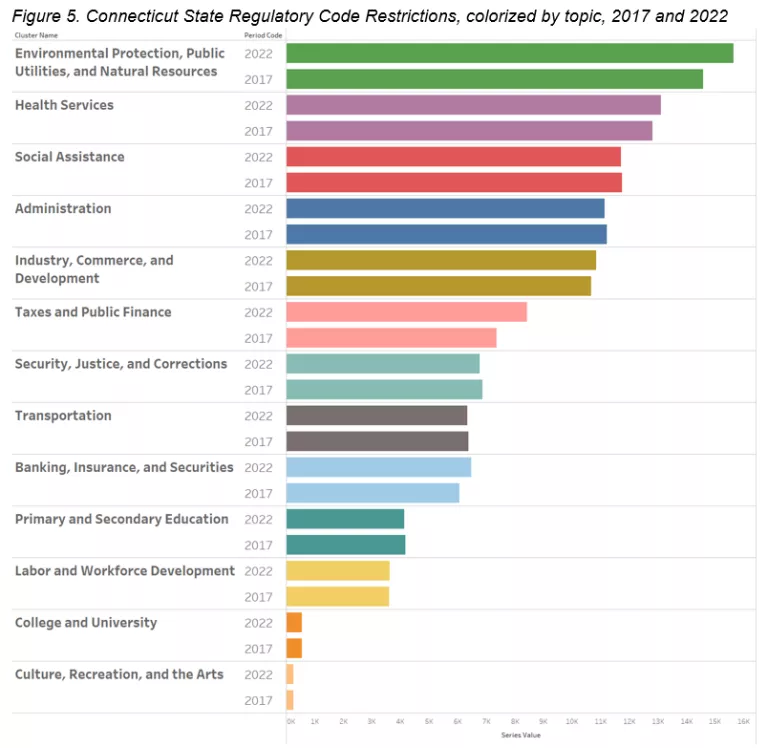
In the next area graph, Connecticut’s regulatory system is colorized by topic, forming a distribution of regulations that appears to be typical across states. Environmental, health, and social service regulations account for most regulatory restrictions. Occasionally, states will not separate their health and social services agencies at any level in their code. When this occurs, both are labeled as a single health topic. From Figure 1, we can see that the largest source of restrictive phrases in the Connecticut administrative code is the “Environmental Protection, Public Utilities, and Natural Resources” topic.
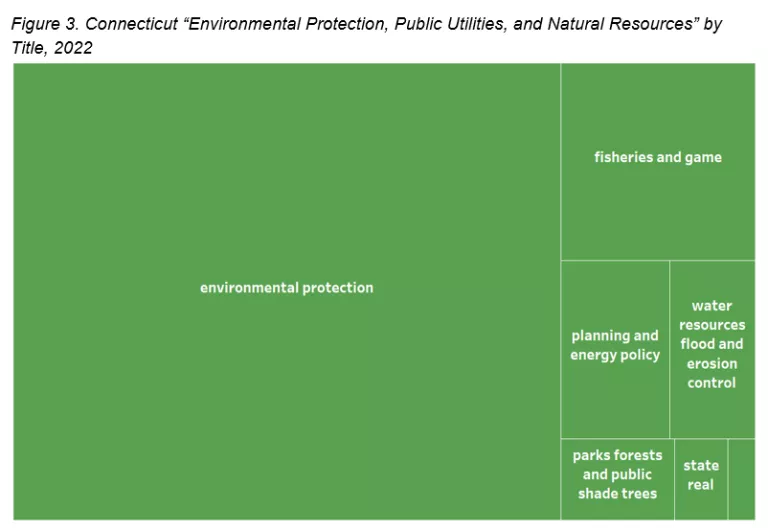
Below the Title-level, we have the Subtitle-level, as shown in Figure 3. For Connecticut’s data in State RegData, the sub-title level is the “document level,” or the lowest level of granularity observed. The lowest level of granularity is typically determined by an average word-count metric. Using this metric keeps each lowest level of analysis similar across all 50 states.
Each of these “documents” represents a cleaned text file that is available to be downloaded from the QuantGov website. These documents have been run through a series of analyses ranging from word counts and restriction counts, to more advanced machine-learning algorithms that assign industry probabilities and language complexity metrics.
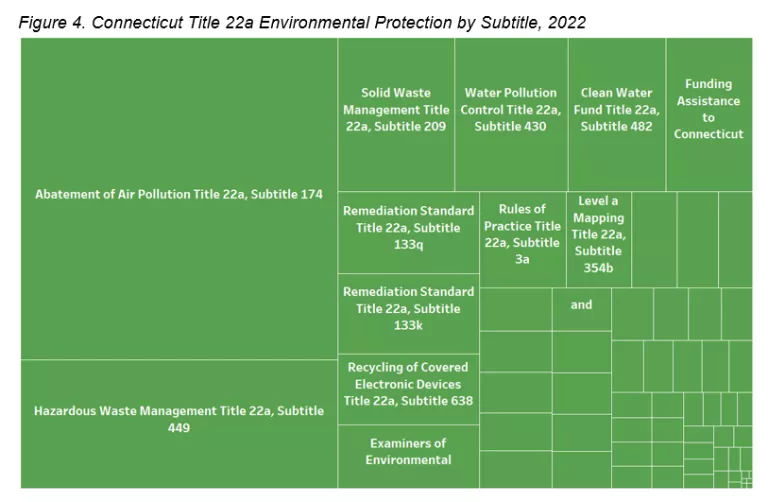
In Figure 4, Title 22a (Environmental Protection) is divided into its subtitles. At this level, we can see what contributes to the Title’s restriction count. “Abatement of Air Pollution,” “Hazardous Waste Management” and “Funding Assistance to Municipalities and State Agencies for Pollution Abatement” contribute the most regulatory restrictions. While a single point of data is useful, being able to examine the regulatory movement over time is even more insightful.
Layer 3: Time-Series Analysis
Connecticut was one of the very first state administrative codes collected in State RegData 1.0. In 2017, Connecticut’s code contained 96,247 restrictive phrases. By 2022, that figure had grown to 99,007, just shy of a 3% increase. At a macro level, this is useful for comparing states and identifying outliers. For example, Connecticut seems relatively “sleepy” compared to some other states, such as Texas, which increased its regulatory restriction count by over 8% between 2018 and 2022.
This high-level number alone inspires more questions than it answers: What Connecticut agencies contributed to the 3% increase? Was environmental regulation always the most regulated area of Connecticut’s code? What if some agencies contributed to the 3% increase while other agencies decreased their regulatory stockpile?
The definitive edition allows for comparisons between years along topics with relative ease. Users can find where changes occurred and what specific regulatory actions were responsible for the change. From Figure 5, we can see that “Environmental Protection, Public Utilities, and Natural Resources” is not only the largest but also the fastest growing topic over the past 4 years.
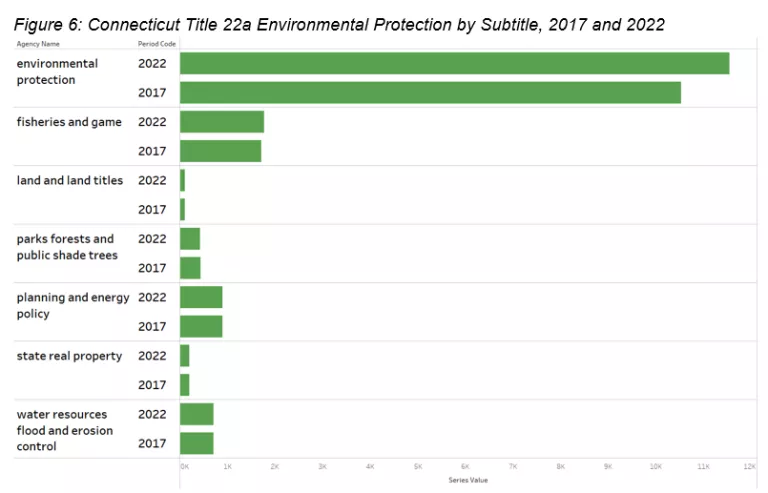
The “Environmental Protection, Public Utilities, and Natural Resources” topic can be parsed into smaller pieces and compared across time. Comparisons across states at this lower level is extremely difficult due to the differences in how states structure their governments and codes. However, if a state does not change its government structure, comparing at this lower level over time is very doable. Luckily, Connecticut’s “Environmental Protection, Public Utilities, and Natural Resources” titles were stable in their structure over the past four years, allowing for a deeper dive into the regulatory movement in Figure 6.
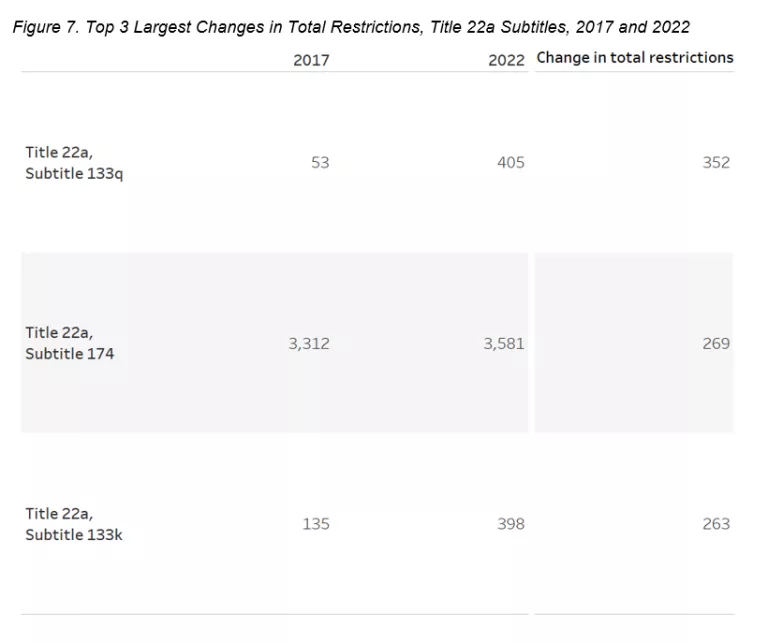
In figure 7, select Environmental Protection Subtitles in the years 2017 and 2022 are compared side by side, revealing that three subtitles account for nearly all the growth within the “Environmental Protection, Public Utilities, and Natural Resources” topic. More broadly, these subtitles account for about one-third of the growth in total regulatory restrictions over the past four years.
State RegData provides data and raw text for both state regulations and state laws to policy makers, scholars and machine learning professionals that is unrivaled in terms of its accuracy and completeness. This data can be paired with QuantGov’s raw text repository that contains text for all 50 states’ regulatory codes. Having both the text and minutely layered time series data opens infinite research opportunities into questions surrounding the most optimal methods of legislating and regulating -- maximizing and balancing safety and growth.