- | Housing Housing
- | Expert Commentary Expert Commentary
- |
Real Estate Investment Doesn’t Increase Spending
Part Four of Kevin Erdmann's Housing Affordability Series
Home prices have been famously high and erratic over the past 20 years. Home prices had generally risen with inflation for many decades, as they should. As shown in Figure 1, total real estate value scaled with national incomes and spending. Then in the first decade of this century, prices shot up outside the norm briefly, before falling back to the norm. Focusing on price, this suggests that the housing market is a dangerous beast and various public regulators must be managed to keep it in its place, to prevent another bubble. Much of the focus of the past decade has been about watching for and preventing that bubble.
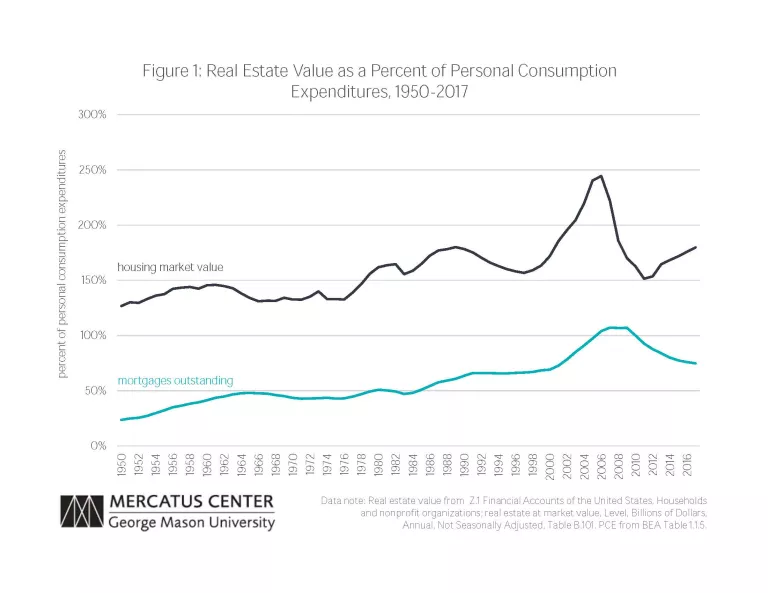
PCE from BEA Table 1.1.5
If we look at housing through the lens of consumption rather than ownership, however, the picture is much different. There are few major categories of spending that are as stable.
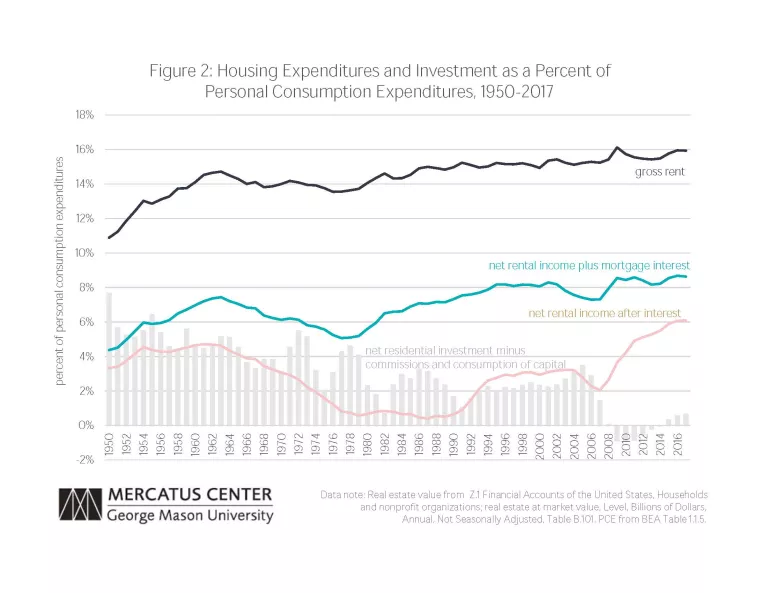
Source: BEA, Table 1.1.5, 5.4.5, and 7.4.5
Housing expenditures include rental value of owner-occupied housing. Net residential investment shown here excludes brokers commissions and is net of the BEA estimate of the consumption of capital in housing.
Who Profits From Housing
The long-term stability of aggregate spending on housing suggests something odd about shelter as a service. In other types of investing, the returns to the investor, over the long-term, are related to the capital invested. But if aggregate national spending on housing is determined mainly by aggregate income, then output from real investments in new housing will almost entirely be captured as consumer surplus.
In other words, if about 15 percent of national spending will be on housing, regardless of whether four percent or zero percent of domestic output is invested in new housing stock, then new investment into housing will decrease the average rate of return on investment to real estate owners while providing households with more valuable shelter.
In fact, this appears to be the case. As Figure 2 shows, the long-term trend in total spending on rent is slightly rising while the trend in net residential investment is declining (this includes both the rent paid by tenants and the estimated rent that homeowners would pay). During the 1960s and 1970s, residential investment was regularly over seven percent of total personal spending, and net of depreciating existing units was regularly over three percent. During that period, total spending on housing remained flat or slightly declining at about 14% of total spending. Since 1980, residential investment has never consistently reached those levels, but rent–spending for the use of shelter–has slowly risen.
This also appears to be the case more specifically in more recent activity. Residential investment had been relatively low and stable for many years, leading up to the housing boom, and gross expenditures on housing had been very stable at about 15 percent of total personal expenditures after moving up from about 14 percent before the 1980s. During that time, net operating surplus–the combined total of net rental income to landlords and interest income to mortgage lenders for funding real estate capital–was also stable, with a slight upward trend.
When residential investment moved up (though, in contradiction of the reams of breathless literature about the housing bubble, the increase was moderate) in 2004 and 2005, this had no effect on total spending. But because physical capital was being added to the housing stock, real estate owners were claiming less income after expenses and depreciation. In other words, looking at Figure 2, total spending on housing kept moving along at about 15 percent of personal consumption expenditures (PCE), but the combined rental income of owners plus mortgage interest earned by financiers declined by about one percent of PCE – from about eight percent to about seven percent.
The echoes of the housing bust continue to be felt a decade after the financial crisis. Over the past decade, new residential investment in structures has not even made up for the rate of depreciation of the existing stock. Yet did this lead to a decrease in housing expenditures? No. It drove both gross expenditures and net operating surplus to new highs. Reducing housing expenditures would, ironically, require a sharp increase in residential investment.
Here, it is useful to think about the forms of real estate income. The net operating surplus can end up in three different pockets. One is the interest income to lenders. After paying lenders for their portion of the capital, what remains is rental income. For tenant occupied units, this is an actual cash flow for a landlord or a firm. For owner-occupiers, there is no transaction. This is simply the estimate of the income their property would have earned, after expenses and depreciation, if it had been rented out.
These various claims on rental income are much more volatile than total housing expenditures are. Furthermore, looking back at Figure 1, the market value of real estate is more volatile than the total spending or income. Mortgages outstanding tends to rise and fall proportionately with real estate values.
This, combined with the popular tendency to blame rising mortgage levels for rising prices, has led to complaints about “financialization.” The idea is that more lending was the primary cause of real estate price inflation. This led to actions meant to reduce lending. These actions have succeeded in their explicit goals. As seen in Figure 1, mortgages outstanding have declined since 2008, and as seen in Figure 2, the portion of housing income paid to lenders as interest has declined significantly.
Yet this development has done nothing to improve the fundamental measure of housing affordability. Even without any net growth in the housing capital base since the crisis, gross spending on housing is taking a larger proportion of total personal expenditures than ever. And the three groups of investors who pocket the income from housing rents, added up together, have more income today than ever.
Financiers’ interest income is very low, but rental income to landlords and owners more than makes up for it. Since homeowners don’t actually write a check to themselves, they don’t feel richer. And since market and policy developments have pushed the relative real prices of their homes lower than they had been before the crisis in many places, they especially don’t feel richer.
So there is an odd new context where almost everyone feels worse off. Renters must pay more and more for a given unit. And owners live in units that would require higher and higher rental payments, but since they are both the consumer and the provider of the home they live in, they are insulated from the reality of rising rents. The country’s households are increasingly divided into haves and have-nots, and the haves don’t even know they are haves, unless they must sell their homes and face the cost of becoming renters.
The housing boom was helping to bring housing expenditures down, in spite of the urban supply shortage. Now, because of suppressed mortgage markets, the supply shortage has expanded across the country. The supply shift has been staggering. From 1999 to 2005, on average, more than 500,000 new homes were sold for less than $200,000 each year. In 2018, only 75,000 new homes sold for less than $200,000. Lower new supply means rising rents.
The housing bust is creating more excess capital income than a housing bubble ever could have.