- | Expert Commentary Expert Commentary
- |
Section 301 Tariff Exclusions and Extensions
A look at the chemicals and plastics industry (and a call for better documentation and data)
It’s now been more than four years since the Trump administration launched an investigation under Section 301 of the Trade Act of 1974 into China’s policies on intellectual property, technology, and innovation. The investigation and its findings led to the imposition of tariffs on U.S. imports from China covering some 10,000 product categories worth $500 billion.
The tariffs have affected different commercial interests and workers in different ways. Today, let’s look at the pushback from one key set of industries. The data provides some insight into how American businesses view the tariffs, while also pointing toward the need for more comprehensive reporting.
There have been four lists, or so-called tranches, of tariff actions to date. The first tranche was implemented on July 6, 2018. The amount of trade covered varied by tranche: $34 billion for tranche 1, $16 billion for tranche 2, $200 billion for tranche 3, and $300 billion for tranche 4. U.S. stakeholders (i.e., importers) were permitted to submit requests for tariff exclusions on products of interest to them. A federal register notice laid out the rules:
“Each request must specifically identify a particular product and provide supporting data and the rationale for the requested exclusion. USTR will evaluate each request on a case-by-case basis, taking into account the asserted rationale for the exclusion, whether the exclusion would undermine the objective of the Section 301 investigation, and whether the request defines the product with sufficient precision.”
According to our calculations based on the publicly available U.S. Trade Representative portal data, as of September 6, there had been 52,746 product tariff exclusion requests filed since 2018. These include 10,814 exclusion requests filed for the first tranche, 2,869 for the second, 30,283 for the third, and 8,780 for the fourth. Approved exclusion requests are generally valid for one year after the decision is published in the Federal Register, and importers can apply for extensions.
Recently, the Government Accountability Office (GAO) reported that 87% of exclusion requests were denied and 13% were granted. Further, approximately 69% of the denials were attributed to a failure to show that tariffs would cause severe economic harm, 23% because of failure to show a product was available only from China, and 9% because of other reasons.
We have been tracking tariff exclusion requests at the aggregate level, but we now turn to sector-level analysis. Consider the chemicals and plastics sectors, which encompass key intermediate products relied upon by many other U.S. industries and manufacturing firms. For instance, input-output data by the Bureau of Economic Analysis show that chemicals and plastics represent 33% of intermediate value added in textiles, 17% in furniture, 14% in paper, 13% in farming, 9% in automotive, and 8% in construction. Plastics is a critical component in emerging sectors like electric vehicles and batteries.
Chemicals and plastics are generally found in chapters 28, 29, 31, and 32 in the Harmonized Tariff Schedule. The list of HTS codes we used to define the chemical and plastics sectors is at the top of this page. In 2017, the year before the tariffs took effect, the customs value of chemical and plastic imports was more than $20 billion.
Chemicals
Table 1 reports the breakdown of chemical products for which exclusion requests were filed and not filed. Data are only available for the first part of tranche 4 (commonly referred to as 4A). Overall, 2,266 chemical products were subject to Section 301 tariffs. U.S. importers submitted exclusion requests for 1,325 (58 percent) of these products.

Table 2 shows how the approval rating varied by tranche. Overall, of the 1,325 tariff waiver requests for chemical products, 10% were granted and 90% were denied. There were no filings for tranche 1. The approval rating was 31% for tranche 2, 8% for tranche 3, and 18% for tranche 4A.
Plastics
Table 3 reports the breakdown of plastic products that were subject to Section 301 for tranches 1 through 4A. Overall, 1,372 plastic products were subject to Section 301 tariffs and U.S. importers submitted 1,331 tariff exclusion requests for these products.
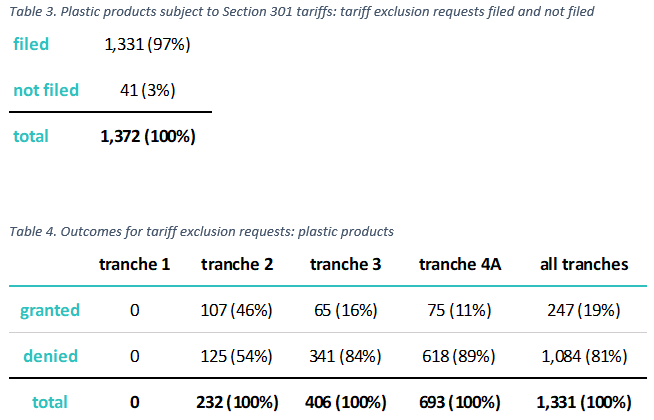
Table 4 breaks down how of the 1,331 exclusion submissions in this category, 19% were granted and 81% were denied. Once again, the approval ratings varied by tranche, and as with chemicals, there were no filings for tranche 1. The approval rating was 46% for tranche 2, 16% for tranche 3, and 11% for tranche 4A.
Extensions
Once an exclusion is granted, it is good for one year and then it expires. The importer may apply for an extension. Table 5 reports extensions granted to chemical and plastic products across the tranches.
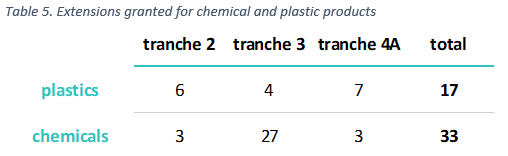
Counting extensions is not as straightforward as exclusions. In some cases, USTR granted extensions to HTS codes that were previously granted an exclusion. In other cases, an extension was granted only to a subset of products that were previously granted the exclusion. Further, for the extensions, USTR does not provide the original unique ID number from the exclusion request.
For example, USTR granted an extension to all products that fell under HTS 3401.19.00, which was granted an exclusion in tranche 4 (“Soap; organic surface-active products used as soap, in bars, cakes, pieces; soap-impregnated paper, wadding, felt, not for toilet use”). But in the case of HTS 3402.20.11 (“Surface-active/washing/cleaning preparations containing any aromatic or mod aromatic surface-active agent, put up for retail, not head 3401”), only the product “laundry detergent powder, put up for retail sale, whether as powder or as water” was granted the extension.
Conclusion
The data show how USTR decisions have varied across tranches for the chemical and plastic sectors. This analysis could be extended to other sectors based on publicly available data, but the USTR portal lacks clarity on product coverage and HTS codes, which prevents a deeper analysis. A recent GAO report found inconsistencies within the internal documentation, which may have something to do with the lack of data on exclusion requests and outcomes.
U.S. manufacturers rely on imported intermediate inputs across the board. Economists, analysts, and anyone seeking to better understand the state of play with tariff exclusion requests and extensions, as well as the overall effects of the tariffs over the last several years, would surely welcome more transparency in this space.