- | Housing Housing
- | Expert Commentary Expert Commentary
- |
Tracking Vermont’s Housing Supply Growth and Decline by Census Tract
How much has Vermont’s housing supply changed over the past few years?
In Housing Supply in the 2010s, I used US Postal Service data to document where the housing supply is growing–and where it is shrinking. The commonly-used data on building permits cannot measure decline, since they do not track demolitions. So this is probably the most detailed publicly-available dataset for identifying which parts of Vermont lost housing units between 2012 and 2018 and which gained.
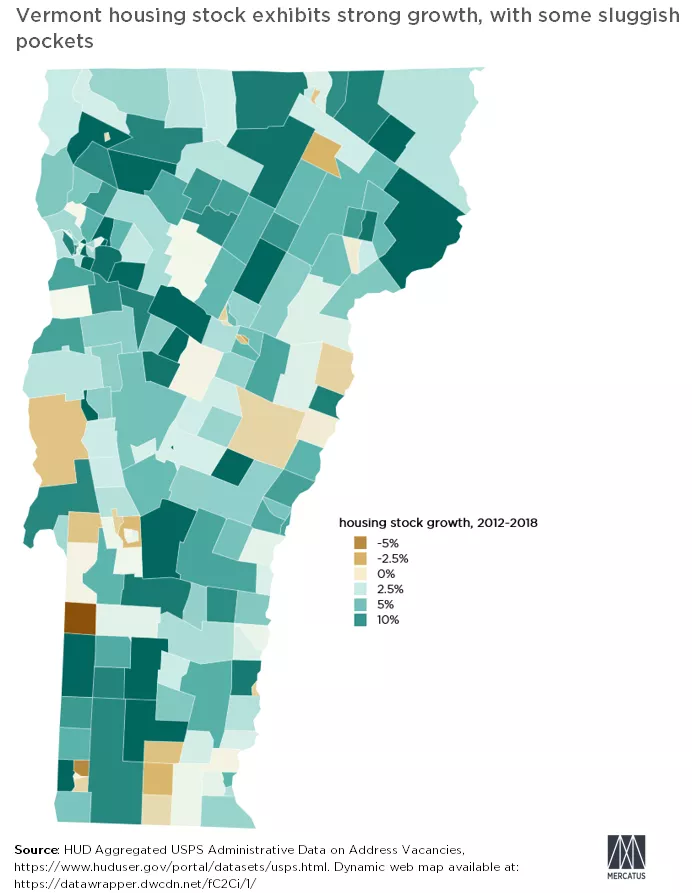
The map shows the rate of housing supply growth (in blue-green) or decline (in brown) by census tract. Since tracts are designed to be of roughly-equal population, clusters of small tracts indicate cities. In Vermont, most of those clusters are blue-green, with a few pockets of negative growth throughout the state. Indeed, one of the fastest-growing metropolitan areas in New England is located in Burlington, Vermont, which has suburbs that grew as much as 19.3 percent.
To further understand current housing growth patterns, read Housing Supply in the 2010s. For a dynamic version of the map, which provides granular growth and decline data on census tracts, click here.