Last week an article ran in the Warwick Beacon that was based on a chart I produced showing Warwick, Rhode Island’s municipal budget (excluding the school budget) carved up according to current costs for funding the town’s pension benefits, Other Post Employment Benefits (OPEB), current employee healthcare costs and General Obligation bond payments. The figures come from official budget documents.
This excerpt originally appeared at Neighborhood Effects
Last week an article ran in the Warwick Beacon that was based on a chart I produced showing Warwick, Rhode Island’s municipal budget (excluding the school budget) carved up according to current costs for funding the town’s pension benefits, Other Post Employment Benefits (OPEB), current employee healthcare costs and General Obligation bond payments. The figures come from official budget documents.
It caused quite a stir.
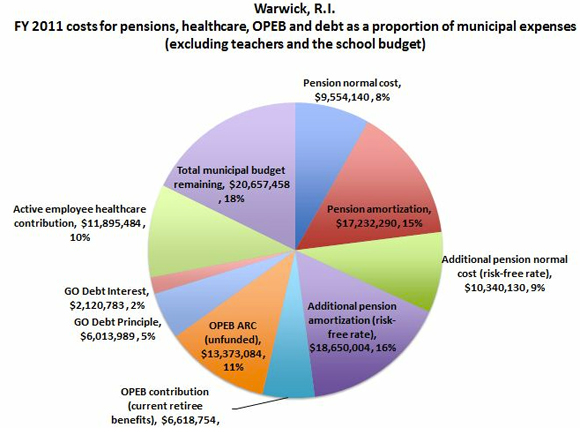
Here’s the question the chart addresses: If Warwick, Rhode Island were to fully fund employee benefits while paying healthcare costs for current retirees and active employees and make its annual bond payment, how much would be left over to fund everything else in the city budget?
Warwick operates four public pension plans: Firefighters/Police I Pension Plan, Fire II Pension Fund, Police II Fund, and the Municipal Employees Retirement System (MERS). Using these plans’ assumed 7.5 percent discount rate to value the liability, only one plan appears to be in deep distress. The Police/Fire I plan is 22 percent funded and requires an annual contribution of around $14 million. The remaining plans seem to be relatively well-funded. Together they add a further $12 million in annual contributions. In total, according to the pension valuation reports for the town of Warwick, fully funding these four pension systems requires an annual contribution of $26.4 million from the city.
Now, when valuing these four systems using the risk-free discount rate, the picture changes. The risk-free rate adds a further $29 million to the annual required contribution. Valuing these plans on a market basis doubles the annual contribution to $55.7 million. That’s 48 percent of the town’s municipal budget in FY 2011.
Employees also receive Other Post Employment Benefits (OPEB) - largely comprised of healthcare – in their retirement. If the town were to fully fund OPEB benefits for their current workers they would need to contribute a further $14 million. On top of this Warwick is contributing $11.8 million to pay for current employee healthcare benefits in FY 2011 (see, Annual Budget, FY 2013). I added in General Obligation debt (principle and interest payments) of $8.5 million, since I assume this is a non-negotiable expense for the municipality. That leaves Warwick with about 18 percent of its FY 2011 budget remaining.
On the Beacon article, I will underscore several points.
1) The risk-free rate matters. To value and fund a pension plan requires figuring out how much is needed to be set aside today to fund a promised benefit to be paid in future. One must equate the value of a pension to be paid in the future with its value today (the time value of money). That means one must assume a discount rate (i.e., rate of interest) to convert the future value into the present. That enables one to figure out the amount needed to be set aside today to fund tomorrow’s payments.
As most followers of the pension story know, in choosing that discount rate, public sector pension plans look to what rate of return they expect the plan’s assets will return when invested. Most public plans have assumed a rate of return of 8 percent on their assets.
Public pensions represent a secure, government-guaranteed benefit and are not likely to be defaulted upon. Public pensions should be valued like a government bond. The rate to use is the return on Treasury bonds, currently 2.3 percent.
But it’s the practical effect that many politicians and plan sponsors protest, as The New York Times story of yesterday highlights. Lowering the discount rate increases the liability and the amount needed to fund the plan. That has a real impact on the budget, as the Warwick chart shows.
2) Private sector defined benefit plans suffer from their own set of accounting and moral hazard problems, and they use a variety of discount rates for a variety of reasons. Public plans carry a stronger guarantee, as they are backed by government, and therefore should be discounted using lower rates than used by the private sector – not a higher one – as is current practice.
3) An investor doesn’t “get” an expected return. There is always a chance you will either do better, or worse, than expected. Yet the risk not achieving 8 percent annually is often ignored. (Or more accurately it is borne by future taxpayers and younger retirees.) Discounting benefits at a risk-adjusted interest rate captures the cost to taxpayers of having to supplement pensions should projected returns not be realized and the plan’s assets fall short.
You don’t calculate the employer’s annual payment to the pension system based on how the plan’s assets are expected to perform. Just as you don’t value your home mortgage based on what you think your 401K might do. This video developed by Nobel-Prize winning economist Bill Sharpe makes the case perhaps better than I can do in this blog.
The policy message the economics points to is unsettling. Defined benefit plans are in trouble and they will require more funding and difficult budget and policy decisions starting now.
And, who really wants to hear that?