- | Government Spending Government Spending
- | Data Visualizations Data Visualizations
- |
Fiscal Austerity in Europe Doesn't Mean Large Spending Cuts
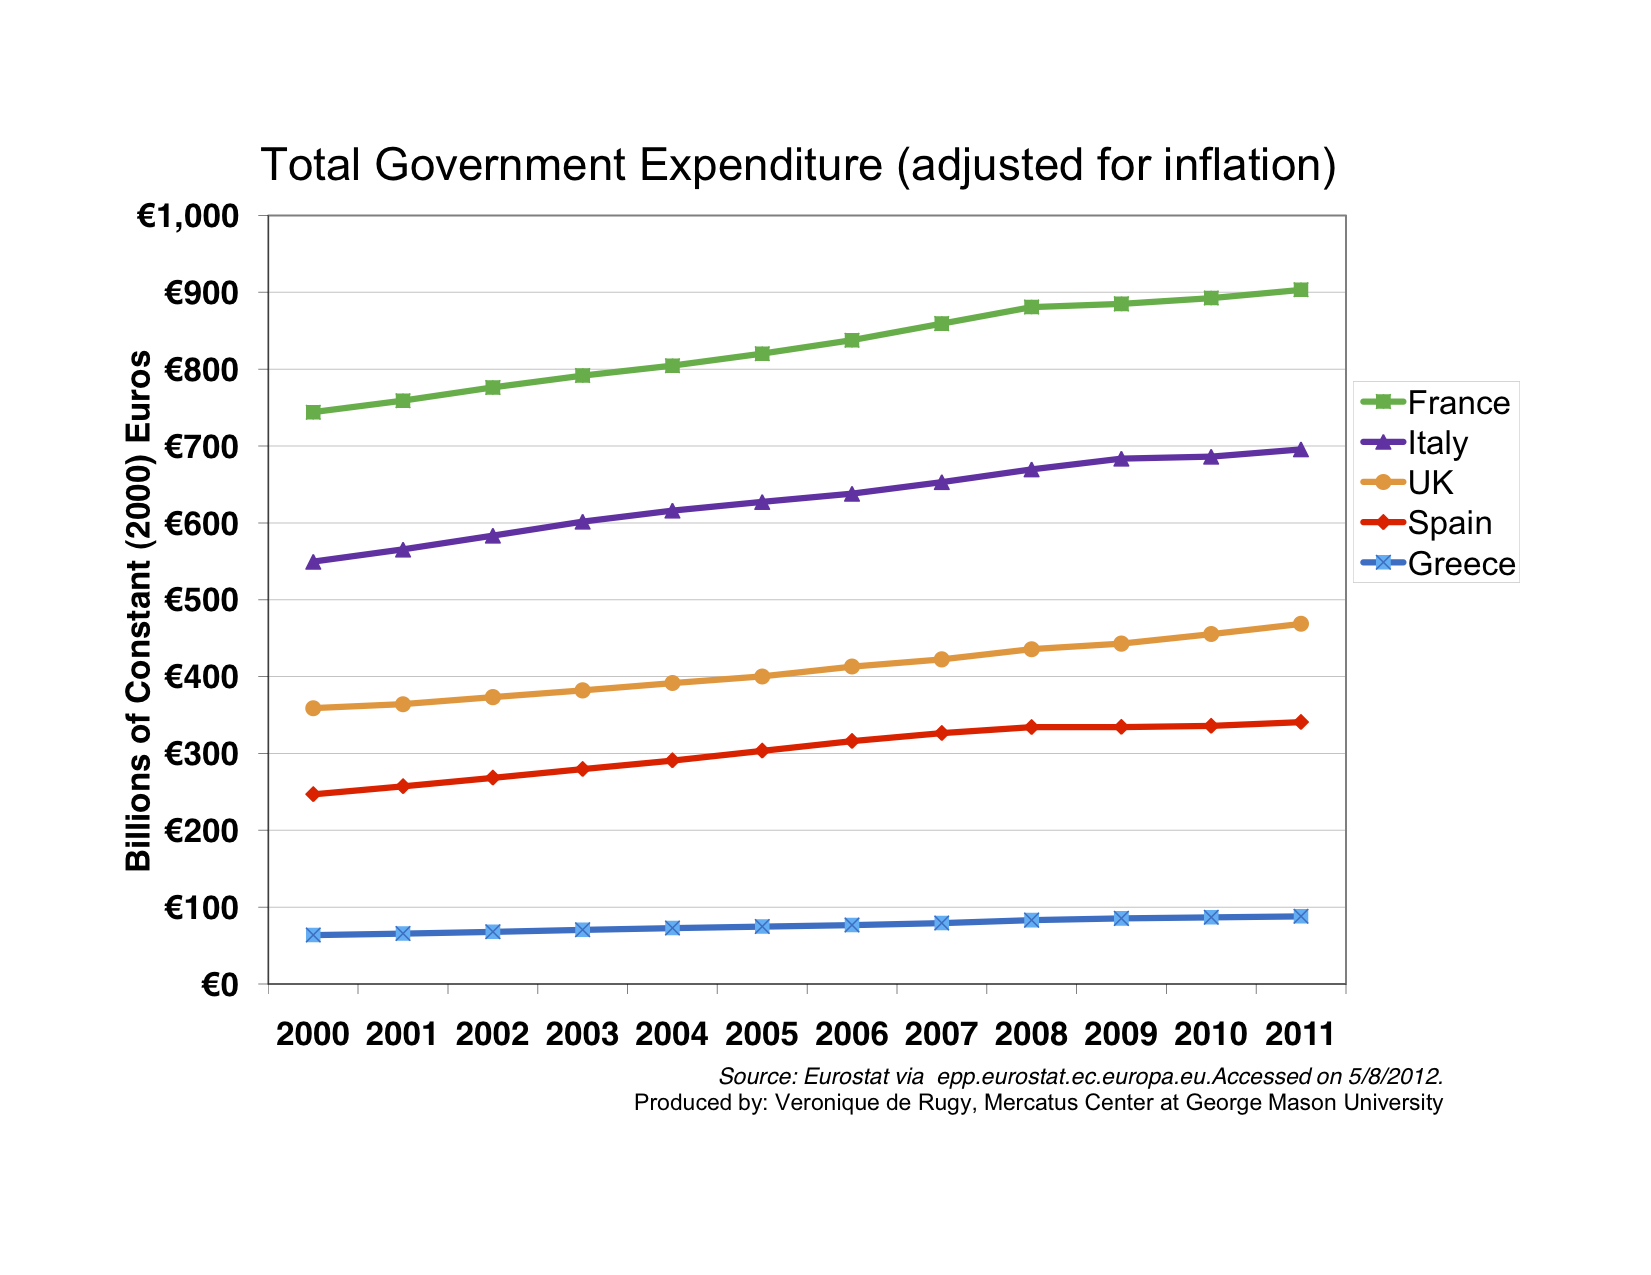
We are told that austerity in Europe has failed. The elections in France and Greece, for instance, are supposedly evidence of people’s opposition to severe cuts in spending. However, the growing anti-austerity backlash against Europe ignores one fundamental point: If there is austerity in Europe, in most cases it hasn’t taken the form of massive spending cuts.
We are told that austerity in Europe has failed. The elections in France and Greece, for instance, are supposedly evidence of people’s opposition to severe cuts in spending. However, the growing anti-austerity backlash against Europe ignores one fundamental point: If there is austerity in Europe, in most cases it hasn’t taken the form of massive spending cuts.
Following years of large spending expansion, Spain, the United Kingdom, France, and Greece—countries widely cited for adopting austerity measures—haven’t significantly reduced spending since “austerity” supposedly started in 2008.
First, France and the U.K. have not cut spending. Second, when spending was actually reduced—between 2009-2011 in Greece, Italy, and Spain—the cuts were relatively small compared to the size of their bloated European budgets. While Italy reduced spending between 2009-2010, it also increased spending in the following year by an amount larger than the previous reduction. Most importantly, meaningful structural reforms were seldom implemented. Whenever cuts took place, they were always overwhelmed with large counterproductive tax increases.
This so-called balanced approach—some spending cuts for large tax increases—has been proven to be a recipe for disaster by economists. It fails to stabilize the debt, and it is more likely to cause economic contractions.
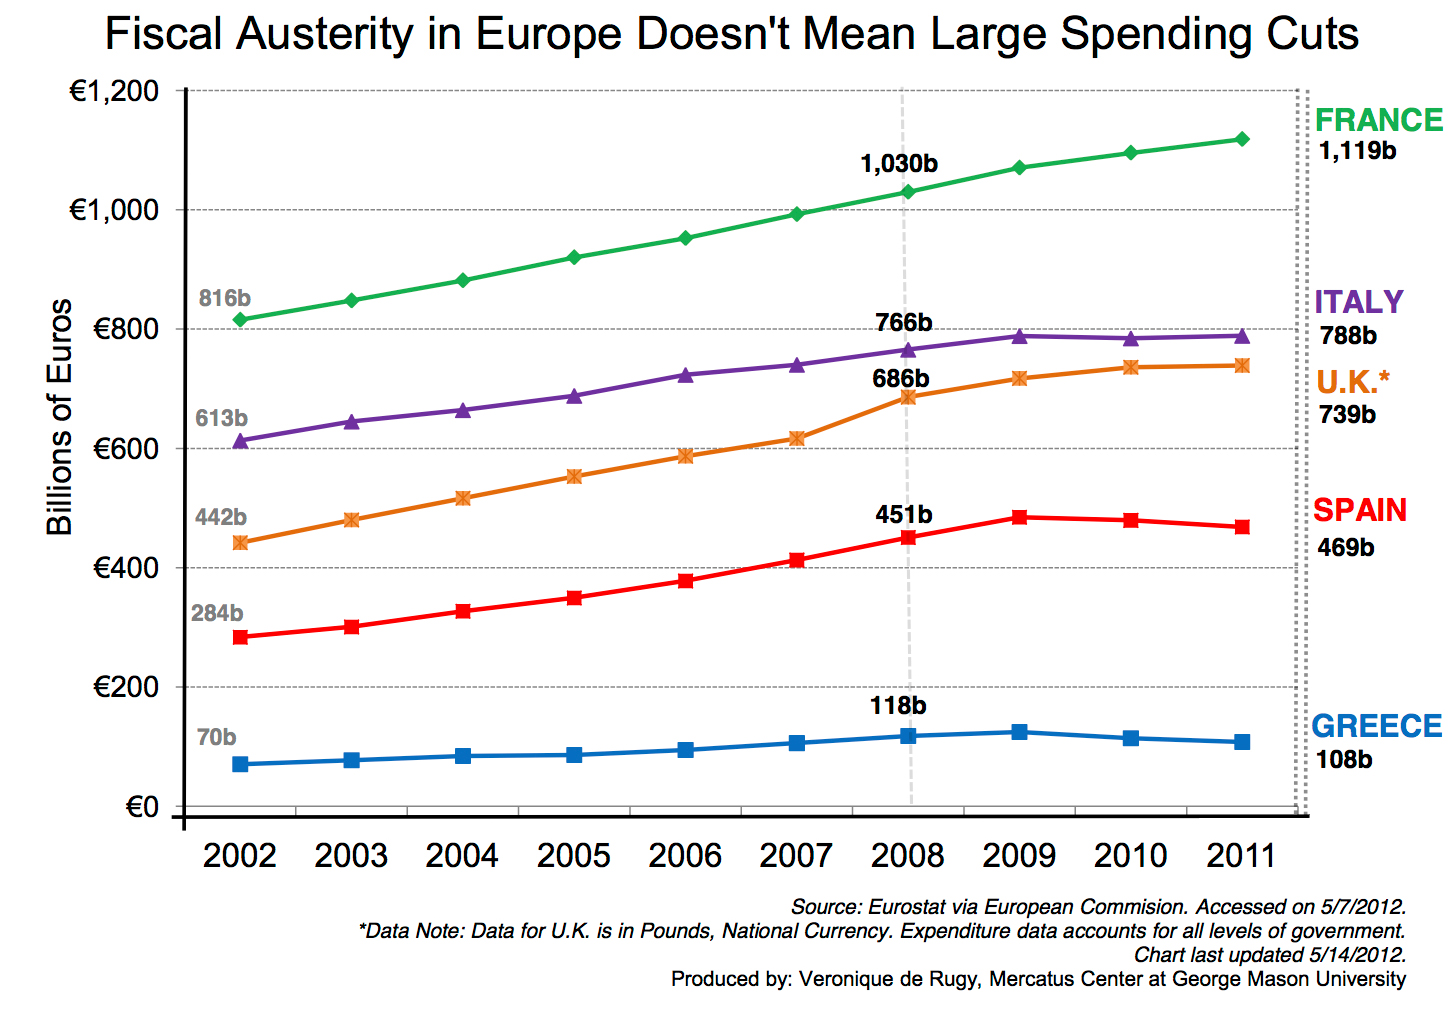
*Note: Data from Eurostat of the European Commission is used to chart total government expenditures for various Eurozone countries in Euros for the period of 2002 to 2011. Data for the U.K. is in Pounds, National Currency.
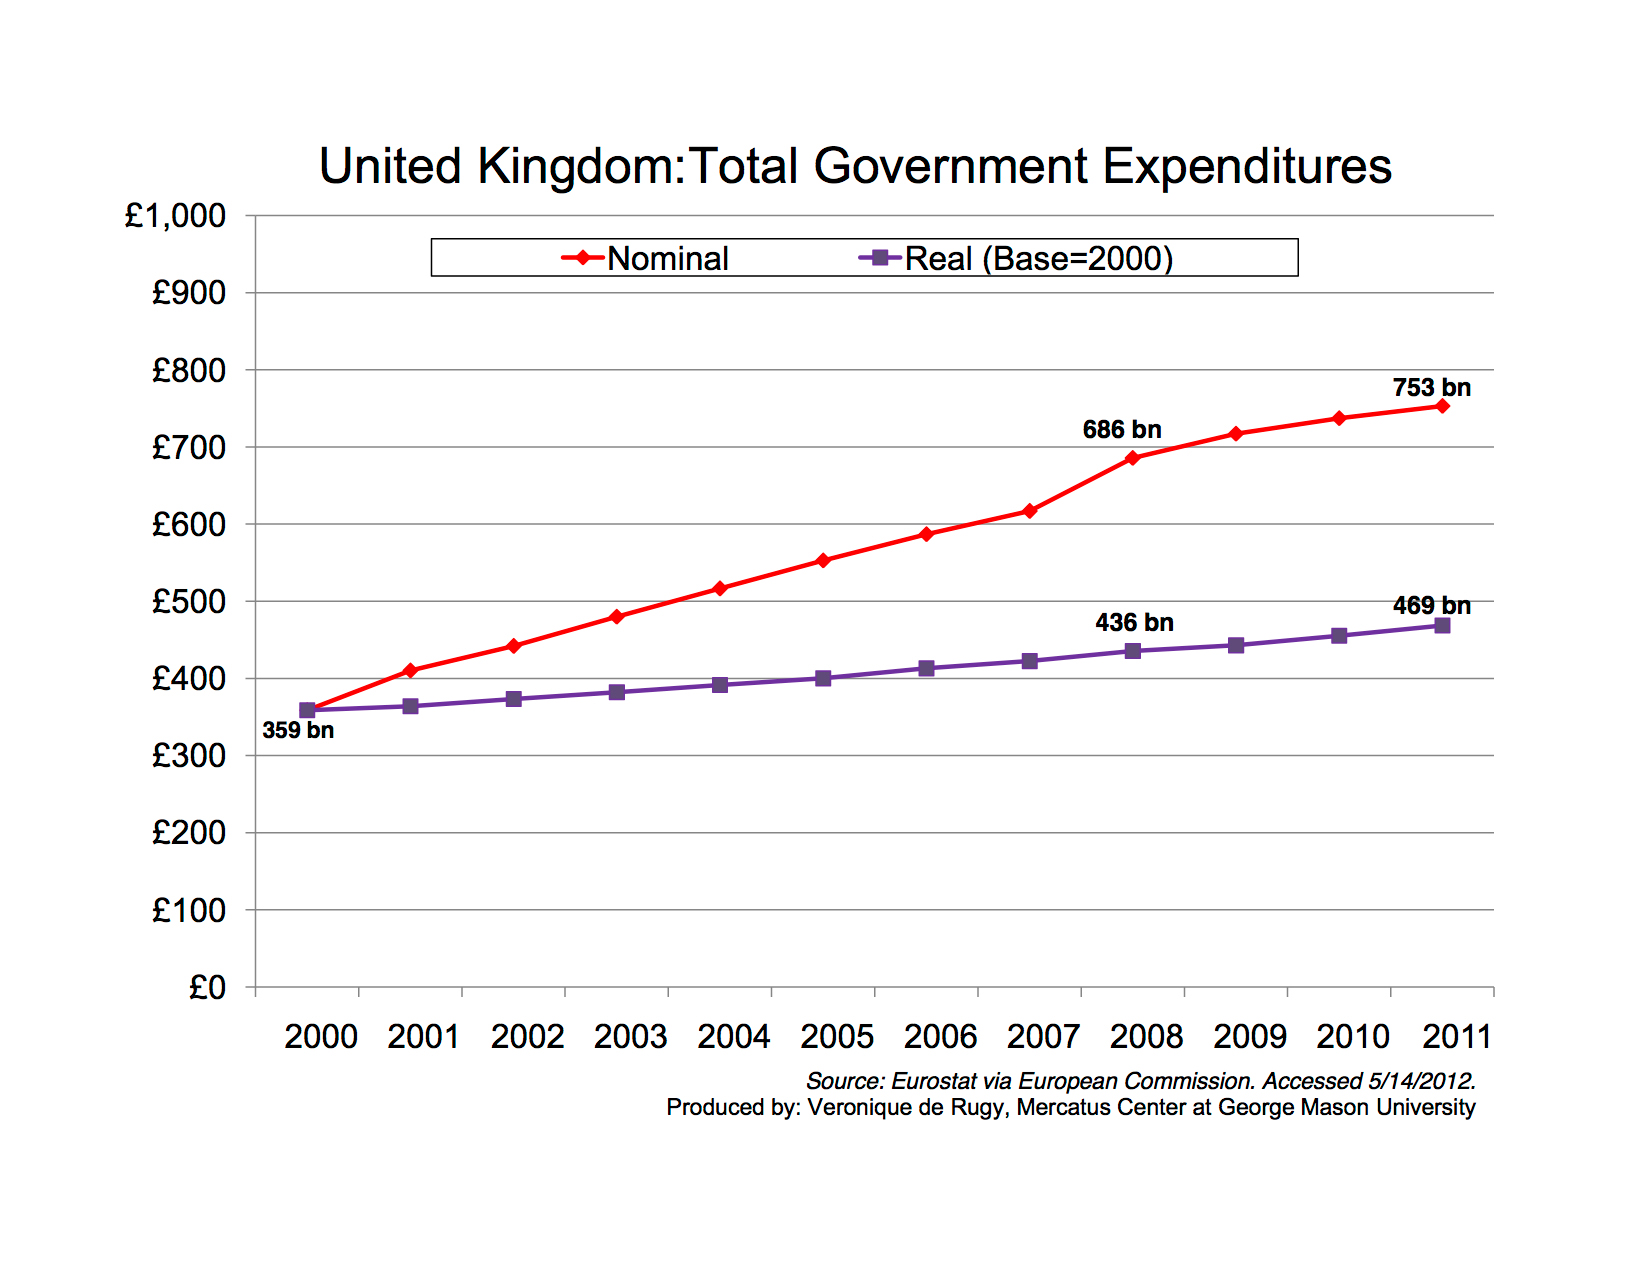
Data from the European Commission’s Eurostat is used to chart the United Kingdom’s government spending in nominal and real (adjusted for inflation, base year = 2000) Pounds.
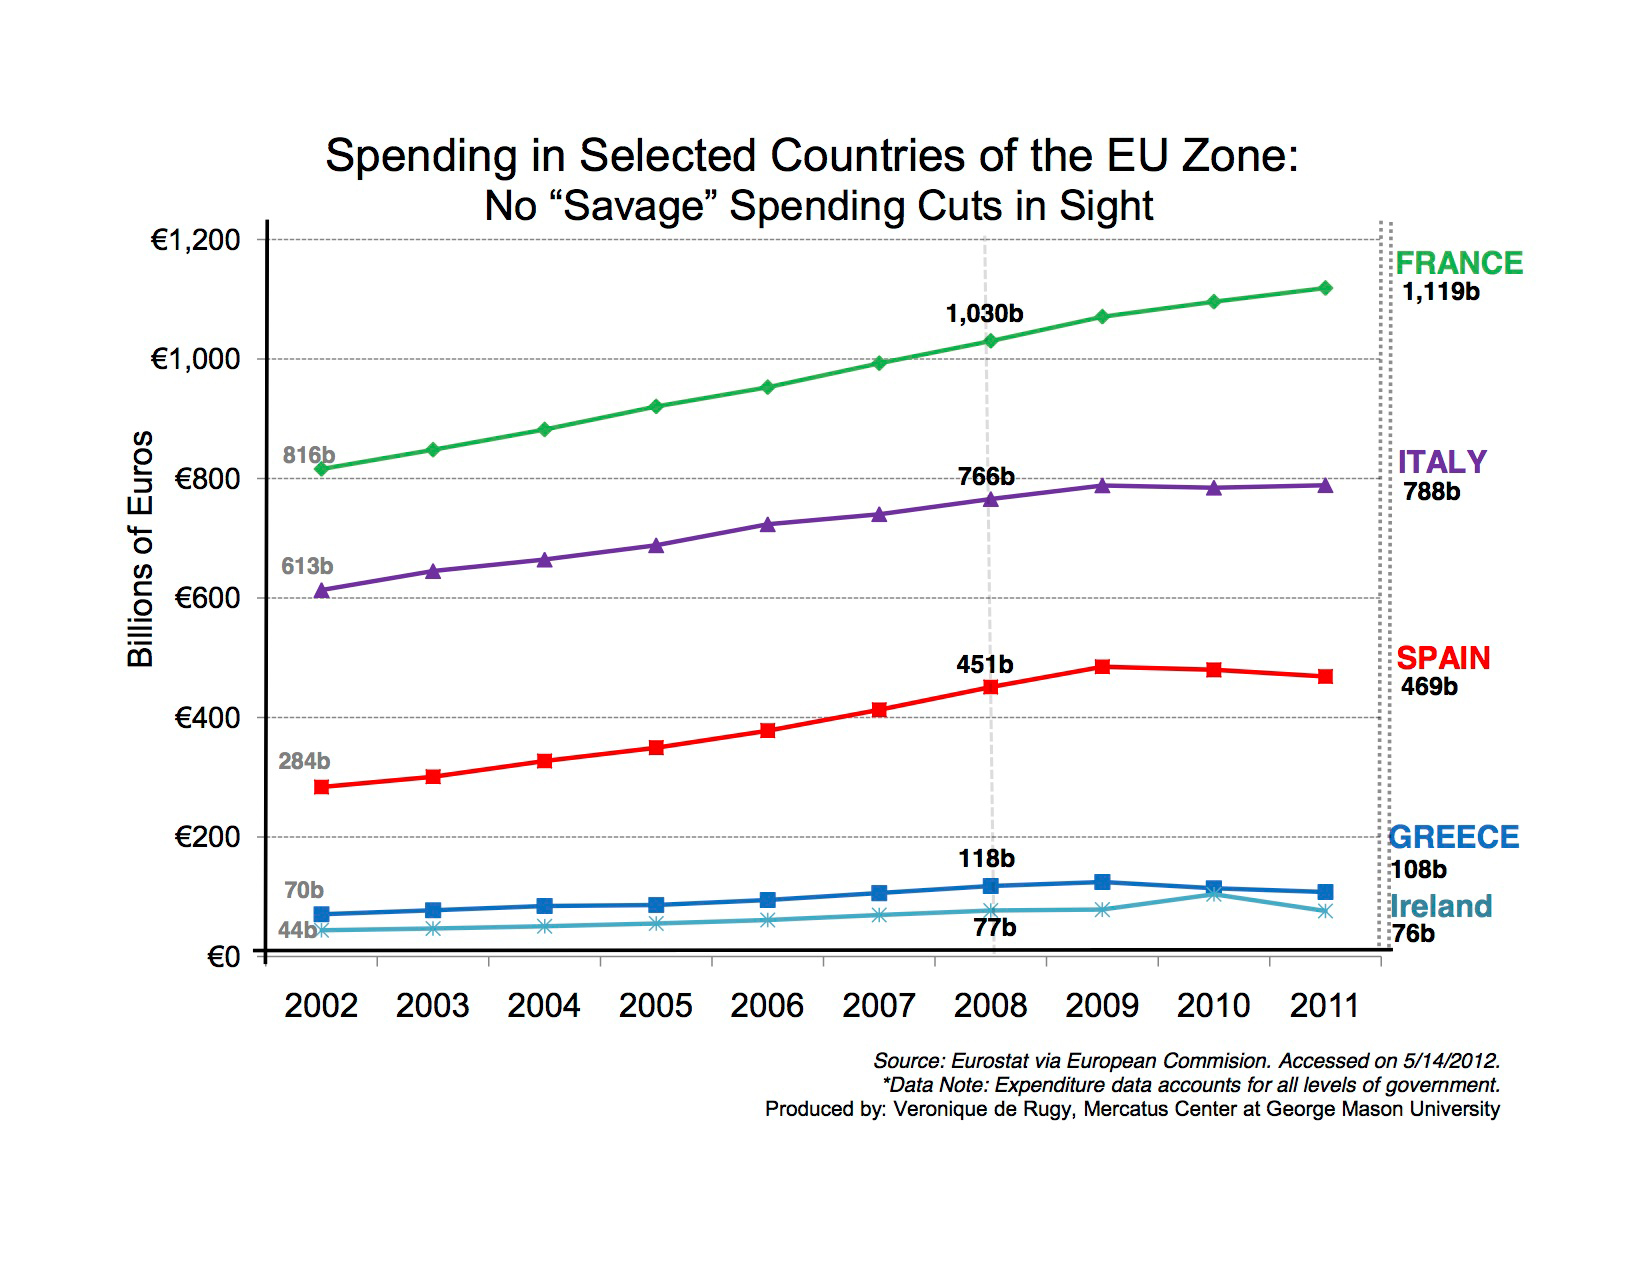
The chart below places Ireland’s spending in comparison with other select EU Zone countries. Data from the European Union’s Eurostat is used to chart total government expenditures in billions of Euro’s for the period 2002 to 2011.
This version of the chart shows government spending using OECD data that is adjusted using the purchasing power parity (PPP) exchange rate.
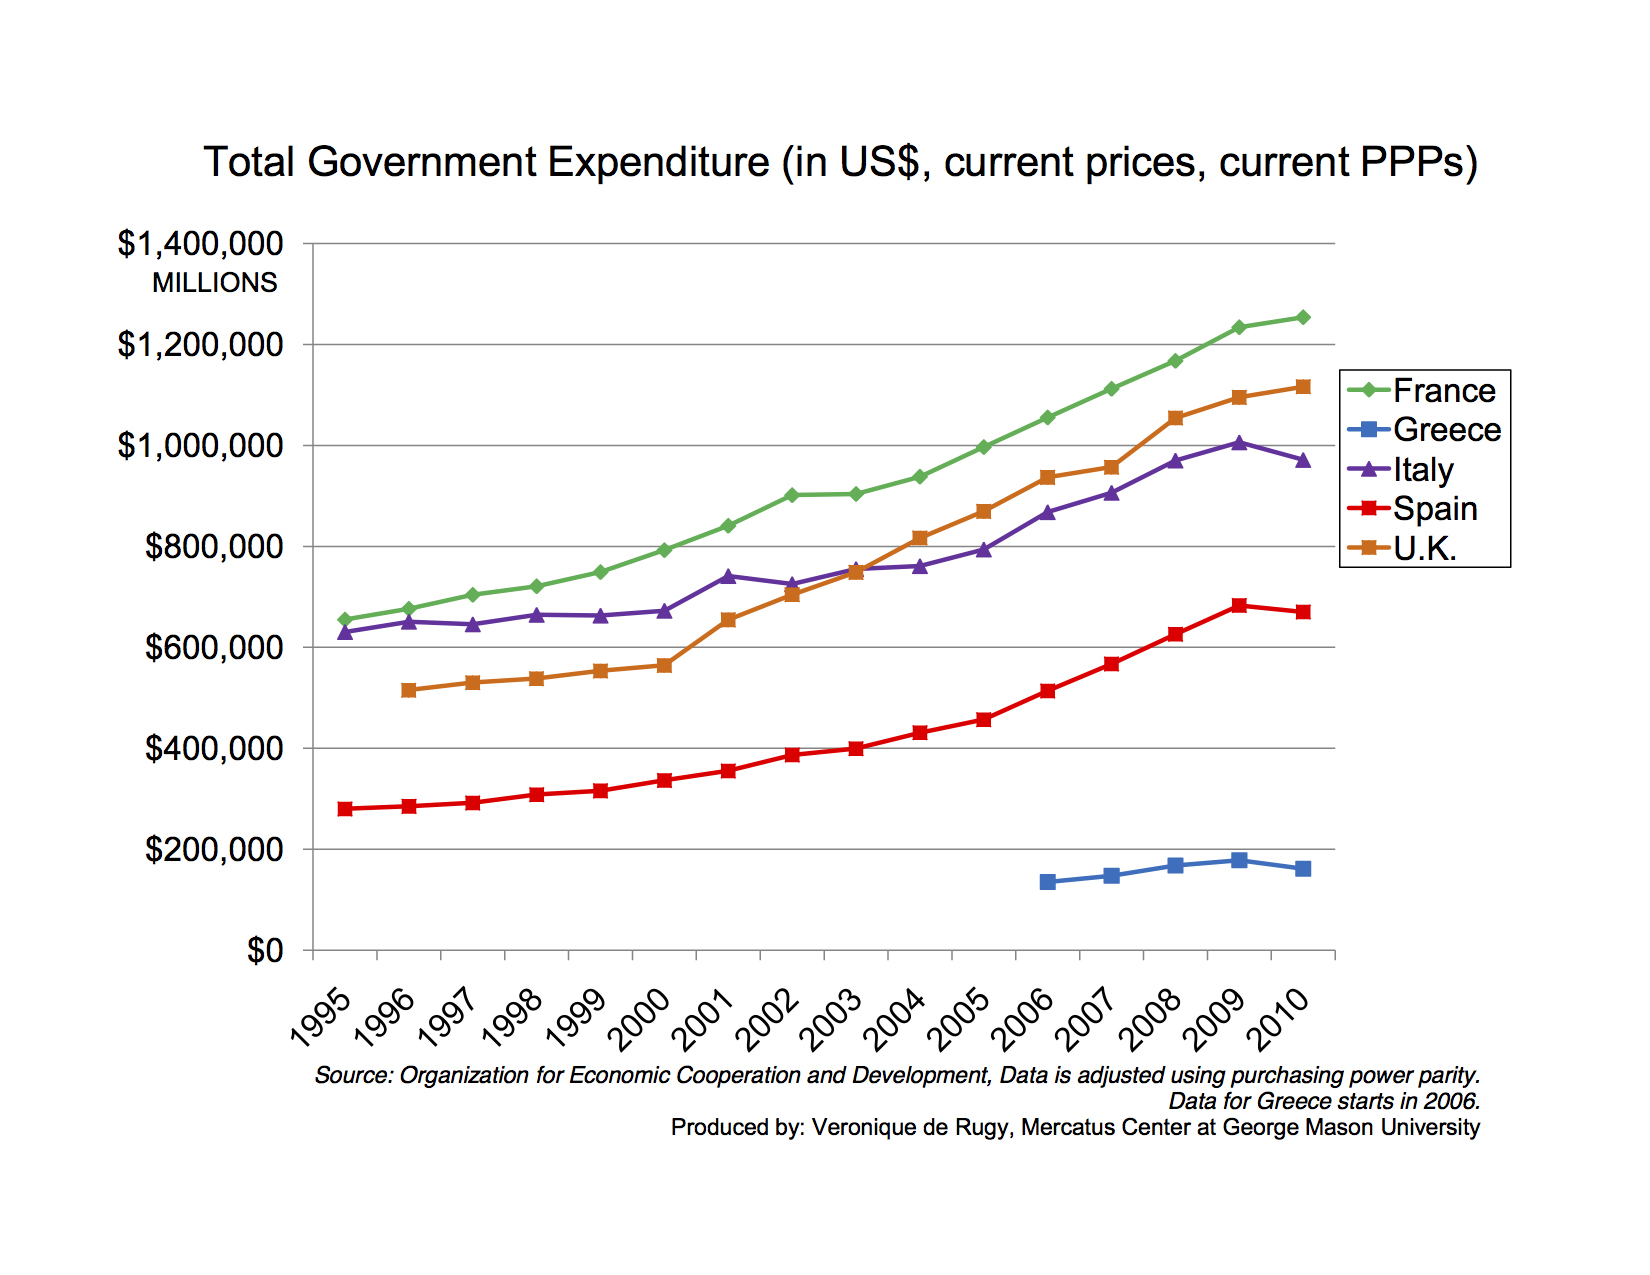
* Note: Data from the OECD is used to chart total government expenditures for various Eurozone countries in U.S. dollars for the period of 1995 to 2010.
This version of the chart shows government spending using Eurostat data that is adjusted for inflation using Eurostat deflators with base year 2009.
* Note: Data from the Eurostat is used to chart total government expenditures for various Eurozone countries in constant (2009) Euros for the period of 2000 to 2011.
For media inquiries, contact [email protected]
Related Content
- | Government Spending Government Spending
- | Data Visualizations Data Visualizations
Austerity By the Numbers

- | Government Spending Government Spending
- | Data Visualizations Data Visualizations
GDP Growth Rates: The Swedish Approach
- | Government Spending Government Spending
- | Data Visualizations Data Visualizations
European Austerity: Government Expenditures by Country
- | Government Spending Government Spending
- | Expert Commentary Expert Commentary
There’s Austerity and Then There’s Austerity


