- | Corporate Welfare Corporate Welfare
- | Policy Briefs Policy Briefs
- |
The State of State and Local Subsidies to Business
State and local subsidies to business are a significant factor in the distortion of the US economy. This is because subsidies, while not always bad policy, have major potential drawbacks that need to be considered any time such a policy is contemplated. In this policy brief, after examining those drawbacks, I address two major questions about state and local subsidies. First, how much do different states (and their cities) provide in subsidies to business? Second, how do states compare in the way they administer subsidies?
First of all, subsidies have the potential to decrease economic efficiency, which is defined as creating the most output for a given amount of inputs. Economists have long argued that subsidies tend to lead to overproduction of the good or service subsidized. This means that other goods and services are produced in quantities insufficient relative to demand. Moreover, investment incentives, those subsidies designed to affect the location of a particular investment, can lead to production in less-than-optimal locations, thereby reducing efficiency.
The very possibility of subsidies creates the opportunity for another source of inefficiency: rent-seeking. By this, I mean that owners of capital direct some of their efforts for generating profit into political lobbying and other activities that yield them above-market rates of profit (rents). In the practical world, companies have come to realize that they can use their site location decisions to extract rents from governments owing to the widespread availability of investment incentives. By chasing profit through government rather than through increasing efficiency, rent-seekers reduce potential economic growth. The tiny location subsidies of the 1960s would seem quaint today, and some companies have been able to extract incentives in excess of the amount of their investment. In my book on the auto industry, I demonstrate how companies have learned how to be more successful at their rent-seeking efforts, including the use of location consultants that exacerbate the information asymmetries always present in the site selection process. Companies always have an information advantage over governments when bargaining over site locations and subsidies because there is so much information available about locations and governments, and governments have no way to know critical information about companies, such as whether those companies are comparing competing alternative locations, what their true investment plans are, etc. Consultants can widen this gap by maintaining information on multiple locations, or even by conducting negotiations with governments without identifying the companies involved in the potential investment, for example.
These myriad contributions to economic inefficiency have the “payoff” of reduced economic growth. Thus, while the efficiency problems of subsidies may be hard to see, they have definite effects on the economy.
The second potential problem with subsidies to business is that they exacerbate economic inequality. The reason for this is simple: Subsidies transfer income from average taxpayers to business owners who have above-average incomes on the whole. This makes the posttax, posttransfer distribution of income less equal. In addition, subsidies reduce equitable treatment of otherwise similar economic units. The European Commission puts it quite simply: “A company which receives government support gains an advantage over its competitors.”
A third potential problem applies not to all subsidies, but to a significant portion of them: subsidies can be given to developments that cause environmental harm, such that it would be better not to construct the projects at all, let alone subsidize them! A common example is the subsidization of shopping malls in floodplains or even wetlands.
These potential problems do not automatically make using subsidies a bad policy—there may be other factors that outweigh the drawbacks. For example, creating jobs in low-income regions, advancing major technological innovations, or helping companies pay for large reductions in pollution are all possible reasons that subsidies could be justified. However, one always needs to be skeptical about proposed subsidies to determine whether in a given instance the benefits outweigh the costs.
Perhaps unsurprisingly, these multiple potential problems give rise to coalitions that strikingly illustrate the old adage that “politics makes strange bedfellows.” In general, in the United States, conservative and libertarian organizations are motivated by the efficiency critique, progressive organizations are motivated by the equity critique, and environmental organizations are motivated by the environmental critique. While opposed on other issues, they find themselves on the same side of the debate over subsidies. What other issue could put Ralph Nader and John Kasich at the same table?
A basic challenge when analyzing policy issues is determining the scope of the problem. I will begin by laying out a subsidy classification. Next, I present the state of the states (that is, how states vary in their incentive spending and in the way they administer subsidy programs). The spending data were derived by me specially for this report. For two aspects of subsidy administration—transparency and enforcement of agreements—I rely on the work of national nonprofit Good Jobs First, which has issued multiple reports on these issues since its establishment in 1998.
Types of Subsidies
This paper does not examine subsidies to individuals or money paid by nongovernmental bodies, so for the purposes of this work, a subsidy can be defined simply as money given to a firm by government. There are several ways to classify subsidies, but I will focus on the form of payment and the difference between subsidies in general and investment incentives in particular.
Regarding the type of payment, a close to exhaustive list would include the following:
- Cash grants and direct payments for which no goods or services are received. (This does not exclude other sorts of conditions on the subsidy, such as job creation by the recipient firm.) This method is the most common one in the European Union.
- Tax measures, such as special rates, abatements, exemptions, deductions, exclusions, and tax credits. This is the most common method of subsidization in the United States. Here one would also find apportionment measures, such as single sales factor (SSF), and mortgaging of future tax revenues in what is known as tax increment financing (TIF).
- Loans to firms, either at below-market rates or under circumstances in which private lenders would be unlikely to lend.
- Loan guarantees. Again, these will cause the interest rate to be artificially low or a loan to be made that would be unlikely to be made at all under market circumstances.
- Capital injections. Capital injections qualify as subsidies if they are made under circumstances in which a market actor would not invest.
- Guaranteed excessive rates of profit.
- Free or below-cost inputs such as land or electric power.
- Purchases of goods from firms at inflated prices.
Other methods of subsidization are no doubt possible, but the ones listed here account for virtually all business subsidies worldwide.
Investment incentives are subsidies designed to affect the location of investment. That is, they are given by governments to companies to induce those companies to invest within the governments’ jurisdictions. The most common reasons governments use such incentives are to increase employment and to increase the tax base. It appears that the smaller the jurisdiction, the more important it is to raise tax revenue rather than creating jobs. As I have written previously, “Voters do not expect a city of 20,000 residents to be responsible for overall macroeconomic outcomes.” The estimates in table 1 focus on the states, but I analyze how researchers can approach estimating local subsidies; all the details of this work are available on request.
The State of the States
In this section, I present data on the individual states, since state use of investment incentives varies widely in terms of amounts, transparency, and requirements for companies to keep their commitments. The financial data here are based on my own original analysis of previously collected data, while the transparency and enforcement information was gathered by Good Jobs First and used by permission.
The data in table 1 (see pages 9–10) on the amount of investment incentives was derived by reanalyzing the database assembled by the New York Times in 2012 for the series “The United States of Subsidies.” With a team of researchers, reporter Louise Story was able to collect a comprehensive set of state subsidy programs, which is the proper way of estimating total subsidy or incentive use, as opposed to trying to simply add up the reported figures for subsidized projects. Unfortunately, while the raw material was comprehensive, the researchers did not know that most of the programs reported were not actually subsidies. As I pointed out a few days after the series was complete, over five-eighths of the reported “subsidies” consisted of sales tax breaks that largely were not subsidies at all. In addition, there were further errors, such as the inclusion of net operating loss provisions for corporate income tax for two states—such provisions are part of every corporate income tax, but they are not subsidies.
The reanalysis I conducted, then, required removing most of the database entries by value (the sales tax nonsubsidies and other erroneously included programs) to determine what, by international standards, would actually be considered subsidies, something I did in order to estimate total state and local subsidies in my last two books. This provides data for every state (all of my analysis for this brief is available on request), something not available even in the excellent work by W.E. Upjohn Institute economist Timothy Bartik, “Panel Database for Incentives and Taxes.” Besides being useful for understanding incentive policy, the data presented here can help us better analyze why some states use incentives more than others do, and whether incentive use actually contributes to better economic outcomes such as faster growth, higher incomes, or lower unemployment rates. However, such analysis is beyond the scope of this brief.
Table 1 includes the scores and rankings of the states on transparency. This is of utmost importance because without information on what states are actually giving to companies, it is impossible to exert democratic control over policy or hold policymakers accountable for their actions. When I first began research into investment incentives in the early 1990s, not a single state required state or local governments to comprehensively report on the amounts and recipients of investment incentives (Minnesota was the first to require such reporting, in 1995). Now almost every state has some sort of reporting requirement, and of course the data have moved online. The transparency data in table 1 come from Good Jobs First, which scores the states specifically on their online disclosure.
Good Jobs First is also the source of the last element of data, comprising scores and rankings on how consistently states enforce agreements with companies that fail to live up to commitments made in terms of jobs, investment, or job quality. The score here incorporates both the level of performance requirements placed into individual investment agreements and the strictness with which states enforce the agreements. Taken together, these three measures will let us see the comparative state of the states.
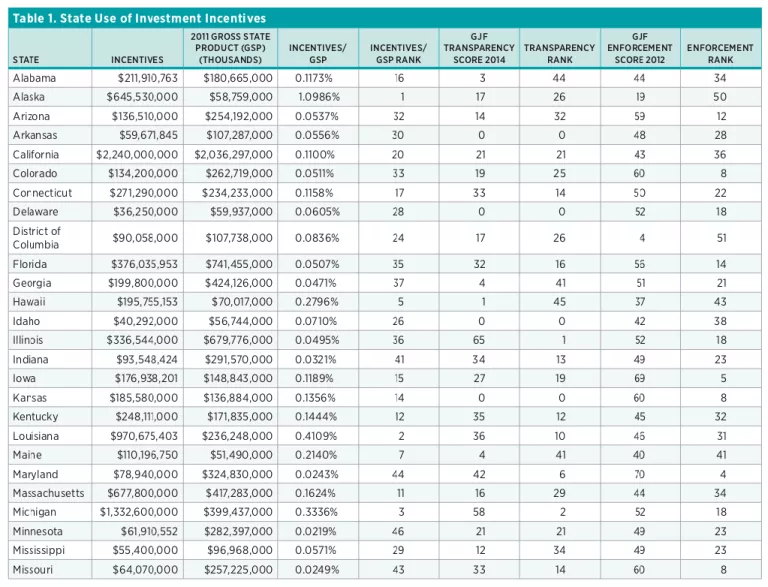
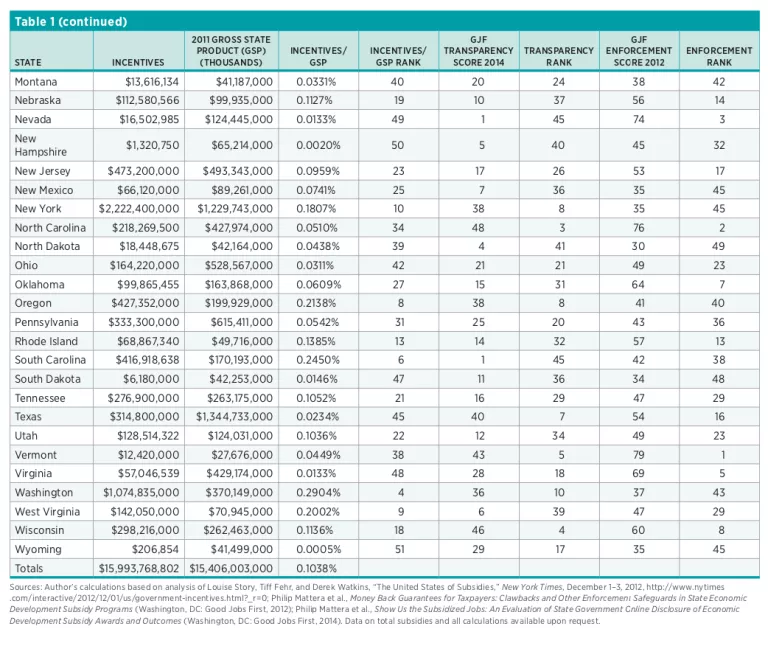
These finding show that the average state spends just over 0.1 percent of gross state product on incentives; the median state, Idaho, spent 0.071 percent. Top spender Alaska spent 2.5 times as much as the second-highest spender, Louisiana. As noted, it is important to find out what causes this variation among states and to determine whether incentive spending improves a state’s economic performance on such measures as unemployment, income, and economic growth. In a review of over 100 peer-reviewed studies, Matthew D. Mitchell et al. find little correlation between incentives and outcome measures.
Total spending by the states on investment incentives comes to just shy of $16 billion in 2011. If, as I have argued elsewhere,we assume that local incentives are approximately equal to state incentives—and I know of at least two states in which local incentives have regularly been higher than state incentives: California and Missouri—this would give a state and local total of $32 billion. In fact, this number is lower than most recent estimates (such as my estimate from 2011 [$46.8 billion] or Bartik’s from 2017 [$45 billion]) but still in the same ballpark. Arriving at the same order of magnitude using three different methodologies (extrapolation from well-performed state estimates, simulation based on tax and incentives for representative firms in 32 states and the District of Columbia, and program-based totals for all states) strengthens the research community’s confidence that the estimates are correct.
A word about these methodologies: In the older estimates contained in my last two books, I examined existing state-level studies of location incentives, total subsidies, or both received by businesses in those states. These were performed by nonprofit tax and budget organizations, but they varied widely in quality. Using my knowledge of the state of the art of this analysis embodied in work by the European Commission and the Organisation for Economic Co-operation and Development, I weeded out entries that would not be considered subsidies in an international context, and I also excluded studies if they could not be made to reasonably conform to international standards. In both Competing for Capital and Investment Incentives and the Global Competition for Capital, this process yielded usable data for states making up about 30 percent of US GDP. I then extrapolated the figures to the entire country by multiplying by approximately ten-thirds (the inverse of 30 percent). This is a crude approach, but given the state of data availability at the time, these were the best estimates that could be made. I made separate calculations for investment subsidies and total subsidies.
Bartik’s 2017 study is based on what is called a “representative firm” approach, where the characteristics of “average” firms in various industries in 32 states plus the District of Columbia are used to simulate the effect of available tax incentives on the operations of the firms. The simulations take into account taxes, labor costs, subsidies, and many other factors in each jurisdiction. Since these states make up a large majority of US gross domestic product, much less extrapolation was needed than in my earlier studies. His report covers only location subsidies, not total subsidies. However, Bartik’s report has individual estimates for the years 1990–2015, making it extremely useful.
The New York Times database that my new figures are based upon covers every state and the District of Columbia; therefore, no extrapolation is required. While the data are comprehensive, the analysts at the Times included too many programs (overwhelmingly sales tax breaks) that are not truly subsidies. For this report, then, I went through each state’s programs to make the data comparable to international studies of subsidies. Given that $50 billion of the $80 billion figure reported consisted of such sales tax breaks (and a few other nonsubsidies), a great deal of paring down was required to achieve comparability. Although this report only presents the results for investment incentives, I also estimate total state subsidies to business, and those data are available on request. The figures reported here only cover the one year in the Times database, 2011. I had hoped to replicate these figures through 2015 but did not have the resources to assign a research team to the task for 10 months, as the Times did.
As far as transparency goes, as of the most recent Good Jobs First ranking in 2014, the best states were Illinois, Michigan, and North Carolina, in that order. At the other end of the scale, four states had no online disclosure at all: Arkansas, Delaware, Idaho, and Kansas. The good news is that there is now a 20-plus-year trend of improving transparency, one that will only be intensified by the new rules on tax incentives introduced by the Government Accounting Standards Board (GASB) in 2017 (see the following paragraphs).
In terms of enforcement of agreements through mechanisms such as clawbacks of subsidies when an investor does not fulfill its commitments to the state, the top three states were Vermont, North Carolina, and Nevada, as of a 2012 Good Jobs First report. The District of Columbia, Alaska, and North Dakota recorded the three lowest scores. As with transparency, there has been a general trend over time to better protect the public interest; however, there is nothing analogous to the GASB rules that will promote widespread simultaneous improvement.
Several of the results here stand out. Not only does Alaska have the highest incentive/GSP ratio, it is in the bottom three for enforcement and exactly at the median (number 26) in terms of transparency. This is not a promising combination for Alaska taxpayers. A rather unusual case is North Carolina: even though it is number 3 in transparency and number 2 in enforcement—making it one of the top states overall for good economic development practices—it has been known to wildly outbid its competitors for specific big-ticket projects. The biggest example came in 2004, when it offered Dell Computers a whopping $280 million—nominal, not present value—incentive package to open a computer manufacturing facility in Winston-Salem. By contrast, neighboring Virginia offered Dell only $38 million for the same project. Something was clearly askew in North Carolina’s economic valuation of the Dell plant, and the cited report devotes over 50 pages to tease out multiple problems identified.
As one can see, there is great variation between states in both the overall use and the administration of investment incentives. The material in table 1 can help researchers understand the policy issues involved and potentially help explore the causes and effects of investment incentive use.
Conclusion
While location subsidies have been used for over 100 years, starting with competition for railroad stations, it was only beginning in the 1970s that the incentives for individual projects and overall spending began to grow significantly. Good Jobs First considers the first “megadeal” to have been Pennsylvania’s $100 million subsidy package for Volkswagen in 1976. Bartik documents the further growth of location packages during the 1990s. As these subsidies have grown, they have emerged as an important political issue.
However, discussion of the effects of and proper policy toward investment incentives has been hampered for decades by a lack of transparency about subsidy use. The details of individual incentive packages have often been deliberately shrouded in secrecy. The question of total national subsidy and incentive spending by state and local governments has long been difficult to approach because of a lack of data sources for many states and thousands of local governments that provide these subsidies. While there has been slow but fairly steady progress on this front on the state level since the mid-1990s, tracking local subsidies has been largely impossible beyond a few programs in a few states. This is changing with the 2017 introduction of new rules by the GASB, contained in Statement 77, which require state and local governments to publish substantial information on tax-based subsidies (the overwhelming majority of local subsidies are tax-based) in their Comprehensive Annual Financial Reports (CAFRs). Greg LeRoy reports that the first CAFRs incorporating Statement 77–compliant disclosure are very uneven in their reporting, from woefully incomplete to surprisingly forthcoming. However, until CAFRs are uniformly complete and informative, which unfortunately may take many years, what has and will take their place as best as possible will be national estimates based on fragmentary data for state and especially local governments.
With the new estimate for incentives presented here, the excellent complementary work by Bartik, and increasingly accurate data from state and local government CAFRs becoming available in the next few years, researchers are poised for a breakthrough in subsidy transparency that should greatly improve the knowledge base for making good policy for state and local subsidies and investment incentives. In addition, the reporting on variation in subsidy administration will help identify areas for improvement and lead to better outcomes for taxpayers when incentives are used by governments.
Acknowledgment
I want to thank the Mercatus Center at George Mason University’s Equity Initiative for commissioning this research, and I want to thank Nolan Gray for research support. Matthew D. Mitchell and Tracy Miller provided helpful comments on a previous draft.

