As I write this report, the US economy is operating along a bumpy path defined more by the coronavirus and reactions to it than by the inherent dynamics of the economy itself. Yet while the path is bumpy and GDP growth puny, America still has a large and active economy. Think about it this way: an economy with 10.2 percent unemployment—the rate reported on August 7—is an economy with almost 90 percent employment! And in this “90 percent economy,” construction activity is taking off, existing home sales are rising in association with historically low interest rates, leisure and hospitality employment is on the increase, and manufacturing, especially in wood products, textiles, and furniture, is showing strength. But this is now. The picture was not so pretty a few weeks ago.
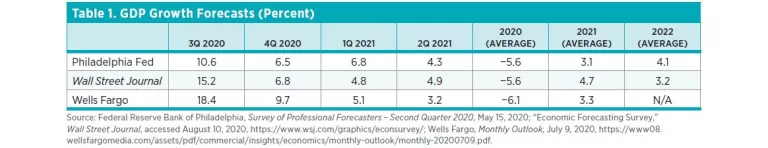
When we look back to the Commerce Department’s recently reported readings on second-quarter GDP growth, we find that the shuttered economy shrank by 8 percent. The annualized change, −31.7 percent, was the largest quarterly decline in the history of the data series. When asked when will we again enjoy what might be called normal economic activity, meaning a steady GDP growth of 3 percent or more and a 5 percent unemployment rate, I expect it will be 2021’s first quarter for GDP growth and 2021’s third quarter for the lower unemployment rate. By way of support for these thoughts, table 1 provides recent GDP growth forecasts for the Federal Reserve Bank of Philadelphia’s survey of professional forecasters, the Wall Street Journal’s 60-economist survey, and Wells Fargo. Notice there is full agreement that the third quarter will show strong recovery from the second quarter’s grim number and that growth for subsequent quarters will begin to look more normal.
In the March 2020 “Economic Situation” report, I noted that the US economy has become a command economy, one that is driven by the pace of the coronavirus contagion and steps taken by governments at the local, state, and national levels to shutter economic activity in an effort to reduce the pace of contagion. Unlike a more normal market economy where the process of supplying goods and services by privately owned businesses provides the bulk of consumption- and investment-enabling income, the coronavirus command economy severs the link between supply and demand.
In the coronavirus economy, large increases in federal government transfer payments to households can generate gains in personal income, but, unfortunately, the supply-side effect that could generate goods, services, and employment is muted by closures to parts of the economy. Still, what I previously called the 90-percent economy is chugging along. So let’s take a closer look.
In the remaining sections of this report, I first examine more closely the macroeconomy and ask if the worst of America’s coronavirus recession is now in the past. The affirmative discussion reports on some key indicators and examines mixed evidence on economic recovery across the 50 states. The section that follows looks at the yawning federal deficit and where the dollars are coming from to support America’s coronavirus-related expenditures. To the extent that it takes dollars to buy US Treasury bonds, the section briefly examines how readily America’s trading partners can fund its fiscal deficit, given the recent episode of trade-limiting tariffs from the Trump administration. Turning to regulation briefly, the report then addresses advances being made in the design of “green” investment opportunities for those who seek to affect the behavior of firms and organizations that operate in the global economy. The state spotlight section follows—this time, Oklahoma is featured. The report concludes with reviews of three books from Yandle’s reading table.
The US Economy Enters 2020’s Third Quarter: Is There a Turning Point?
In late July, when the Department of Commerce announced the second estimate for second-quarter GDP growth of a bone-chilling 31.7 percent decline, Congress was debating another multitrillion-dollar relief package for America’s beleaguered, coronavirus-fatigued population. The gridlock ultimately led to a series of presidential executive orders that, in conjunction with state-provided supplements, sought to extend unemployment benefits for the more than 20 million unemployed. Together, the federal and state supplements were designed to provide $400 per week in benefits. Previously, an unemployed person received $600 a week. At the time of this writing, the final outcome of the White House–Congressional standoff is yet to be resolved.
While America’s legislators deliberated and coronavirus infections rose in several states, current US economic activity was improving. For example, a hard look at unemployment claims data indicates that weekly claims peaked at 6.867 million in the week ending March 28 and then fell, hitting 1.482 million claims for the week ending June 20 and stubbornly staying at about that level until August 6, when 1.186 million claims were filed. The trend is optimistic. While layoffs remain at a high level—a year ago the weekly average for new claims was in the 200,000 range—monthly data on new hires indicate that more than six million were added to payrolls in May, some four million were added in April, and five million were added in March. Indeed, April seems to have been a turning point.
On the positive side, Americans also saw strength in June retail sales, which rose 7.5 percent for the month, following an increase of 18.2 percent in May. Sales had fallen 14.7 percent in April. Here, the data include a wide variety of items, including autos, furniture, clothing, and sports gear. And interestingly enough, while retail sales overall rose in June, online retailer sales fell 2.4 percent. The data suggest not only that April was a turning point, but that folks are getting out and enjoying shopping the old-fashioned way.
What about other parts of the economy? Does an April bottoming-out appear elsewhere? If so, does this give reason for a bit of optimism? The answer, I believe, is Yes. Housing starts, which showed a nice June surge, have almost moved into positive-growth territory when measured on a year-over-year percentage-change basis. And note this: the deceleration in housing starts that accompanied the virus recession bottomed out in April.
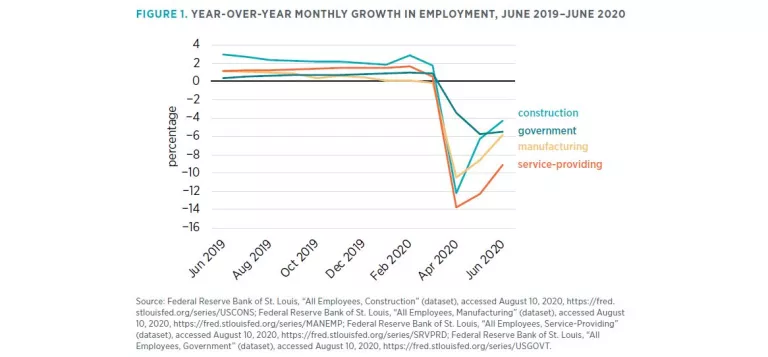
In figure 1, I show year-over-year employment growth for the economy’s four major sectors. Notice that April is the turning point for construction, which is the most robust of the four sectors reported, and also for manufacturing and services, but not for government, which seems to get a positive bump in May. In three cases, the turning points mark a time when negative growth begins to be less negative! Carving into the government data reveals that state and local government employment continues to fall at a faster pace than federal government employment growth, which has been seemingly undisturbed by the coronavirus recession. Part of the federal government’s stability may be explained by Census Bureau hiring.
But does this turning-point analysis suggest that Americans can all rest easier? Well, maybe just a wee bit. As we all know, America’s coronavirus pandemic moves on a bumpy path. Some regions are now easing restrictions after engaging in severe public health battles to control virus outbreaks. But other states that relaxed and reopened parts of their economies in April and May are reversing their positions. So far, though, additions to the unemployment rolls are not accelerating; retail sales are increasing; and employment growth for three important economic sectors is headed toward positive territory.
How Things Look across the 50 States
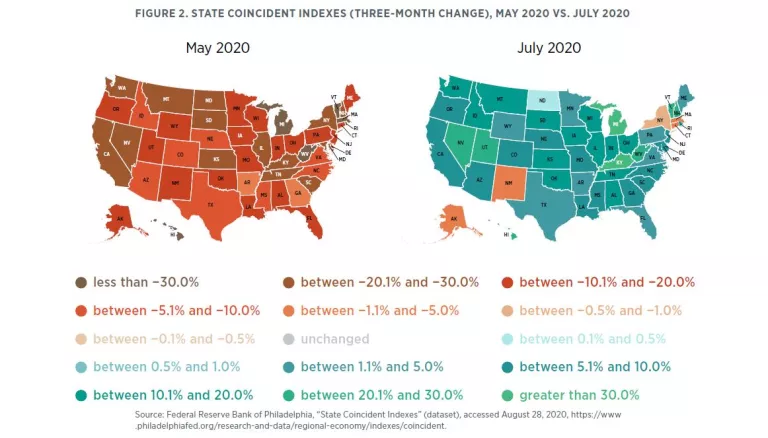
The latest report on coincident economic indicators from the Federal Reserve Bank of Philadelphia helps provide perspective on how things looked through July across the 50 states. To make it easier to assess progress, figure 2 shows the May and July maps. The May map looks bleak: the three-month coincident index change is negative for all 50 states. By remarkable contrast, the July map shows positive growth for all states except Alaska, Connecticut, Massachusetts, New Mexico, and New York. Overall, the data show a happy trend.
Effects of the Resurging Virus
This release of the state coincident indexes came before the full effects of the July coronavirus surge across the Sun Belt and other areas could be assessed. Common sense suggests that state actions taken to once again tighten limits on crowds in virus hot spots will diminish economic activity. Thus, the happier trend observed in the May–July data may be affected.
Hints of weakness are seen in the Conference Board Consumer Confidence Index, which fell to 92.6 in July after having risen to 98.3 in June. A practical picture of what happens when people are frightened and restaurants are shut down comes from Open Table in figure 3, which shows the percentage of US restaurants taking reservations over the late spring and summer.
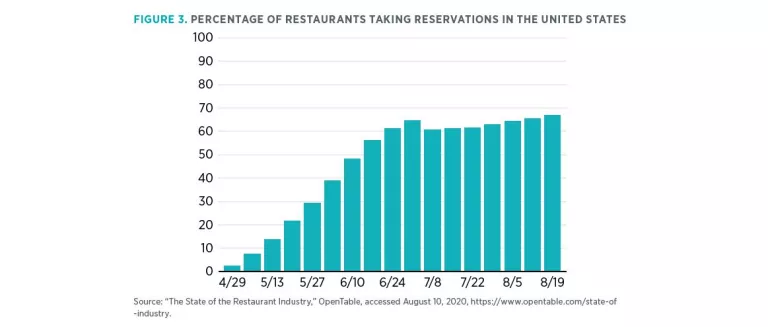
Notice how the bars stop growing after July 1 but again show some recovery on August 5. (Not all the data are discouraging, however: the American Staffing Association’s weekly index measuring growth in temporary and contract employment rose to 69.7 for the week ending July 19, after having been as low as 59.9 for the week of May 10.)
An even more persuasive picture of a stalled economy is seen in a newly created index of mobility and engagement developed by the Federal Reserve Bank of Dallas. The Dallas Fed index is based on population movement traced by cell phone technology (without, I should add quickly, compromising individual privacy—or so it is claimed). The data provide evidence on the extent to which people are venturing away from home and staying out longer when they do so. The Dallas Fed data indicate that the mobility that was increasing through June 27 is now stagnant.
How Increased Saving (and Decreased Spending) Is Holding America Back
So, what does all this say about GDP growth prospects and efforts by Congress to bring balm to the American people? First off, balm is always welcome, but don’t expect another round of cash to give new energy to America’s flagging economy. So far, much of the cash income received by Americans has gone into savings. On July 30, when the Department of Commerce reported the first estimate for the second quarter’s GDP growth, the agency also provided a supplemental table that explained what had happened to total personal income for all Americans taken together. The table shows the essence of the challenge Congress faces in coming up with an aid package that both assists struggling households and gives a shot in the arm to a coronavirus-stricken economy.
Surprising at first blush, the data show that personal income rose by $1.3 trillion in 2020’s second quarter. Of course, the increase came as result of an increase of $2.4 trillion in government-provided benefits that came in the form of income supplements, unemployment benefits, payroll protection plans, and other coronavirus-related funding. As a result, personal savings rose to a level of $4.7 trillion, which was a one-quarter increase of $3.1 trillion. Meanwhile, consumer outlays fell by $1.6 trillion. After all, much of the economy was closed down. With nowhere to shop, consumers tucked the money away for better days.
Of course, this aggregate accounting hides what is surely happening for many US families. There are more than 20 million unemployed, and the largest share of those is low-income earners who previously worked in hotels, restaurants, and drinking establishments. It is unlikely that the increase in savings is coming from these poor, unemployed Americans. Nonetheless, the Department of Commerce data tell us that all Americans taken together are doing just that.
Who’s Funding the Coronavirus Deficit? Shouldn’t We Thank Them?
According to a newly released Congressional Budget Office report, the federal government ran a $2.7 trillion deficit in fiscal year 2020’s first nine months. This extraordinarily high deficit was about $2 trillion more than the government red ink registered in the same period in 2019.
What a difference a year makes!
This increase was generated by federal programs designed to stimulate the virus-beleaguered economy, assist struggling businesses, and provide relief for the tens of millions who are out of work and hurting. From all indications, we can expect to see even more deficit spending as the economy continues to stumble forward.
All this deficit spending business—even if it’s necessary—can sound a little too easy. Congress appropriates another trillion-dollar relief bill, the president signs it into law, and the Treasury provides the bucks. But from where? Who’s supplying the money?
Well, the Treasury sells bonds and Treasury bills to US corporations, state and local government entities, American citizens, the Federal Reserve, and foreign citizens and governments, which it will pay back with interest. Right now, US investors are putting lots of their cash into Treasury bills. There aren’t many other places to put excess cash right about now.
But, as many have probably heard, a lot of US debt is held by foreigners. Indeed, at the end of April, some $6.903 trillion was held in foreign accounts—which, in spite of the pandemic, is above the $6.434 trillion held in April 2019. Most of America’s foreign friends have not pulled back on buying US debt, even though they are fighting the virus too. This is all voluntary, and US leaders believe it’s in Americans’ best interest, so it looks as though the world has America’s back.
So, if Americans were to be so polite as to send thank-you notes to those foreigners who are assisting them, which country would stand at the top of the thank-you list?
That would be Japan. In April 2020, the Japanese held $1.26 trillion in US debt, up from $1.06 trillion a year ago. They have really helped by taking on $260 billion more debt over the past year.
Second? China. Not quite as helpful as Japan, China held $1.01 trillion in US government debt at the end of April, down from $1.11 trillion. More on this shortly.
Thank-you notes could also be sent to the generous lenders in the United Kingdom, which upped the ante by more than $60 billion; Ireland, which increased its load by $31 billion; Luxembourg with an additional $42 billion; and Hong Kong with another $42 billion.
All of this raises the question: where do foreigners get the US dollars to invest in US bonds?
They get the dollars primarily from Americans’ purchases of their goods and services. Americans buy foreigners’ stuff with US currency, and foreigners lend the United States those dollars, which are used to fund the deficit.
This also helps to explain why China has reduced its investment in US bonds and bills. America has imposed lots of tariffs on Chinese goods, and that has cut off the flow of dollars to Chinese investors who might otherwise help fund America’s deficit.
One would think that America’s national leaders might look at this circle of life and exclaim, “It’s a wonderful world!” But most of the time, they don’t say that. Instead, I mostly hear grumbles and complaints about all the goods and services Americans buy from abroad, how foreigners take advantage of us, and how Americans should find ways to produce all that stuff themselves—while, in good times and bad, they continue to run deficits and borrow from abroad.
Maybe America should send some thank-you notes or at least keep buying the products foreigners offer to ship here. Unfortunately, the Trump administration seems dead set on limiting our import purchase options.
Trump’s Tariffs and the Forgotten Man and Woman
Following a long series of hearings and consideration concerning a US complaint that the European Union is unfairly subsidizing the production of commercial aircraft by Airbus, the World Trade Organization (WTO) recently ruled in favor of the United States. However, it certainly did not rule in favor of the forgotten man and woman in the United States—working taxpayers of all backgrounds who occasionally fly in Airbus planes.
By its favorable ruling, which is in accord with multiple previous decisions, the WTO authorized the Trump administration to increase the prices American airlines pay for the popular Airbus liners—and thus the prices Americans must pay when they fly—by imposing tariffs as penalties for importing subsidized planes. Some might even say that the WTO decision is a win for Boeing, but hardly anyone should say that it is a win for all Americans.
It Is an Unusually Complex Story
Just as the WTO was considering the United States’ complaint, that august body was also reviewing a complaint by the European Union alleging that the United States is unfairly subsiding its own aviation powerhouse, Boeing, in the production of aircraft sold to EU air carriers. That decision is still pending, but it’s easy to speculate that the outcome will be similar.
Governments subsidizing their airlines and the international sales of their aircraft manufacturers makes travel cheaper (at taxpayer expense). Now, the WTO rulings would have the power to change that, at a time when far fewer people are flying.
There is more to the story. When the Trump administration received word that tariffs (which the administration has otherwise enthusiastically placed on US consumers) had been approved for aircraft, it decided not to follow through. Perhaps the coronavirus-strained US airlines begged for mercy. Now, instead of raising consumer prices for air travel, the administration indicated it would raise tariffs on French wine, cheese, and similar delicacies from 25 percent to a long-threatened 100 percent in the case of wine.
The WTO episode started in better times, long before the nations involved were caught in the coronavirus recession. What may have made sense then, at least to politicians whose constituents somehow love tariffs, makes no sense at all now. With this in mind, I thought perhaps this would be a good time to call for a two-year moratorium on all tariff talks. Let’s give the world’s struggling economies—and the forgotten men and women who form them—a chance to breathe.
But no. Somehow tariffs continue to rule the day. On August 6, President Trump announced that he is imposing a 10 percent tariff (read: a consumption tax paid by Americans) on Canadian-produced aluminum, on top of tariffs imposed on Canadian timber and dairy products, on steel from around the world, and on a host of Chinese products. Once again, the forgotten man and woman take it on the chin.
Free Markets and the Environmental Regulation Challenge?
At a time when climate change is seen by many as the most serious threat facing humanity (even as the COVID-19 pandemic is foremost on Americans’ minds), leaders of the corporate and financial worlds are looking for ways to make their activities more “green.” Automakers are scrambling to shift production to all-electric vehicles, and industrialists are looking for ways to reduce their carbon footprints. So it’s no wonder that managers of mutual funds and bond portfolios are offering more sustainable equity and “green” bond funds. Sustainability-linked loans in the developing world are increasing rapidly.
If the trends continue and the fund managers are successful, people may someday look back at how free-market forces delivered improved worldwide environmental quality while multi-country environmental regulation seemed impossible to implement. People have gotten pretty good at doing things at the national, state, and local levels, but so far they haven’t found any viable solutions to the combined global effects of individual nations’ environmental use.
Consider BlackRock, the world’s largest fund manager, with some $7 trillion in various holdings. It recently announced that it will impose much stricter environmental and social standards on corporations whose shares it might consider owning. It’s also vacating investments in firms that produce coal or have large carbon footprints and expanding holdings in firms committed to fighting climate change and increasing diversity.
Along somewhat similar lines, the Wall Street Journal reports that sales of green bonds, which are sold to investors to fund renewable energy facilities and mass transit, rose by more than 20 percent last year. They are in such demand that investors are scrambling to buy them. In an effort to expand this market, the trading platform MarketAxess promised to plant five trees for every $1 million in bonds traded. Based on last year’s $57 billion, that would yield more than 250,000 new trees.
As this trend unfolds, there is growing concern regarding the soft regulatory power being exerted by the nonprofit Sustainability Accounting Standards Board, which seeks to influence how corporations report social goal progress. Also, the Securities and Exchange Commission is raising questions about what qualifies an investment fund to be called “environmentally superior.” Then there is the perennial criticism of corporate social responsibility, that corporations should simply stick to their knitting and maximize shareholder value. Presumably, each day a firm’s management spends worrying about planting trees is one fewer day focused on improving products and cutting costs.
These are valid concerns. However, each one underestimates the ability of market forces to deliver what buyers will pay for and rush to bankruptcy those producers who do not. Historically, these sorts of concerns have been sorted out through a combination of give-and-take in markets and the evolution of rating services that inform investors. Committing to what consumers and investors care about doesn’t necessarily yield lower returns than does a narrow focus on products, service, and costs.
After all, if investors are truly willing to pay more for greener investments, the cost of capital will fall for the firms they favor, causing an expansion of, say, a popular tree-planting program or investment in the developing world. If buyers will pay more for green bonds, the cost of debt will fall for cities and states seeking to replace older infrastructure with cleaner technologies. And if these things begin to occur systematically, then one may see the day that this market-driven environmental movement bears significant fruit.
This isn’t the time for more Securities and Exchange Commission regulation of green investments; rather, it’s a time for independent rating organizations such as Moody’s, Fitch Ratings, and S&P Global Ratings to rise to the challenge and help verify promised outcomes, environmental and otherwise.
What the world may be observing, finally, is a new day, when free markets deliver cherished environmental outcomes that are proving to be exceedingly difficult for governments to achieve alone.
Oklahoma is somewhat of a transition zone between regions. With Texas to its south, Kansas to its north, and Arkansas to its east, it could fairly be considered part of the Southwest, Plains, and South all at once. Topographically, it slopes from the high dry plains of the panhandle in the northwest to the low wetlands of the southeast. Prairies, hills, and plains fill the space in between. Oil, gas, and coal deposits are found in all of these regions except for the lowlands. Grazing and wheat farming are more common in the plains, while vegetable and peanut farming is widespread in the valleys. The state has an area of 69,899 square miles and a population of nearly 4 million people. This gives it a population density of 54.6 people per square mile, making it the 35th most densely populated state. Despite this lower-than-average population density, two-thirds of the population live in urban areas.
For much of its history, Oklahoma was a territory where Native American tribes that had been forced off of their land in other parts of the country were sent. Eventually, these land rights were also eroded as Oklahoma was flooded with white and black settlers looking for farmland and, later, oil. Over time, oil replaced agriculture as the main industry of the state as events such as the Dust Bowl of the 1930s degraded the land’s agricultural value.
This history is quite apparent in the state’s demographic and economic makeup. The percentage of the population that identifies as American Indian (alone) stands at 9.4 percent. The percentage that identifies as American Indian plus some other category is even higher. Consequently, Oklahoma has one of the largest concentrations of Native Americans in the country. The economic effect of this is notable: some of the largest employers in the state are Chickasaw Nation, Choctaw Nation, and Cherokee Nation gaming, entertainment, government, and housing services. Native American heritage is also a primary driver of tourism to the state.
Using the Industry Specialization Index from the Bureau of Economic Analysis (BEA), one can see how Oklahoma’s history with oil and farming has shaped its current economic makeup. This index measures the concentration of different economic sectors in a given state’s economy by comparing the portion of state GDP generated by each industry to the portion of national GDP generated by each industry. Based on these data, the mining, quarrying, and oil and gas extraction industry was rated eight times more prevalent in Oklahoma’s economy than in the national economy. Transportation and warehousing was twice as prevalent, and agriculture, forestry, fishing, and hunting was 1.7 times as prevalent. Meanwhile, professional, scientific, and technical services; finance and insurance; information; and educational services were all only about half as important to Oklahoma’s economy as they are to that of the nation. A similar BEA measure for the relative importance of certain occupational categories tells the same story. Oil and gas extraction jobs are more than 10 times more prevalent in Oklahoma than they are in the United States on average. Information, technology, professional services, and arts jobs are very poorly represented. One exception is aerospace engineering, which is highly represented owing to the presence of major airplane maintenance and engineering facilities in the state.
Based on these data, Oklahoma’s economy can be classified as highly reliant on oil and natural gas extraction, somewhat reliant on transportation and agriculture, and not at all reliant on high-paying professional and service industries. Indeed, Oklahoma is the third-largest producer of natural gas and fifth-largest producer of crude oil in the United States. It should be pointed out that, although agriculture is important to the Oklahoma economy, it is not nearly as central as it is in similar Plains states, such as Nebraska and Kansas, where it is three and five times more prevalent, respectively, than it is in the nation as a whole. Farming is still important to Oklahoma, but it hasn’t been the main industry there since the Dust Bowl.
Oklahoma’s per capita personal income in 2019 was around $47,750. This was much lower than the national average of around $56,000, and lower than that of most neighboring states. However, Oklahoma’s real personal income (in 2012 dollars) of $48,633 was higher than that of many of those neighboring states. This discrepancy is caused by the fact that real personal income takes inflation and regional price parities into account, which indicates that the lower cost of living in Oklahoma somewhat offsets its lower average personal income compared to surrounding states.
One factor contributing to this lower-than-average income is education. The percentage of Oklahomans with a high school diploma or higher is 87.8 percent; 24.5 percent have a bachelor’s degree or higher, and 2.3 percent have an advanced degree. These educational attainment rates rank 34th, 43rd, and 47th in the United States, respectively. Oklahoma’s high school graduation rate, at 84 percent, is below the national average of 88 percent. Eighth-grade reading scores in Oklahoma are ranked 40th in the nation. These numbers are partially reflected in Oklahoma’s poor rankings for technology-related workforce education. The state economy as a whole is incredibly uncompetitive in high-tech fields. Rankings for business dynamism, industry research, and high-tech employment are all quite low.
Luckily, Oklahoma is slightly more competitive when it comes to economic policy. The government of Oklahoma is rated 5th out of the states on fiscal solvency. It has very few long-term liabilities, very low overall debt, and plenty of cash on hand to pay for short-term obligations, although in recent years the state has run deficits.
On tax policy, Oklahoma is mediocre. Its flat state corporate tax rate of 6 percent is much lower than those of the heavily taxed Northeastern and West Coast states, but it is average for the region. The effective property tax of around $950 per $100,000 of home value is amongst the lowest in the nation. The top individual income tax rate of 5 percent applies at the very low threshold of $7,200 in yearly income for single filers and $12,000 for married joint filers, meaning most residents will pay the top rate. A 5 percent income tax rate is right around the middle for US states. Finally, the average combined state and local sales tax of 9 percent is one of the absolute highest in the nation. In some cities, the combined sales tax is in the double digits. Oklahoma also has a 7 percent severance tax and 0.95 percent excise tax levied on oil and natural gas. These rates are relatively low compared to other states with a large oil and gas industry, and they amount to less than 10 percent of state revenue. Taken together, the total amount of taxes paid by the average Oklahoma resident is likely to be middling. Low property taxes are balanced out by medium income taxes and high sales taxes.
As a final note on policy, Oklahoma’s regulatory and legal environment is generally quite business friendly. Unionization rates are low, there is a state right-to-work law, and there is no state-mandated minimum wage. Furthermore, land use and occupational licensing regulation is relatively low. Most rankings of economic competitiveness and business friendliness note this relatively laissez-faire environment. They also tend to mention the low cost of doing business and low cost of living as reasons to start a business in Oklahoma. However, Oklahoma’s poor education, poorly trained workforce, and general dearth of technology and innovation really hurt its rankings in these reports.
Given all of this information, Oklahoma’s overall economic performance is somewhat surprising. Real personal income and real GDP have increased at a rate greater than the national average for the past few years, but below that of its powerhouse neighbors to the southwest. Specifically, Oklahoma’s real GDP grew 2.4 percent in 2019; the national GDP growth rate in 2019 was 2.3 percent; and growth rates for Texas, Arkansas, Kansas, and Nebraska were 4.4 percent, 1.9 percent, 0.9 percent, and 0.6 percent, respectively. Why has Oklahoma been growing so much faster than its northern neighbors, but slower than its southern neighbor? Its low technological base and workforce education certainly explain why it lags behind Texas. Meanwhile, a lower reliance on agriculture and higher reliance on oil might account for some of the difference between the state and its northern neighbors. Policy may also play a positive role. Businesses whose main constraints are regulatory or labor costs would benefit hugely from the Oklahoma policy environment, so long as advanced capital and specialized knowledge wasn’t a primary need. Despite this advantage, Oklahoma faces the same uphill battle faced by other inland states. The fastest-growing economic sectors tend to be concentrated in large, coastal, urban trade hubs, which inland states lack. Nonetheless, Oklahoma does better at dealing with this disadvantage than many similar states.
Will the economic effects of the coronavirus alter this situation? It’s hard to say. In the first quarter of 2020, US GDP fell by 5 percent. Oklahoma GDP fell by 4 percent during that same period. The single greatest factor determining how badly a given state’s economy was affected by the virus, in terms of GDP, was the prevalence of certain key industries in that state. The accommodation and food services industry was by far the worst hit, according to BEA data. Finance and insurance, health services, and arts were also heavily affected. States with a high concentration of one or more of those industries—Delaware, Hawaii, Nevada, and New York—generally lost a higher percentage of their GDP than states where those industries are not prevalent. This partially explains why the Oklahoma economy has done slightly “better” through the coronavirus pandemic period than the national average. Accommodation and food, finance, and arts aren’t very important to the Oklahoma economy, so the massive losses by those industries owing to the coronavirus didn’t affect Oklahoma nearly as much as they affected other states. Nevertheless, this is only one factor, and other explanations are possible. The economic effect of different lockdown policies and infection rates remains to be seen.
Oklahoma’s Regulatory Outlook
The recent release of version 2.0 of State RegData, a tool developed by the Mercatus Center at George Mason University used for quantifying regulation at the state level, presents two years of regulatory data. Oklahoma will be the first state that we examine using these new and unique data.
Oklahoma’s regulations, contained in the Oklahoma Administrative Code (OAC), are published online and can be found on the secretary of state’s website. Oklahoma’s code has 152 titles that cover different commissions including the Cerebral Palsy Commission (title 130), the State Athletic Commission (title 92), and the Horse Racing Commission (title 325). In addition to commissions, Oklahoma’s code covers information regarding many boards that exist in Oklahoma’s government. Some examples of these include the Polygraph Examiners Board (title 560), the Linked Deposit Review Board (title 415), and the Real Estate Appraiser Board (title 600). Finally, the code also has titles covering the different departments in Oklahoma’s government, such as the Department of Securities (title 660).
While Oklahoma’s large code has more than 9.2 million words as of 2020, the code is still quantifiable by using a combination of Python code, natural language processing, and machine learning. After scraping the OAC, we find there to be 142,604 regulatory restrictions. Regulatory restrictions are defined as terms that are legally binding, including shall, must, may not, required, and prohibited. In 2019, the OAC contained 145,296 regulatory restrictions, meaning that Oklahoma saw a net decrease in the number of regulations over the past year. While this is relatively abnormal, as most jurisdictions see yearly increases in regulations, Oklahoma joins a growing list of states that are showing steady or decreasing rates of regulatory growth.
In addition to finding the number of regulatory restrictions in the OAC, State RegData uses custom machine learning algorithms to associate each unit of text in the OAC with industries classified under the North American Industry Classification System (NAICS). In 2020, Oklahoma’s most regulated industries at the NAICS three-digit level were administrative and support services; professional, scientific, and technical services; mining, except oil and gas; broadcasting; and ambulatory healthcare services. Oil and gas, transportation, and agriculture are not among the most highly regulated industries, given that they are by far the most important industries to the Oklahoma economy.
This list is relatively similar to what was found in a 2019 industry analysis of the OAC. The only difference is the inclusion of the paper manufacturing industry in 2019 and the exclusion of the broadcasting industry.
The Mercatus Center’s FRASE Index ranks the degree to which a state’s economy is affected by federal regulations. The FRASE Index ranks Oklahoma as experiencing the 16th-highest impact of federal regulations out of all 50 states and the District of Columbia. This higher ranking most likely owes to the large mining, quarrying, and oil and gas extraction industry in Oklahoma. As mentioned previously, this industry is eight times more important to the Oklahoma economy than it is to the US economy as a whole. Since this industry is disproportionately targeted in the US Code of Federal Regulations, it contributes heavily to Oklahoma’s FRASE score.
Yandle’s Reading Table
Richard Brookhiser’s 2019 book Give Me Liberty: A History of America’s Exceptional Idea has to be one of the best books I have read in many a day. Of course, this must mean that I was mentally hungry to read his 13 unique, but still liberty-connected, chapters, each of which was devoted to what he considered to be a critical document or episode in America’s struggle to be a free republic. To better portray this, Brookhiser tells first about the trials and tribulations experienced by the Jamestown settlement, how in the face of such hard times, the struggling community established a self-governing unit that later inspired other English settlements to do the same. Brookhiser gives colorful and inspiring treatment of the emergence of the Declaration of Independence, Monroe Doctrine, Gettysburg Address, and FDR’s “Arsenal of Democracy” fireside chat, and he ends with Ronald Reagan’s “Tear down this wall!” speech. The human pursuit of liberty is the common theme that runs through all the stories, which include the frustrating effort to rid the republic of slavery.
I will illustrate the power of Brookhiser’s pen by describing his treatment of the Declaration of Independence, where he does far more than recall the history and characters involved in the story. For example, the author focuses on key words in the Declaration, how they were edited, deleted, and reformed. His attention goes to the sentence structure, symmetry, and message. Along with doing this, Brookhiser reminds the reader about the personal risk the 24 signers imposed on themselves, with each realizing that, upon writing his name, he was admitting to engaging in treason. The author tells how five of the signers—one from New York, one from Georgia, and three from South Carolina—were hunted down by the British and imprisoned.
Each of the 13 chapters is a jewel of scholarship, good writing, and surprising insight, and each one deserves to be read and discussed—ideally, I would say, by small book clubs made up of people who seek to understand how this nation evolved and if there really is something that deserves to be called “American exceptionalism.” As to the latter point, I believe sincerely on the basis of thought and study, not prejudice, that this nation is among the nations of the world an exceptional polity that, in spite of regular episodes of turmoil and near revolution, still offers the world’s best hope for ordinary people to live lives of liberty.
And this belief gets to how the book happened to whet my intellectual appetite. Like many, I am sure, I have struggled recently to understand the sources and strength of the seemingly destructive political forces that beset Americans now in the year 2020. Different factions among them seem inspired by elements of a strange witch’s brew of coronavirus, endless wars, militarized police action, and, in the view of some, unsatisfactory adjustments to a globalized economy that has generated vast and glaring accumulations of wealth in some quarters but has left many others to struggle to get connected to the economic engine.
Now, don’t get me wrong: Brookhiser doesn’t sort all this out for the reader, but the intellectual road map provided by his 13 chapters goes a long way toward explaining the crucial importance of Americans’ fundamental rights and how, across time, the struggle to keep them has never eased.
Timothy Carney’s 2019 book Alienated America: Why Some Places Thrive while Others Collapse is a well-written and well-reasoned effort to explain why almost half of America’s electorate seemed to buy candidate Donald Trump’s 2016 appeal when he said, “The American dream is dead,” while almost as many others shook their heads in disagreement thinking that life just can’t be better than this. Carney focuses on what he calls the alienated part of the electorate: those who realistically believe that their sons and daughters cannot expect to do as well as they did while working in industrial America.
Actively involved as a writer covering the campaign, Carney saw firsthand how people in older, industrial Rust Belt communities, who could no longer realistically hope that the shuttered furniture manufacturing plants or broken-down steel mills would reopen, were still drawn to a candidate that seemed to understand their plight and brashly promised to do something about it. At the time of the campaign, I, too, watched and read the Rust Belt news reports and couldn’t help but wonder if candidate Trump could build victory by making an appeal based on America’s decades-old Rust Belt deindustrialization. “Would the numbers add up?” I wondered. After all, Pennsylvania and Ohio’s sprawling steel mills were shuttered 20 or 30 years ago, and the Carolinas saw their high-employing textile and furniture industries practically disappear in the 1980s. Were there enough alienated Americans out there to lift the candidate to an electoral-college victory? Hand it to Donald Trump and his campaign managers. There were, and they did.
While Carney’s book provides plenty of electioneering data and analysis so that readers better understand how Trump’s victory was achieved, it is Carney’s focus on people in places, and not people as data points, that makes it so appealing. It is places that matter. He tells readers about folks who live in disappearing communities and industrial towns, families who have seen their schools close after consolidating, people in towns that can no longer field a softball team or keep churches operating because of mass exodus of working families, and, in the worse cases, locations filled with working-age men who no longer work (or even can work). Some are stuck and have no better alternative than to stay and suffer. Others are rooted, and still others are simply lost souls and can no longer be viable players in a hi-tech, knowledge economy.
Carney is interested in what has happened to social fabric that—before the loss of major industrial employers—formed the life-enriching matrix that strengthened families when they fell on hard times, rewarded hard work and good behavior, and provided human models of success for children who were lucky enough to grow up in what were once safe, well-functioning working- and middle-class communities.
Alienated America fits in well with a growing family of books that address the breakdown and division of modern society and the rise of populism. These include Charles Murray’s Coming Apart, Robert Putnam’s Bowling Alone, J. D. Vance’s Hillbilly Elegy, and David Goodhart’s The Road to Somewhere. Yet while focusing on, describing, and analyzing social breakdown, Carney takes an additional step. He underlines the importance of religious life in providing sustaining bedrock for individuals, families, and communities, and does so in a highly ecumenical manner. Near the end of the book, Carney concludes, “The retreat of churches in America is the erosion of civil society in America. The erosion of civil society in America means the collapse of community in America. The collapse of community in America is the collapse of family, and the death of the American dream.”
Having placed community churches, mosques, and synagogues as being central to forming and, therefore, recovering civil life in America, Carney closes by explaining how this may happen one community at a time. At his best when recounting how better living may be achieved and, therefore, how the American dream can be reincarnated, Carney recognizes that this renewal, when and if it happens, will occur spontaneously but will be inspired by leadership. On reading the book and reflecting on it, I found some comfort in the thought that it is possible for me or any other ordinary person to play a small role in helping to renew community life in my town.
Amity Shlaes has done it again. She has given us another rigorously researched and specially flavored history of an important American epoch. Her Great Society: A New History focuses primarily on the mid-to-late 1960s and turbulent presidency of Lyndon Johnson. It should be read, savored, and placed on a special shelf alongside her earlier The Forgotten Man, with its Great Depression and FDR focus, and Coolidge, a biography that adds brightness and purposefulness to a life that was characterized, more often than not, as dull and boring. Rich with dialog, Great Society at times reads like a novel. The book is flavored heavily with political economy involving special interest groups and White House insiders who truly believe that society can be lifted to a higher plane of life if only the federal government will unleash its powers and embrace America’s own special brand of socialism.
The book’s period of focus is somewhat like the present time, with what seem like endless wars in the Middle East, a socially disruptive pandemic, and national divisiveness with riots, protests and storefront burnings over brutal treatment of black individuals. But having experienced both periods as a working adult living in Atlanta, I would say that the mid-to-late 1960s were far more troubling than the current period. I think first about the highly charged civil rights movement, the bloody struggles that ensued from it, and the court-ordered integration that followed. Fold in what seemed like an endless war in Vietnam and the despised draft. Add to that the rise of a counterculture, driven partly by the birth-control pill giving enhanced reproduction control. Then include the emergence of Martin Luther King Jr. and other powerful civil rights leaders. Recall the assassination of Martin Luther King Jr. and the burning of Washington, DC, and Chicago that followed. Along with those national tragedies, remember the assassination of President John F. Kennedy and the later murder of his brother and presidential candidate Robert Kennedy. And if that is not enough, sprinkle in economic stagnation and struggles between presidents and Federal Reserve Board chairmen; then add the imposition of wage and price controls by Richard Nixon. Now stir this witch’s brew vigorously and introduce Lyndon Johnson’s Great Society, some of the largest and most extensive social welfare programs ever conceived and implemented in America’s history. It was a divisive, disruptive time.
To my way of thinking, Amity Shlaes meets the challenge faced for one who seeks to capture the essence of social and political forces that play through her story. She does so by focusing on key influential individuals who seemed dedicated to the Great Society. These include labor leader Walter Reuther and his brother Victor, who have strong political influence in the United States as well as with political leaders in Europe; university professor and then presidential adviser and later Senator Daniel Patrick Moynihan; Peace Corps and Office of Equal Opportunity leader Sargent Shriver; economist icon Walter Burns; and a host of others who did their best to create a new America based on their own vision.
The programs that followed embraced the assumption that the nation’s brightest and best could be assembled in Washington and funded to build a better world. There was a basic assumption that the nation’s poor could be lifted up if they could only be housed and fed “properly,” instructed in how best to live, and then removed from their historic neighborhoods and relocated to housing deemed appropriate. Along with this effort came urban renewal; the Equal Employment Opportunity Commission; expanded Aid for Families with Dependent Children, which contributed to the breakup of families; expanded food stamp programs; and massive public housing projects. The 1965 formation of the Department of Housing and Urban Development was the epitome of the period. At the same time, of course, the Vietnam War was raging. As Shlaes recounts so carefully, America was involved in a “guns and butter” expansion that seemed to know no limit; that is, until the social fabric began to tear, the mighty dollar quivered and lost its gold backing, and the Great Society’s political foundation began to quake. Then, like Humpty Dumpty, as Shlaes tells the story, some of the more visible Great Society programs literally came crashing down, leaving plenty of remnants for future aspiring socialists to use in making yet another attempt to create a better world, as they see it, through the power of the state and its ability to command resources and citizens.
The book is a winner for those who seek to understand how, through the political process, a great nation can become engaged in massive social programs and wars that turn out to be profoundly disruptive and unsuccessful and how difficult it becomes to steer the ship of state in a different direction.
Listen to a conversation with Bruce discussing this Economic Situation Report on the Mercatus Policy Download here.

