- | Government Spending Government Spending
- | Data Visualizations Data Visualizations
- |
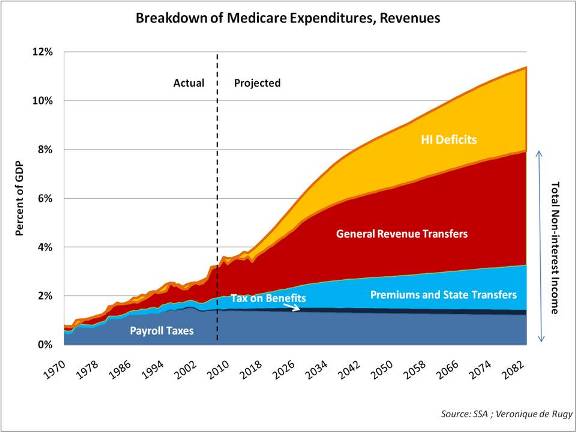
Breakdown of Medicare Expenditures
This chart by Mercatus Center senior research fellow Veronique de Rugy uses data from the Social Security Administration to illustrate long-term Medicare expenditures.
This chart by Mercatus Center senior research fellow Veronique de Rugy uses data from the Social Security Administration to illustrate long-term projections of Medicare revenues from premiums and payroll taxes (blue) along with projected transfers into Medicare from the federal government (red) and the projected deficits in Medicare’s Hospital Insurance Fund (orange); when summed these components add up to total long-term Medicare expenditures.
Throughout the time period examined, the portion of Medicare that is funded by our tax dollars is slated to remain roughly constant at 40%. As a percentage of GDP, these general revenue transfers are projected to increase from 1.3% in 2010 to 3.6% in 2050. In addition, growing deficits in the Hospital Insurance Trust Fund will need to be proactively addressed by new legislation to avoid a future interruption of service. Medicare funding must be cut; these cuts must be deliberate, not due to a legislative loophole.
This chart appeared in a recent column in The American.