- | Government Spending Government Spending
- | Data Visualizations Data Visualizations
- |
CBO Updates Budget and Economic Outlook: 2014 to 2024
These charts show that the federal government will not be able to provide the same level of services without significant reforms to entitlement programs that drive the bulk of spending and compound future interest payments on the federal debt.
This week’s charts use data from the Congressional Budget Office’s (CBO) recently released update to its Budget and Economic Outlook to show the trends and components of projected revenue and outlay increases. The charts show that growing entitlement obligations and net interest payments are projected to push outlays (spending) to grow faster than revenues over much of the next decade. This shift will limit Washington’s ability to maintain the level of services Americans are used to—such as in national defense, transportation, and education—while also meeting increasing entitlement and debt obligations.
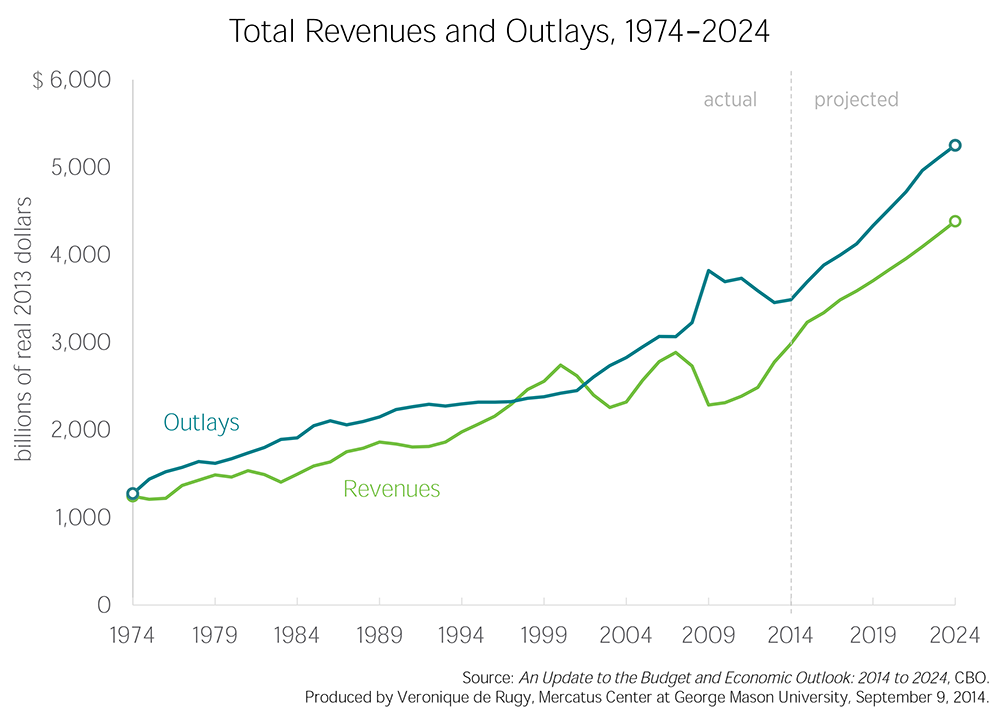
The first chart displays historical and projected trends in outlays and revenues from 1974 through 2024. The second and third charts display the components that constitute the increases in revenues and outlays, respectively. The fourth chart displays projected spending for major budget categories over the next decade.
The first chart shows that CBO projects outlays to grow faster than revenues after 2018, which will push projected deficits above 4 percent of GDP by 2022.
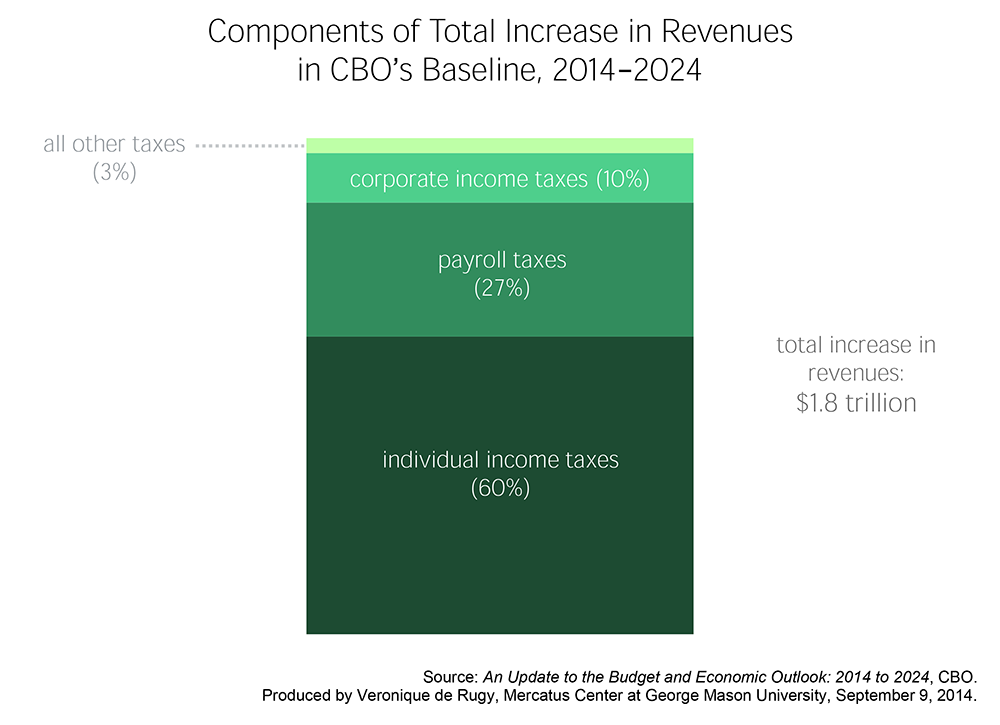
The second chart displays the breakdown of revenue sources that drive the total increase over the next 10 years. It shows that CBO projects revenues will grow from roughly $3 trillion in 2014 to around $4.9 trillion in 2024, for a total increase in $1.8 trillion. Of this increase, $1.1 trillion, or 60 percent, will come from individual income taxes; $507 billion, or 27 percent, will come from payroll taxes; $176 billion, or 10 percent, will come from corporate income taxes; and the remaining $59 billion, or 3 percent, will come from various other sources such as excise taxes and customs taxes.
But some of these projected revenues could disappear if Congress decides to extend expiring tax subsidies. If extended, these tax provisions, which include expansive accelerated depreciation deductions for corporate and non-corporate businesses, could lower baseline revenues by 0.2 percentage points over the next two years.
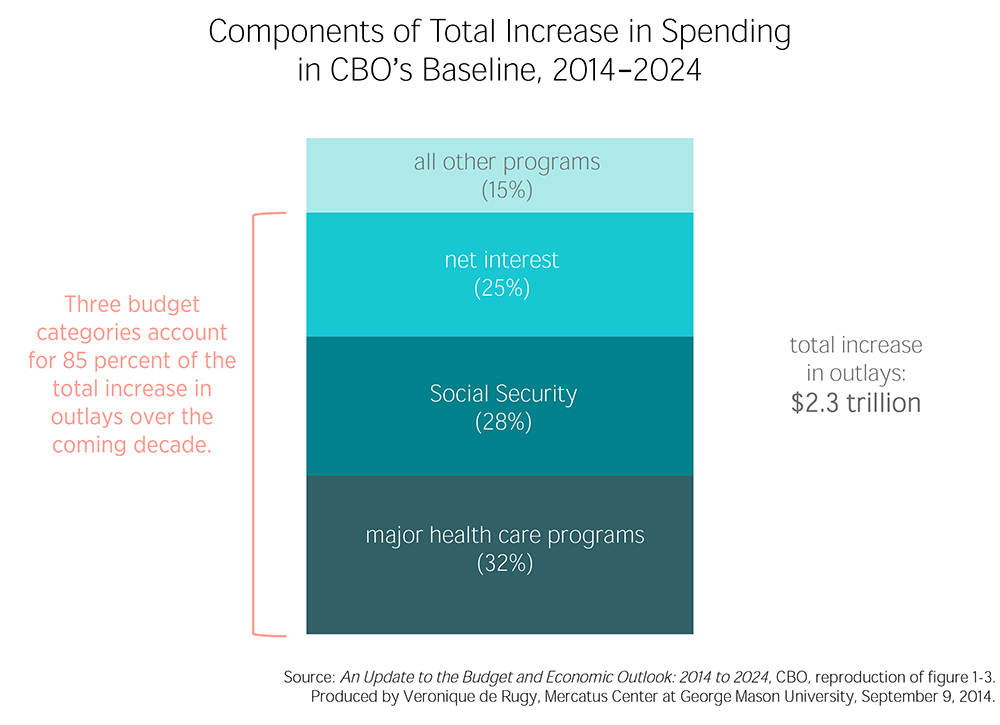
The third chart shows the same component breakdown on the outlay side. It shows that CBO projects three large budget categories—major health care programs (consisting of Medicare, Medicaid, the Children’s Health Insurance Program, and subsidies for health insurance), Social Security, and net interest payments on the debt—will account for 85 percent of the total increase in outlays from 2014 to 2024.
Total outlays are projected to increase from roughly $3.5 trillion in 2014 to $5.8 trillion in 2024, for a total increase of $2.3 trillion. Major health care programs are projected to grow by $816 billion, which accounts for 32 percent of the total. Social Security spending will grow by $654.9 billion over the next decade, which constitutes 28 percent of the total increase in outlays. Net interest payments on the debt account for 25 percent of the total growth in outlays, growing by $568 billion over the next decade. CBO projects $259.1 billion in spending on all other federal budget items—including infrastructure, defense, social programs, employee pay, and government services—over the next decade, which constitutes a surprisingly small portion (15 percent) of the remaining total increase in outlays.
Barring swift and significant reform to the major health care programs and Social Security obligations that put pressure on the budget, the federal government will find it harder to provide many services and programs in the future.
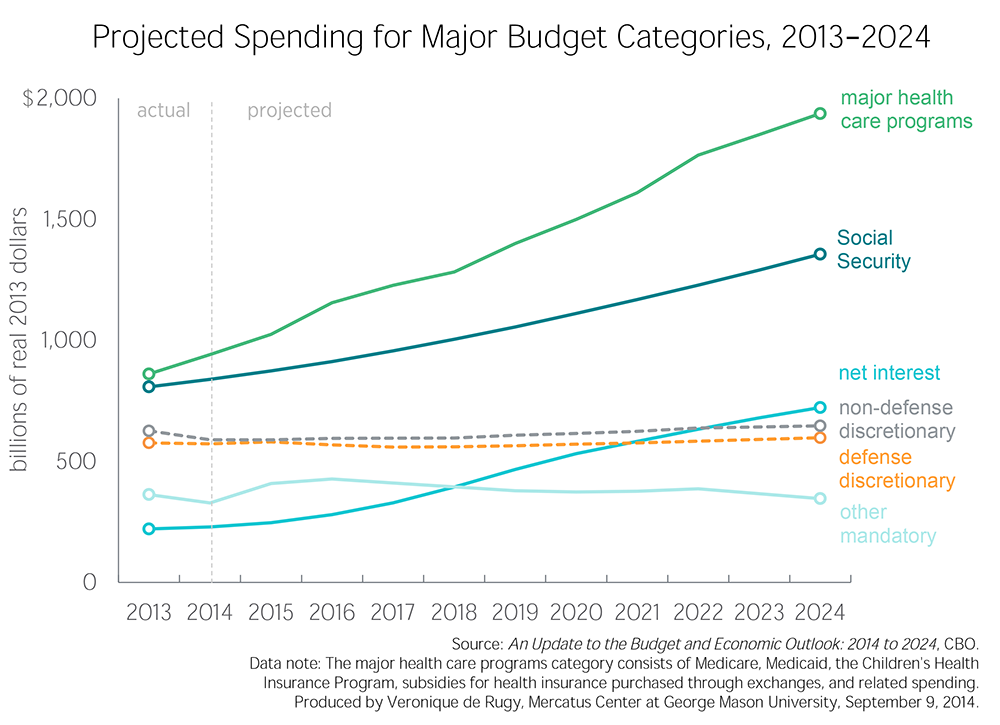
The fourth chart displays this trade-off. Major health care programs and Social Security comprise the bulk of projected federal outlays throughout the coming decade. Spending on health care programs will increase by 125 percent, from $861 billion in 2013 to $1.9 trillion in 2024, increasing at an average annual rate of 8 percent. For Social Security, spending is projected to increase by 67 percent by the end of the decade, growing at an average annual rate of 5 percent from $808 trillion in 2013 to roughly $1.4 trillion in 2024.
Discretionary spending, both defense and non-defense, is projected to increase over the next decade by roughly 3 percent. However, some of these projected small increases are dependent on uncertain policy changes, including the implementation of unpopular sequestration cuts. Should these cuts be again postponed, the fiscal situation could change significantly. Spending on other mandatory outlays, including income support programs, veterans’ benefits, and employee pensions, is projected to decrease by around 5 percent over the next decade, from $363 billion in 2013 to $346 billion in 2024.
Spending on net interest payments constitutes the largest single categorical increase. In 2013, interest payments equaled roughly $221 billion. CBO projects that interest payments will steadily grow at an average annual rate of 11 percent to $722 billion by 2024, a 227 percent increase.
These charts show that the federal government will not be able to provide the same level of services without significant reforms to entitlement programs that drive the bulk of spending and compound future interest payments on the federal debt.

