- | Government Spending Government Spending
- | Data Visualizations Data Visualizations
- |
Government Borrows Thirty Cents of Every Dollar to Sustain Spending Levels
The federal deficit has surpassed $1 trillion for the fourth consecutive year. This chart places the federal budget for fiscal year 2012 into perspective by comparing the most recent historical spending and revenue data presented in the President’s Fiscal Year 2013 Budget.
The federal deficit has surpassed $1 trillion for the fourth consecutive year. This chart places the federal budget for fiscal year 2012 into perspective by comparing the most recent historical spending and revenue data presented in the President’s Fiscal Year 2013 Budget.
In 2012, the federal government spent $3.7 trillion, exceeding the amount of federal revenue by $1.1 trillion. The government borrowed 30 cents of every dollar spent in order to sustain this level of spending. These deficits will eventually have to be paid for by future taxpayers. To steer clear of deficits, we must cut spending and reform entitlement programs.

Here’s a breakdown of the data:
- Defense: 19 percent of the budget, or $709 billion, went to military activities of the Department of Defense, nuclear-weapons related activities of the Department of Energy, operations in Iraq and Afghanistan, and other national security activities administered by other federal agencies. (These programs are represented under budget function 050.)
- Entitlements: 59 percent of federal spending occurs automatically through mandatory spending. The major entitlement programs (Social Security, Medicare and Medicaid) made up 41 percent of federal spending. Other mandatory spending for programs such as unemployment benefits, food stamps, and student loans bring total mandatory spending up to nearly three-fifths of federal spending. Social Security, Medicare, and Medicaid are the primary drivers of spending.
- Social Security: 21 percent of the budget, or $773 billion, provided social insurance benefits for the retired and the disabled.
- Medicare: 13 percent of the budget, or $478 billion, was spent to provide health coverage for the retired and disabled.
- Medicaid: 7 percent of the budget, or $255 billion, was spent on income-based health services.
- Net interest: 6 percent of the budget, or $223 billion, was spent on interest payments on the national debt.
- The personal income tax provides nearly half of the entire tax revenue. Social Security payroll taxes account for a fourth of entire receipts. All other sources of tax receipts are below 10 percent.

Data note: Other mandatory spending includes unemployment benefits, food stamps, child nutrition and tax credits, student loans, supplemental security for the disabled, etc. Non-defense discretionary spending accounts for spending that goes through the appropriations process for other major agencies such as the Departments of Agriculture, Commerce, Education, Energy, Transportation, etc.
Supplemental Material
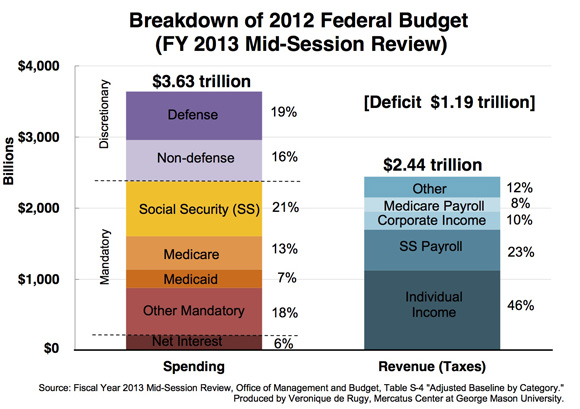
On July 27, 2012 the Office of Management and Budget released the “Mid-Session Review of the FY 2013 Budget”. Budget figures outlined in the Mid-Session Review represent the same categories outlined in the previous chart. Here’s what the data and breakdown look like:

More recently, the Congressional Budget Office released the October “Monthly Budget Review”. It’s important to note that the defense numbers reported by the CBO only account for the military budget - different from the numbers shown in the previous OMB data. However it is clear that the data still results in a deficit surpassing $1 trillion. Here’s the breakdown of the CBO data:


Related Content
- | Government Spending Government Spending
- | Data Visualizations Data Visualizations
Trillion-Dollar Deficits
- | Government Spending Government Spending
- | Data Visualizations Data Visualizations
Projections of U.S. Public Debt Continue to Accelerate

- | Government Spending Government Spending
- | Data Visualizations Data Visualizations
How Federal Surpluses Became Deficits
- | Government Spending Government Spending
- | Data Visualizations Data Visualizations

