- | Government Spending Government Spending
- | Data Visualizations Data Visualizations
- |
Government Spending Is a Bipartisan Problem: The Rise in Total Per Capita Mandatory, Discretionary, and Net Interest Spending
This week’s chart shows per capita discretionary, mandatory, and net interest spending as a share of total per capita federal spending (real 2014$) since 1962. Rising government spending has largely been fueled by increases in mandatory spending, though there are pressures to push discretionary spending, as well as expenditures on net interest, higher in the foreseeable future.
Since policymakers continue to put political considerations ahead of controlling spending, it’s worth looking at the ways the federal spending burden has risen. To do this, I separate federal outlays into three major categories: discretionary, mandatory, and net interest spending. This week’s chart shows per capita discretionary, mandatory, and net interest spending as a share of total per capita federal spending (real 2014$) since 1962. Rising government spending has largely been fueled by increases in mandatory spending, though there are pressures to push discretionary spending, as well as expenditures on net interest, higher in the foreseeable future.
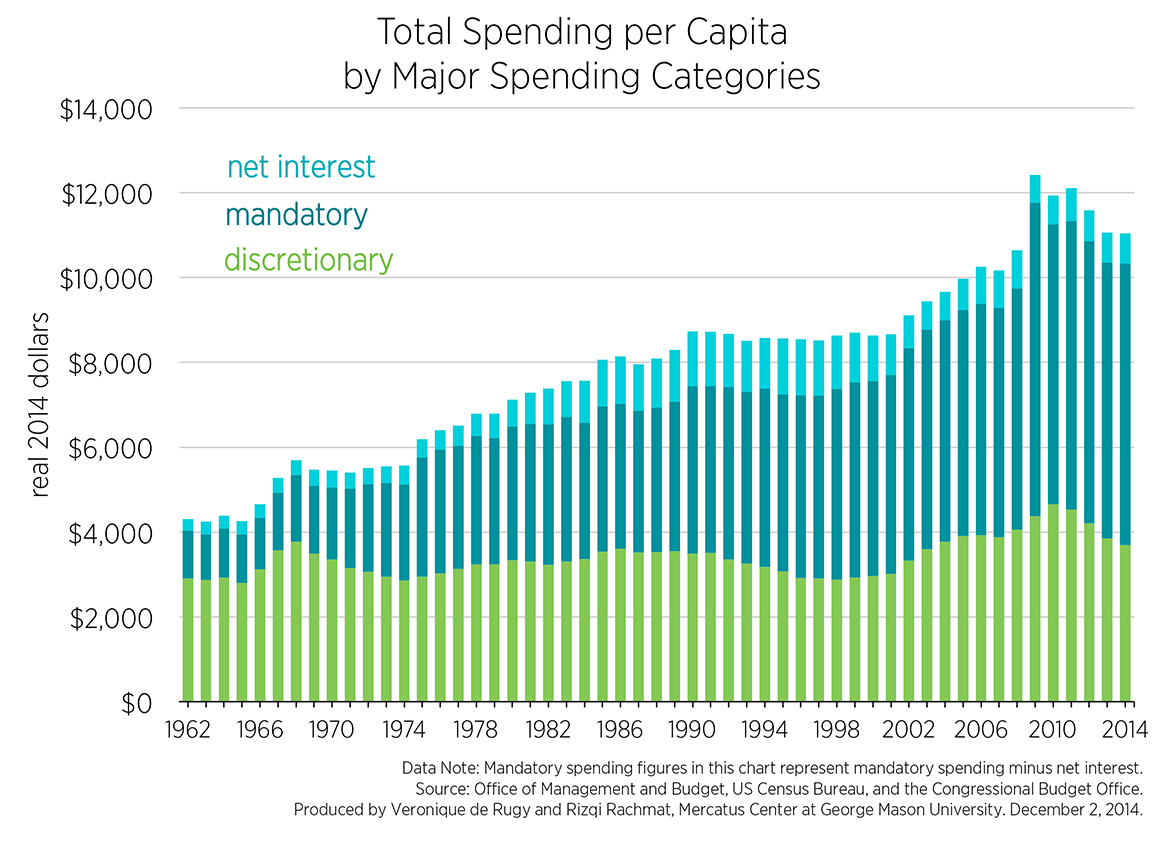
Mandatory spending, in dark blue, is spending that is essentially on autopilot unless the underlying programs are changed. It has been the main driver of increases in total per capita federal spending. The bulk of mandatory spending stems from the major entitlement programs: Social Security, Medicare, and Medicaid. This chart shows that mandatory spending per capita skyrocketed from $1,124 in fiscal year 1962 to $6,634 today. Although the initial rise was sparked by the creation of Medicare and Medicaid under the administration of Lyndon Johnson, successive Democratic and Republican administrations pursued policies that kept increasing mandatory spending. And while mandatory spending per capita has dropped from its peak of $7,391 in fiscal year 2009, the decrease is only temporary. That’s because the aging of the baby boomer generation will worsen the ratio of people collecting benefits to people working to pay for those benefits.
Discretionary spending is shown in green, and it results from money that Congress appropriates annually through the budget process. Discretionary spending has bounced up and down on a per capita basis over the years. Discretionary spending per person peaked at $4,561 in fiscal year 2010 under President Obama and has since declined following the implementation of budget caps; however, both sides of the aisle have shown a willingness to bust the caps and increase discretionary spending. Large increases in defense spending, which accounts for a bit over half of total discretionary spending, are particularly concerning, given that relatively more hawkish Republicans are about to take complete control of Congress.
Per capita spending on net interest is shown in light blue. It peaked at $1,321 in fiscal year in fiscal year 1996 and now stands at $712 per person. But the historically low borrowing rates that have enabled the federal government to finance the country’s growing debt on cheaper terms in recent years cannot last forever. Indeed, unless the runaway train that is mandatory spending is halted in the near future, the combination of mounting federal debt and higher borrowing rates will inflict severe pain on future taxpayers and the broader economy.

