- | Government Spending Government Spending
- | Data Visualizations Data Visualizations
- |
More Taxes and Spending in the President's FY 2015 Budget
The first chart compares the differences in debt projections between the FY 2015 budget and the CBO’s Budget and Economic Outlook for 2014 through 2024. While the president’s budget calls for higher debt levels as a percentage of GDP from 2013 to 2017 when compared to CBO current law numbers, the president’s budget plan projects that debt will drop below current trajectories by 2018.
President Obama just released his budget proposal for FY 2015. This week’s charts compare these new budget projections from the Office of Management and Budget (OMB) to the most recent projections from the Congressional Budget Office (CBO). President Obama’s newest budget projections anticipate higher spending, higher revenues, and lower debt levels by 2024, relative to CBO projections.
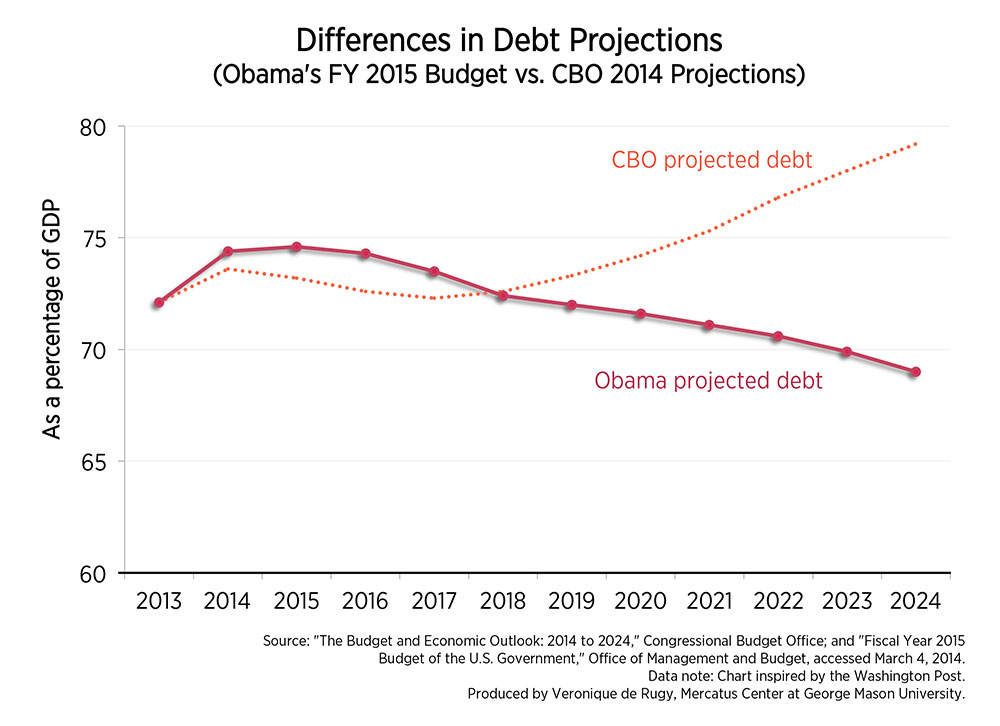
The first chart compares the differences in debt projections between the FY 2015 budget and the CBO’s Budget and Economic Outlook for 2014 through 2024. While the president’s budget calls for higher debt levels as a percentage of GDP from 2013 to 2017 when compared to CBO current law numbers, the president’s budget plan projects that debt will drop below current trajectories by 2018. By the end of the ten-year window there is a significant divergence between the two; by 2024, President Obama projects that his plan will leave us with a debt of 69 percent of GDP, compared to the CBO current law projection of 79.2 percent of GDP.
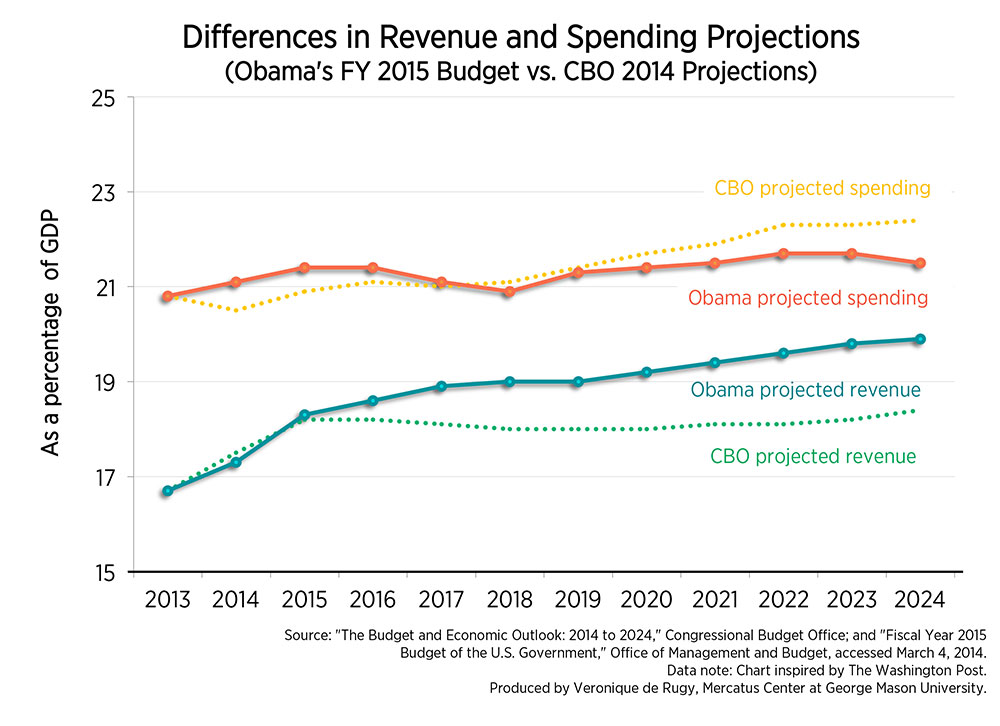
How will the president’s budget succeed in achieving this lower level of debt? The second chart displays revenue and spending projections for the FY 2015 budget and the CBO’s 2014 current law projections. The chart shows that President Obama’s FY 2015 budget projects considerably higher revenues over the next ten years than the CBO’s most recent projections. Tax revenues are expected to increase by $1 trillion over the next ten years to finance new spending while restraining growth in public debt. Spending under the president’s proposed budget would moderately increase compared to current law until 2017, when it commences decreasing as a percentage of GDP, compared to current law.
President Obama’s budget deal will also revise last year’s budget compromise in which policymakers agreed to replace sequestration cuts for two years and pre-establish spending for federal agencies through 2015. This budget would allocate another $56 billion over the established amounts to agencies, with only $28 billion offset in tax hikes and alternative spending cuts.
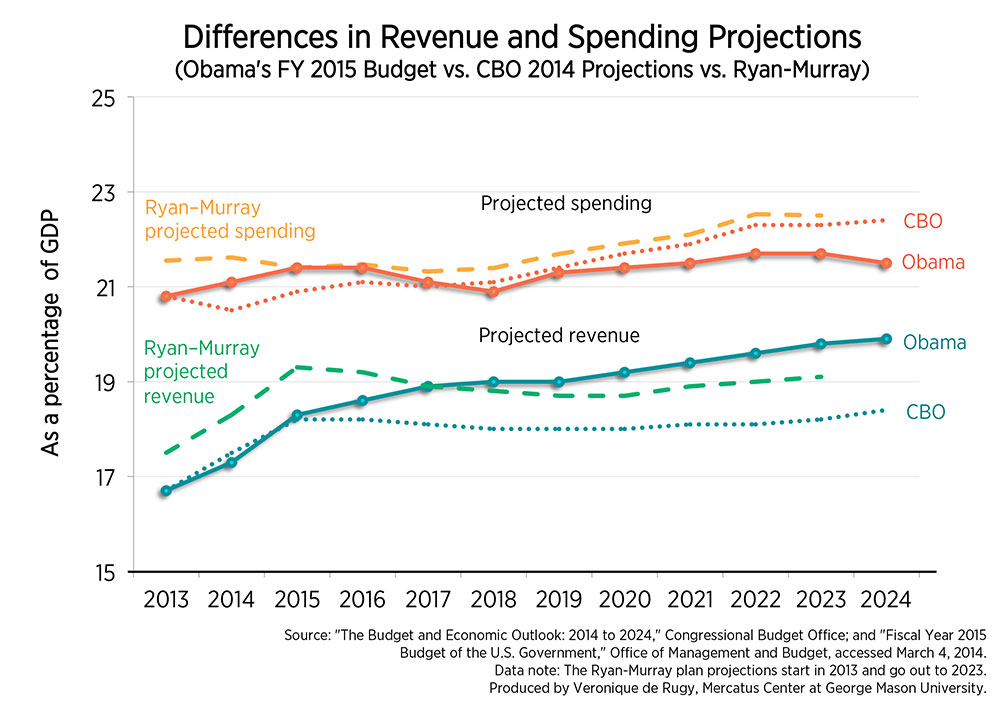
President Obama’s FY 2015 budget can also be compared to the CBO cost estimate of Rep. Paul Ryan and Sen. Patty Murray’s proposed Bipartisan Budget Act of 2013. The third chart includes CBO projections of revenues and spending for the Ryan-Murray budget proposal.
Much of the president’s proposed budget’s rosy projections will require considerable tax financing and political restraint to come to fruition. If revenues are lower than anticipated or spending is not restricted as planned, the ten-year debt picture will look quite different. I have noted before that President Obama’s later mid-session review budget differed considerably from his early budget projections. Early revenue and outlay projections were higher than actual amounts, while deficit spending surged much higher than anticipated from 2010 to 2012. This budget will likely mis-project critical variables as well. The rosiest projections all too often turn out to be the most disappointing.
Related Content
- | Government Spending Government Spending
- | Research Papers Research Papers
The Uses and Misuses of Budget Data

- | Government Spending Government Spending
- | Expert Commentary Expert Commentary

