- | Government Spending Government Spending
- | Data Visualizations Data Visualizations
- |
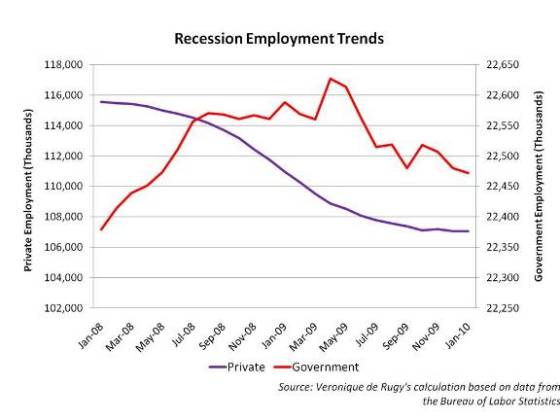
Recession Employment Trends
This chart compares the changes in public and private sector employment which have occurred during the past two years.
The above chart, by Veronique de Rugy, compares the changes in public and private sector employment which have occurred during the past two years. Using two axes, this graph superimposes government employment with employment throughout the private sector. During the last two years the number of public employees has increased from 22.3 million in January 2008 to 22.4 million in January 2010, after peaking at 22.6 million in July 2009. In the same time, the number of private jobs decreased from 115.5 million in January 2008 to 107 million. 8.7 million jobs were lost in the private sector while the public sector gained almost 100,000 jobs.
This chart can also be found here.
Click here to download data.

