- | Government Spending Government Spending
- | Data Visualizations Data Visualizations
- |
Tracking the Top 10 Percent over Time
(Note: all dollar amounts have been adjusted for inflation using this table and are given in 2016 dollars.)
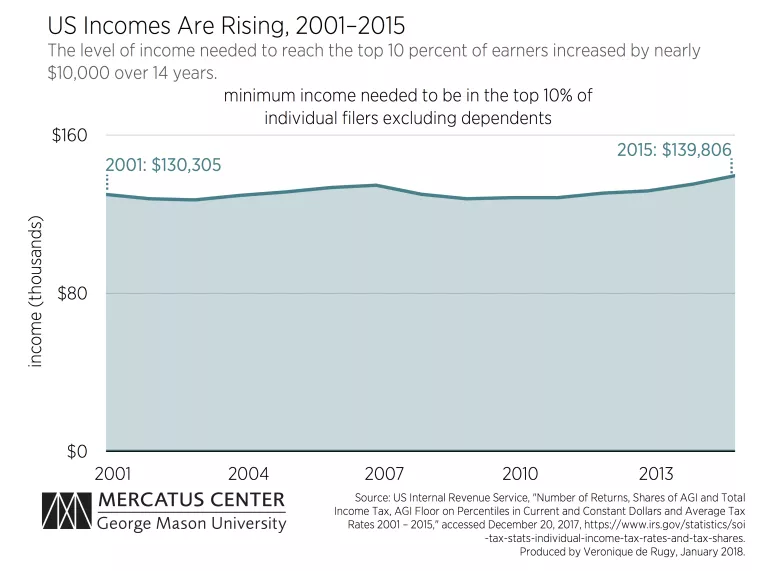
When people talk about “the rich,” they might often think of millionaires and billionaires, but this thinking would not be completely accurate. People may assume that being in the top 10 percent makes you incredibly rich—and at one time this may have been the case—but incomes in the United States are rising (even after controlling for inflation). If one considers “the rich” to be those within the top 10 percent of income earners, then an overall increase in incomes would cause the level of income required to be one of “rich” to rise as well. Data provided by the IRS and Census confirms this.
According to the IRS, for individual tax filers in 2001 who didn’t list any dependents, an income of more than $130,305 was sufficient to be among the top 10 percent. By 2015 this threshold had risen to $139,806, a nearly $10,000 increase.