- | Healthcare Healthcare
- | Policy Briefs Policy Briefs
- |
State Healthcare RegData 1.0: A Quantification of State Healthcare Regulations
In this policy brief, we introduce State Healthcare RegData, a dataset that contains the volume and characteristics of healthcare regulatory restrictions in US states. State Healthcare RegData is part of a suite of datasets, called Healthcare RegData, that quantifies healthcare regulations across the United States. The purpose of these datasets and their accompanying policy briefs is to shed light on the healthcare regulatory system and to provide researchers with tools to examine the impact of regulations on the practice, delivery, and outcomes of medical care.
Providing healthcare in the United States is complex, the result of various of levels of regulations—from federal to state to local—and the many professional associations and public-private partnerships involved in governing the industry. Almost every aspect of healthcare is heavily regulated, such as the rendering of services by medical professionals, the education of medical professionals, the provision of care by institutions, the manufacturing and dispensing of drugs, the financing of healthcare services provided to patients, and many others. The often-stated goals for regulations of healthcare are to increase the quality of healthcare, improve access to healthcare, and to ensure that healthcare is affordable. Pursuing these goals has, over time, led to a complex web of regulations with unintended consequences, not the least of which is an expensive healthcare delivery system that has struggled to innovate. In addition, the intricacy of these regulations favors industry incumbents that have the expertise and resources to maintain their position. It also constitutes a barrier to new entrants, shielding industry members from competition and innovation, which patients depend upon to ensure better care at a lower cost, year after year.
The healthcare industry needs to be dynamic and needs to benefit from the openness and competition that have shaped other sectors of the economy, such as information technology and telecommunications. The first step toward a more competitive and dynamic healthcare system is shedding light on the regulatory system that governs its functioning. The Quantitative Health Lab (QHL), an initiative of the Open Health project at the Mercatus Center at George Mason University, developed Healthcare RegData, a suite of datasets that contain the number and complexity of healthcare regulations across the country, both at the federal and state levels. The QHL builds upon almost a decade of research by the Mercatus Center’s Policy Analytics project, which uses data analytics to quantify regulations, analyze the effects of regulations on the economy, and derive recommendations for reforms.
We summarize the major features of state healthcare regulations from State Healthcare RegData, which QHL researchers developed by using QuantGov, an open-source machine learning and text analysis platform for analyzing regulatory text. In addition to assessing the volume of healthcare regulations, we determine the industries that are likely to be affected by these regulations. Healthcare data abound, covering such domains as claims, health outcomes, clinical outcomes, expenditure, and others. However, to our knowledge, no data currently exist that would map the entire regulatory landscape. By engaging in this effort, we provide researchers, policymakers, entrepreneurs, and other stakeholders with a novel type of data to be used in driving better policy making and innovative initiatives.
The rest of the brief proceeds as follows: first, we describe how State Healthcare RegData could be used by researchers; next we provide a brief overview of the methodology and a summary of the results; we conclude by outlining the next steps for State Healthcare RegData.
Potential Uses of State Healthcare RegData
This policy brief is merely an introduction to State Healthcare RegData and the first part of a long-term endeavor to understand the nature of healthcare regulations and their effect on the provision of healthcare in the United States. It is our hope that researchers will explore these data in detail and combine them with other types of healthcare data (outcomes, cost, coverage, etc.) to gain insights into the effects of regulation on the quality, access, and cost of healthcare and the effects of regulation on the provision of medical goods and services.
Identify and Track Healthcare Regulations
Using State Healthcare RegData, researchers can track the evolution of state and federal healthcare regulations. State Healthcare RegData is especially relevant in 2020 as a regulation-tracking device, as regulations rapidly change in the wake of the COVID-19 pandemic.
With the incorporation of topic modeling in future iterations, QHL researchers will be able to update State Healthcare RegData to help identify areas of healthcare regulation that are currently understudied, with the objective of uncovering opportunities for reform. State Healthcare RegData allows researchers to compare the volume of regulation across states and thereby measure differences in the regulation of certain healthcare industries, professions, goods, and services.
Study the Role of Regulations, If Any, in Health Outcomes and Inputs across States
In addition to comparing healthcare regulatory burden across states, researchers can also examine whether cross-state differences in the delivery of healthcare can be explained by the volume and quality of healthcare regulations. State Healthcare RegData allows for the incorporation of regulatory data into such analyses, which was previously not feasible owing to the textual format of such data.
Methodology
State Healthcare RegData is a unique dataset that was developed using QuantGov’s text analysis and machine learning algorithms to quantify and describe healthcare regulations in US states. In this section, we provide a brief overview of the methodology used in creating State Healthcare RegData. We begin with our working definition of healthcare regulations, then describe the data sources, the data extraction process, and the algorithm. Finally, we describe the metrics or data elements that are available in State Healthcare RegData.
Definitions
The key to State Healthcare RegData is the definition of healthcare regulations. While many areas of public policy aim to improve human health (e.g., regulations on food, alcohol, air quality, and occupational safety), we limit our definition of healthcare to the provision of and payment for healthcare goods and services, such as pharmaceutical drugs and medical devices, hospitals, physicians, nursing care, telehealth, and health insurance. We do not include environmental health and safety regulations, even though they may be related to health, because these regulations are aimed at improving health but not necessarily aimed at the provision of healthcare services.
In addition to defining healthcare, we also define a unit of regulation. A unit of regulation is typically the body of text that is coherently related to a topic. States organize their regulatory codes into a hierarchy, dividing the content as appropriate. For example, Maryland organizes its administrative code into titles, subtitles, and chapters. Each combination of title, subtitle, and chapter deals with a topic or subject area. The titles correspond to agencies, while the subtitles reflect the function the agency is regulating. For example, the regulations for the Maryland Department of Health are filed under title 10, which covers most regulations pertaining to healthcare, including professional licensing. However, regulations pertaining to health insurance, which we include in our definition of healthcare, are filed under title 31, regulations for the Maryland Insurance Administration; the subtitles cover different types of insurance. Therefore, in the case of Maryland, title, subtitle, and chapter serve as a good unit of analysis. For the rest of this brief, we refer to the regulatory unit of analysis as a document.
It follows from this approach that the documents we identify as related to healthcare may contain text that does not pertain to healthcare. For example, it is common for states to include occupational safety and other environmental regulations within the hierarchy of regulations that we consider related to healthcare. Thus, only a portion of the document we identify as being healthcare related pertains to the regulation of healthcare. Unfortunately, this is a necessary compromise. As we describe in the next steps, subsequent versions of Healthcare RegData will be built using models that parse units of regulation by various topics.
Data Sources
The primary data source for State Healthcare RegData is the state regulatory codes of 44 states and the District of Columbia (DC). Data are not available for six states for various reasons. For this first version of State Healthcare RegData, the data were collected from each state between May 2020 and July 2020. Therefore, these are the regulations that were in effect as of this period. This means that regulatory changes made since then are not included in this version of State Healthcare RegData.
Algorithm Design
QuantGov determines healthcare regulatory restrictions in two steps. The first step is to use machine learning algorithms to identify regulatory texts that pertain to healthcare. (This first step is commonly known as training the algorithm.) In the second step, it applies text analysis tools to create the data elements—specifically, restrictions, complexity, and industry relevance.
We create an algorithm that determines the probability that a document pertains to healthcare. While we do not describe the details of the algorithm here, the key function of the classification methodology is to identify the words or combinations of words that are most common in healthcare-related documents. We train the algorithm using sample documents containing state and federal regulations that QHL researchers previously identified as having to do with healthcare; the algorithm demonstrated exceptional accuracy (an F1 score of 0.97 out of 1). We then apply the algorithm to all documents across the 44 states and DC. The output of the algorithm is the probability that a document pertains to healthcare (as we have defined it). A higher probability means that a document is more likely to be related to healthcare.
We determine a probability threshold for the inclusion of documents into the final State Healthcare RegData dataset. All documents whose healthcare probability exceeds this threshold are included.
State Healthcare RegData Metrics
After identifying the healthcare regulations, we proceed to create the data elements, or metrics, available in State Healthcare RegData. The main elements are the total number of regulatory restrictions, the number of words in each document, the complexity of the document (average sentence length, number of conditional statements, and amount of information contained in each document), and the probability that the document pertains to the healthcare industry, as defined by the North American Industry Classification System (NAICS) codes.
We use QuantGov’s text analysis and machine learning algorithms to determine the number of regulatory restrictions in a document, determine the complexity the document, and further classify the document into the industries that could be affected by the regulations in that document. QuantGov identifies regulatory restrictions in a unit of regulation by counting the restrictive terms. These regulatory restrictions are instances of the terms “shall,” “must,” “may not,” “prohibited,” and “required,” and they can signify legal constraints and obligations. The total number of occurrences of these terms is counted in all Healthcare RegData datasets.
In addition to counting healthcare regulatory restrictions, Healthcare RegData also determines which industries, classified by NAICS code, are likely to be affected by a unit of regulation. Using the probabilities and the total number of restrictions identified in the unit of regulation, we derive the number of industry-relevant restrictions, which is the total number of restrictions multiplied by the probability that the unit of regulation applies to an industry. The NAICS two-digit code “62” covers the healthcare and social assistance sector. We examine how the various industries in this broad category are affected by healthcare regulations. In addition, there are other industries, such as insurance carriers, that are affected by healthcare regulations but not in the healthcare and social assistance sector.
Finally, we use Healthcare RegData to examine the complexity of regulations. Complexity refers to the readability of regulatory text and the ease of comprehension. Both are important because, all else being equal, text that is easy to read and understand will have lower compliance costs than text that is more difficult to read and understand. As stated in the Federal Plain Language Guidelines of the US government, complex ideas are easier to grasp when they are presented in a manner that adheres to plain-language principles, such as using short sentences and few conditional clauses.
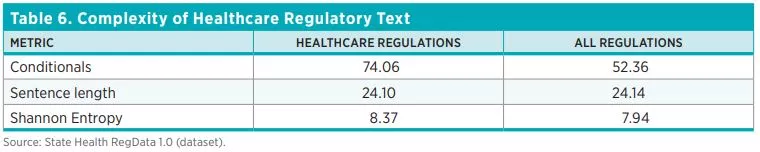
We use three measures of complexity: sentence length (i.e., the average number of words per sentence), conditional statements (i.e., the average number of conditional clauses), and Shannon Entropy (a measure of the average information content in a document). In general, longer sentences are more difficult to read and understand, as are texts that include several conditional clauses and cross-references. And high Shannon Entropy scores mean that the content of the document spans a wide range of topics and concepts. Complex documents contain more information and therefore require more resources to understand and comply with. We discuss the complexity of regulations in the results section of this policy brief.
Results
We now present the preliminary data from State Healthcare RegData 1.0. These data will be updated annually as the algorithms are updated. For each state, we report the total number of healthcare-related restrictions, the number of regulations that are relevant to the healthcare sector, and the share of total regulatory restrictions that pertain to healthcare.
Healthcare Regulations
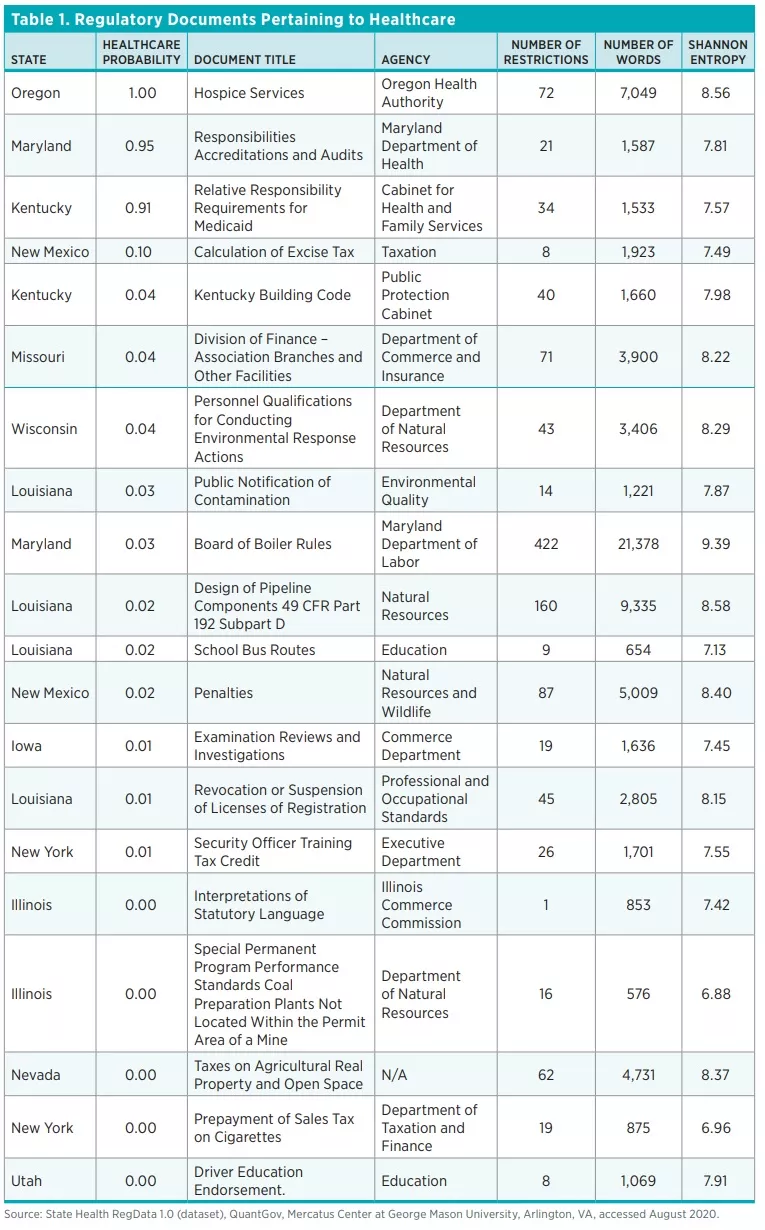
The QuantGov algorithm identified 60,274 units of regulation that pertain to healthcare out of a total of 314,410 units of regulations across the 44 states and DC, representing a fifth of all regulations. Because the algorithm outputs the probability that a unit of regulation pertains to healthcare, the final list of documents we classify as healthcare related are those whose healthcare probability is greater than the decision threshold. Table 1 shows a random sample of the documents the algorithm identified as pertaining to healthcare, ordered by probability.
Total Number of Healthcare Regulatory Restrictions
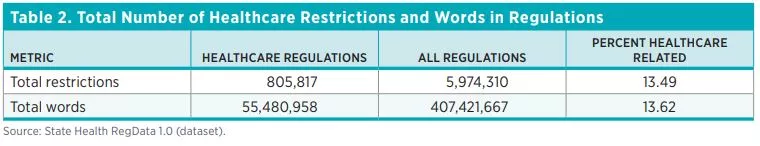
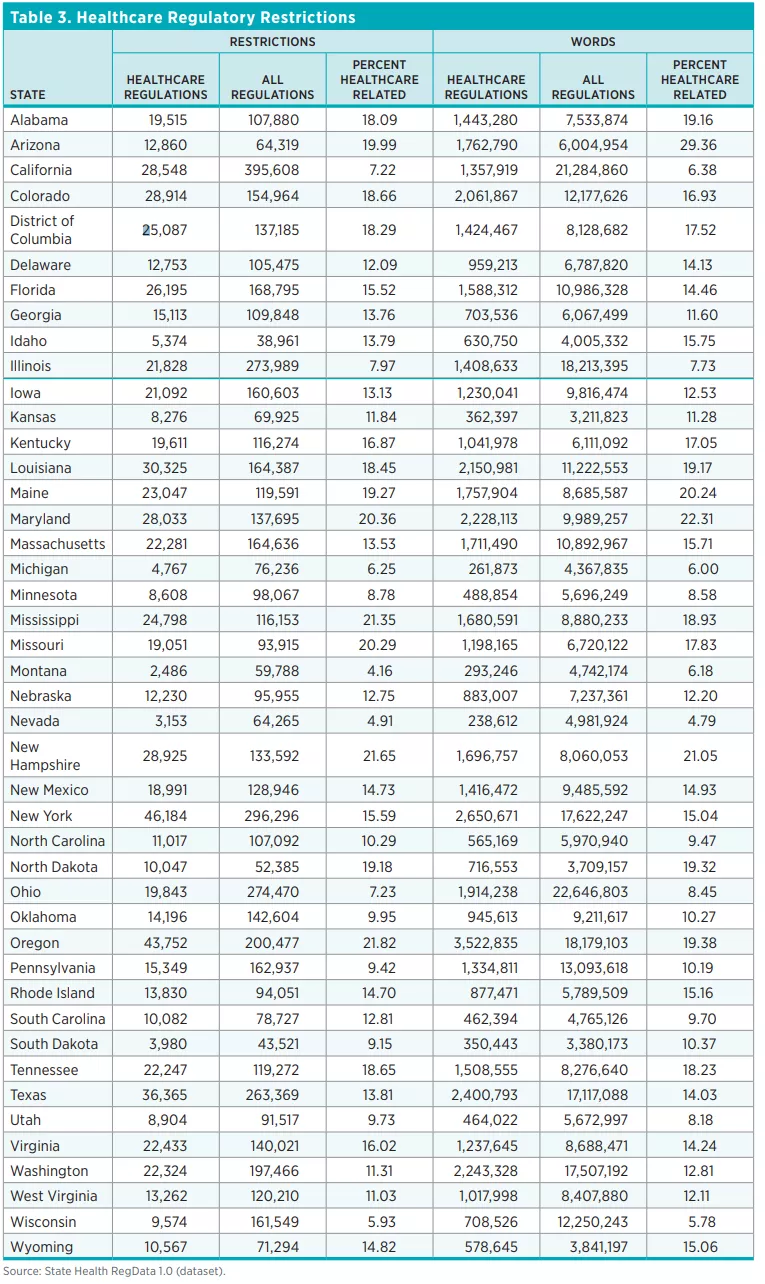
Table 2 shows the total number of healthcare restrictions and words in healthcare regulations and the total number of regulatory restrictions in each of the 44 states and the DC. Across the 44 states and DC, there are 805,817 healthcare restrictions as of July 2020 in more than 60,000 units of regulations deemed to pertain to healthcare. Healthcare regulatory restrictions make up 13.5 percent of all restrictions in these states. By contrast, federal healthcare regulatory restrictions make up only 5 percent of total federal regulatory restrictions. The number of regulatory restrictions varies widely across states. The state with the smallest number of healthcare regulatory restrictions is Montana (2,486 restrictions) and the state with the greatest number of healthcare regulatory restrictions is New York (46,184).

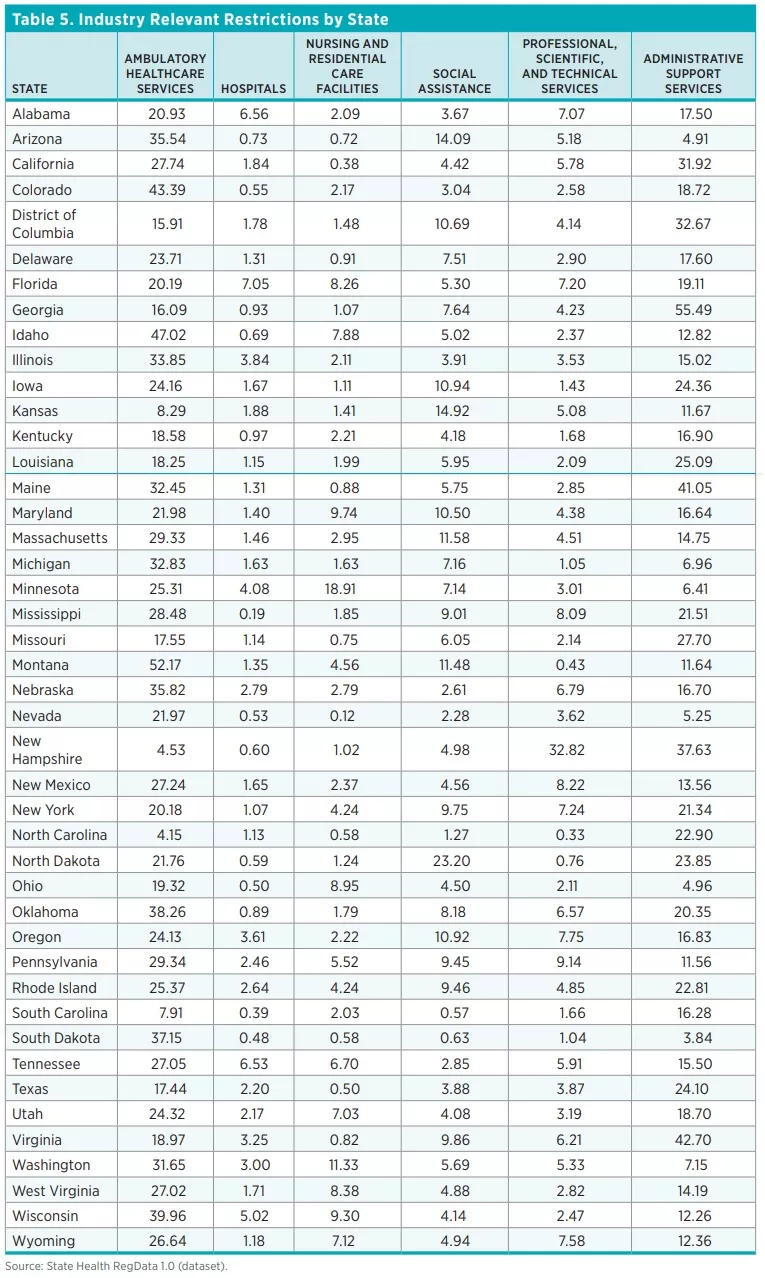
Regulations by Industry
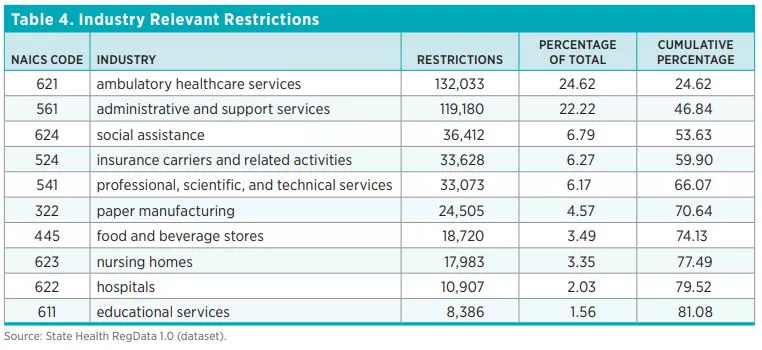
Table 4 shows the top 10 industries most affected by healthcare regulations. They are ordered by the number of industry-relevant restrictions, which are calculated by multiplying the total number of regulatory restrictions in each unit of regulation by the predicted probability that the regulations in that document affect an industry. As one would expect, industries that deal directly with healthcare are the ones most affected by healthcare-related regulatory restrictions. Across all 44 states and DC, the ambulatory healthcare services industry has the most industry-relevant restrictions (25 percent), followed by the administrative and support services industry (22 percent). Out of 84 industries (classified at the three-digit NAICS level), 10 industries account for 81 percent of all healthcare regulatory restrictions.
Complexity of Healthcare Regulations
Table 6 shows the averages for the three measures of regulatory complexity across the 44 states and DC.

Conclusion and Next Steps
In this policy brief, we introduce the first edition of State Healthcare RegData, a quantification of the volume of healthcare regulatory restrictions in 44 US states and DC. We provide a high-level view of the number of healthcare regulatory restrictions, the industries affected by these regulations, and the complexity of the healthcare regulatory text. These data can be used to examine the role of healthcare regulations in healthcare outcomes by comparing regulatory burdens across states. Over the next few months, QHL researchers will continue to improve State Healthcare RegData, further classifying the healthcare regulations identified into various topics of interest. These include certificate of need, scope of practice, telemedicine, and insurance benefits, among others. Using this topic-based approach will allow researchers to examine the impact of specific regulations on outcomes of interest.

