- | Healthcare Healthcare
- | Policy Briefs Policy Briefs
- |
Understanding CBO’s Medicare for All Cost Estimates
In December 2020, the Congressional Budget Office (CBO) released a comprehensive report analyzing the costs of a single-payer healthcare system of the kind usually referred to as “Medicare for All” (M4A). The report has not yet received as much public attention as it deserves, most likely because of ongoing controversies in the aftermath of November’s presidential election. CBO’s M4A federal cost estimates are significantly lower than those produced in other studies (including mine). The CBO report also provides much information about M4A not readily found elsewhere. In particular, the report illuminates the extent to which M4A would increase congestion in the US healthcare system and would likely lead to more denials of sought-after care.
The purpose of this policy brief is to highlight the most significant information and findings in the CBO report and to explain how CBO’s estimates diverge from mine and those in other studies. (Disclosure: I was among many experts who provided CBO with comments on previous incarnations of CBO’s study, though I did not see the final version of the report until it was published. I have not shared with CBO the following analysis, which represents my interpretation alone.)
Page 173 of the CBO report provides a neat capsule summary of why CBO’s cost estimates are lower than other analysts’. Two important factors stand out: “First, CBO projects that the supply of health care under a single-payer system would not meet all of the new demand for care, thus constraining increases in NHE [national health expenditures] more than most other analyses project. Second, CBO estimates lower payers’ administrative spending for the new system than other analyses do.” These two differences are perhaps the most distinguishing features of CBO’s estimates. That said, it is important that lawmakers understand many other aspects of CBO’s analysis.
Before I review the critical elements of CBO’s analysis, the thoroughness and depth of its report warrants praise. Although it is not possible for me to exactly replicate CBO’s projections using solely the information the report contains, the depth and breadth of its analysis of M4A’s costs surpass anything I have seen elsewhere. I learned a tremendous amount from the study, and I expect other researchers will as well. Were I to update my own cost estimates for M4A, my revisions would be affected in several ways by the information CBO has provided.
CBO’s report reflects a laudable institutional commitment to transparency and to broadening the information available—not only to Congress but to academic researchers, press reporters, and the general public. Still, few will have the time or the background required to digest all its 208 pages. This policy brief has been written in an effort to simplify and summarize the differences between CBO’s analysis and my own.
Options CBO Studied
CBO studied five options for creating a national single-payer healthcare system, projecting the cost of each option in a single year (2030). Of the five options CBO analyzed, only one of them—Option 5—really resembles current M4A legislative proposals. This is because only Option 5 contains comprehensive long-term services and support (LTSS) benefits, a common feature of recent M4A bills, including those introduced in the 116th Congress by Senator Bernie Sanders and Congresswoman Pramila Jayapal. CBO found that under this option federal costs would increase dramatically (by $3.0 trillion in 2030 alone), and national health expenditures (NHE) would also increase relative to current law. This increase in NHE would occur even in light of CBO’s aggressive assumptions regarding administrative cost savings and despite its finding that the supply of healthcare services under M4A would be insufficient to meet demand.
CBO also studied four other illustrative options. Two of them (Options 1 and 2) will generally be ignored in this policy brief because they differ fundamentally from existing M4A proposals in that they would require significant patient cost sharing. Existing M4A proposals are consistent in allowing for only very minimal cost sharing by patients. For this reason, neither Option 1 nor Option 2 bears significantly on the likely cost of M4A.
CBO’s scores of Options 3 and 4 provide the most useful comparisons with my previous estimates, for a number of reasons. One is that my 2018 study was based on the 2017 proposal of Senator Bernie Sanders, which lacked the long-term care benefit included in more recent M4A proposals. In other words, my study and CBO’s Options 3 and 4 each understate the costs of M4A as currently proposed, because each of these estimates excludes the costs of M4A’s LTSS benefits.
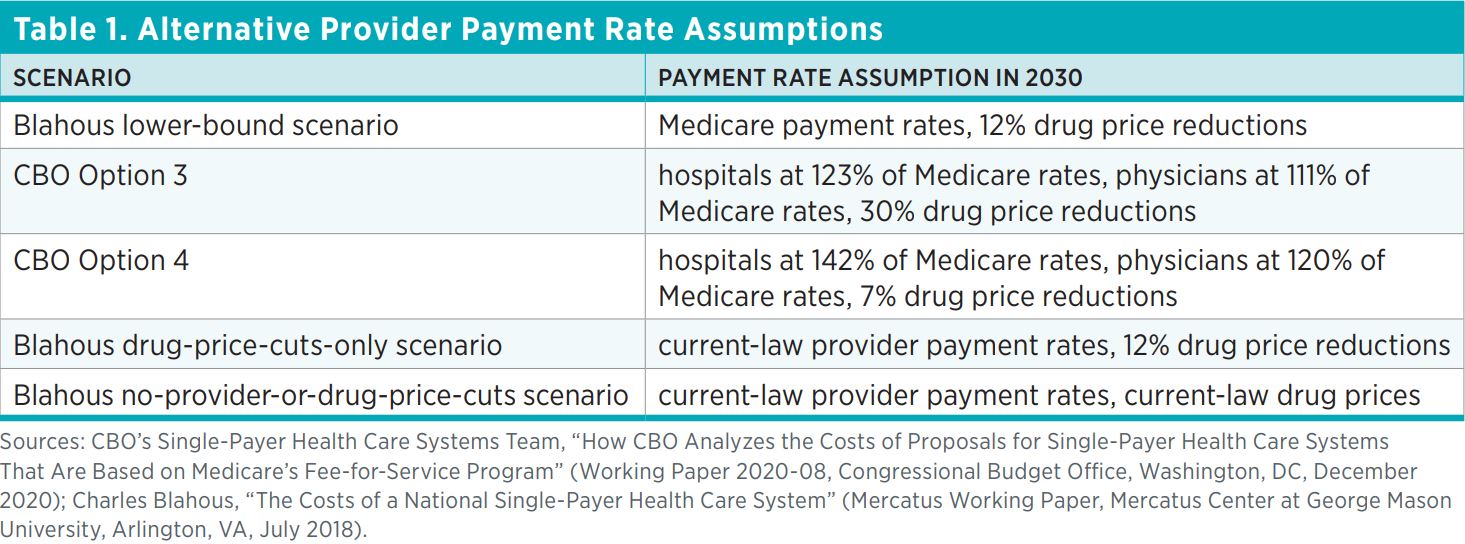
Another reason Options 3 and 4 provide useful points of comparison to my own work is that they employ a similar range of assumptions with respect to provider payment rates. My study included a lower-bound cost scenario that unrealistically assumed that all US healthcare provider payments would instantly be cut to Medicare payment rates (which, for example, are more than 40 percent lower than rates paid by private insurance for inpatient hospital care). My study also provided a higher cost estimate based on the assumption that no such payment cuts occur. CBO’s Options 3 and 4 are similar in spirit to my projection scenarios. CBO’s Option 3 assumes large provider payment cuts, though not quite as large as in my lower-bound estimate. CBO’s Option 4 assumes substantially higher provider payment rates, close to those in my other projection scenarios.
Table 1 compares my assumptions for provider payment rates to CBO’s Options 3 and 4. Understanding the significance of these assumptions requires understanding that Medicare payment rates are substantially below those in the private sector. Hence, the adoption of payment rates under M4A that are at or near Medicare payment rates would mean substantial payment reductions for most providers. Both CBO and I assume substantial drug price reductions in multiple scenarios—CBO’s drug price cut assumption is especially large (30 percent) in Option 3. There is certainly no guarantee that drug prices will fall immediately and dramatically under M4A, so table 1 includes a scenario in which they do not.
Despite some similarities between my payment rate assumptions and those of CBO, and although none of the scenarios in table 1 includes the cost of LTSS benefits, CBO’s federal cost estimates differ greatly from mine. The remainder of this paper explains the reasons for our divergent results.
Broad Categorical Differences between CBO’s Estimates and Mine
Table 2 shows alternative estimates of federal costs under five projection scenarios. To be clear, these estimates refer not to the total cost of M4A, but to the new federal costs that would be created by enacting M4A, above and beyond currently projected federal health subsidies.
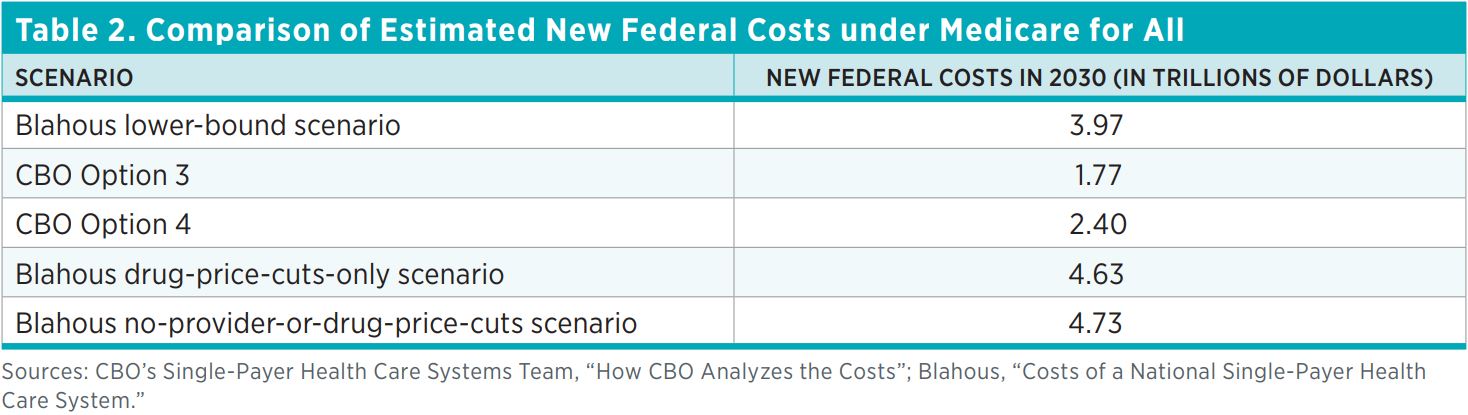 There are large differences between the numbers shown in table 2. For example, CBO’s federal cost score for Option 3 is $2.20 trillion lower than my lower-bound estimate, even though CBO uses payment rate assumptions that are slightly higher than mine. Similarly, CBO’s estimate for Option 4 is $2.23 trillion lower than my estimate for the corresponding scenario that assumes no significant provider payment cuts (only drug price reductions) and $2.33 trillion lower than my estimate for the scenario that assumes no cuts at all, in either provider payments or drug prices.
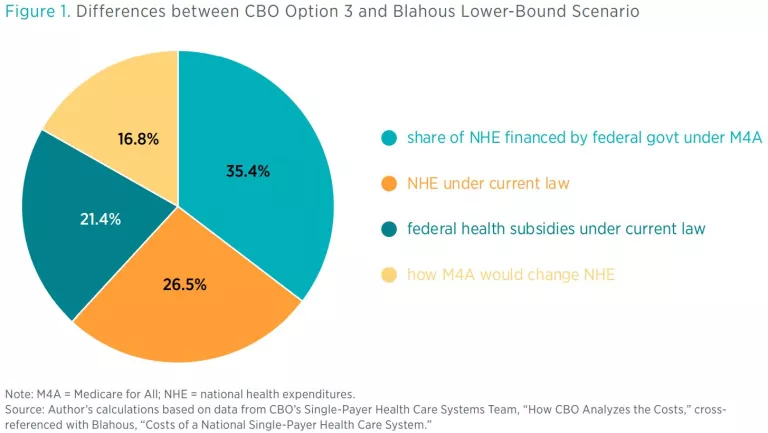
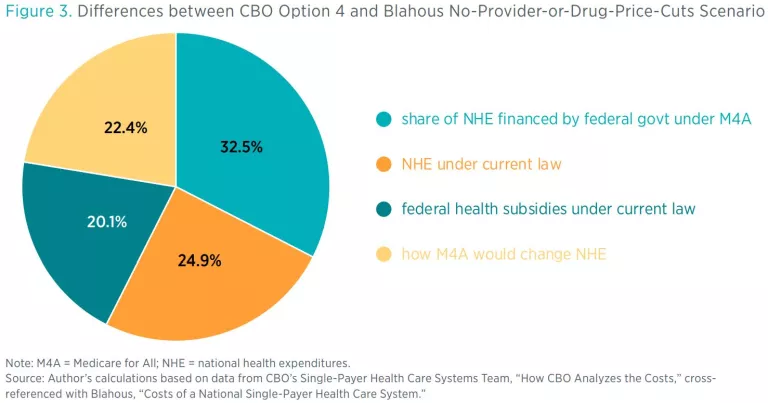
The reasons for these cost estimation differences are numerous and complex, contributing to the 208-page length of the CBO report. In an effort to simplify a complex picture, this policy brief breaks down the differences between the projections into four major categories:
- how M4A would change NHE
- NHE under current law
- the share of NHE financed by the federal government under M4A
- federal health subsidies under current law
Category 1, how M4A would change NHE, is a natural focus of policy interest because it pertains to different estimators’ views of the likely effects of M4A. Yet these projected effects actually turn out to represent a relatively small category of differences between my estimates and CBO’s. As figure 1 shows, only about 17 percent of the difference between my lower-bound cost estimate and CBO’s score for Option 3 is attributable to divergent estimates of the likely effects of M4A on NHE.
Different Takes on Administrative Costs and Denial of Care under M4A
Of the four categories of differences between the estimates, this paper will first break down differences in projections of M4A’s effects on health spending. I start here not to critique any particular set of assumptions, but rather because this is the category of differences most likely to be of interest to policymakers, because it bears on the possible consequences of M4A for NHE and patient access to care.
Roughly 16.8 percent (see figure 1) of the difference between my lower-bound projection of new federal costs and CBO’s Option 3 score pertains to different projections of how M4A would affect NHE. These 16.8 percentage points can be further broken down as follows:
- 18.7 percent from different projections of healthcare utilization,
- 9.7 percent from different assumptions about insurance administrative costs,
- −11.6 percent (i.e., a partially offsetting amount) from different assumptions about provider payment rates.
In other words, CBO’s Option 3 foresees less healthcare utilization and lower administrative costs, as well as higher provider payment rates, than I assumed in my lower-bound estimate.
We can conduct a similar comparison between CBO’s Option 4 and my higher payment rate scenarios. For example, the 22.4 percentage points of difference between CBO’s Option 4 and my no-provider-or-drug-price-cuts scenario (see figure 3), with respect to how M4A would affect NHE, break down as follows:
- 11.8 percent from different projections of healthcare utilization,
- 8.9 percent from different assumptions about insurance administrative costs,
- 1.7 percent from different assumptions about provider payment rates.
As this last breakdown shows, the issue of provider payment rates becomes less important when one compares my higher-cost projection scenarios and CBO’s Option 4, for the simple reason that neither scenario envisions significant payment cuts. But no matter whether one compares CBO’s Option 3 to my lower-bound estimate or CBO’s Option 4 to my higher ones, the biggest factor within this category of projection differences has to do with the different projections of healthcare utilization. The reasons for those differences are, in turn, rooted chiefly in estimating how much care would be denied under M4A, an issue likely of great interest to policymakers.
To further break down the differences in our projections, I will first delve first into the administrative cost assumptions. This is not the most significant of differences quantitatively, since it represents less than 10 percent of the total difference between my estimates and CBO’s. I nevertheless turn first to the administrative cost assumptions because they feed into other important results in the projections.
The CBO report assumes much lower insurance administrative costs than other studies, including mine. CBO recognizes this difference and devotes a substantial portion of the report to explaining its lower administrative cost estimates. CBO provides a detailed list of administrative functions currently performed by US health insurers, it and estimates how each would change (usually by being reduced, sometimes by being eliminated) under a single-payer system. CBO then adds up the costs associated with the remaining administrative functions to arrive at total administrative cost rate estimates of 1.5–1.6 percent for M4A for Options 3 and 4.
CBO’s administrative cost rate assumptions for M4A are not only lower than other analysts’ estimates, they are substantially lower than administrative cost rates in other US public insurance systems and in single-payer systems abroad, as table 3 shows.
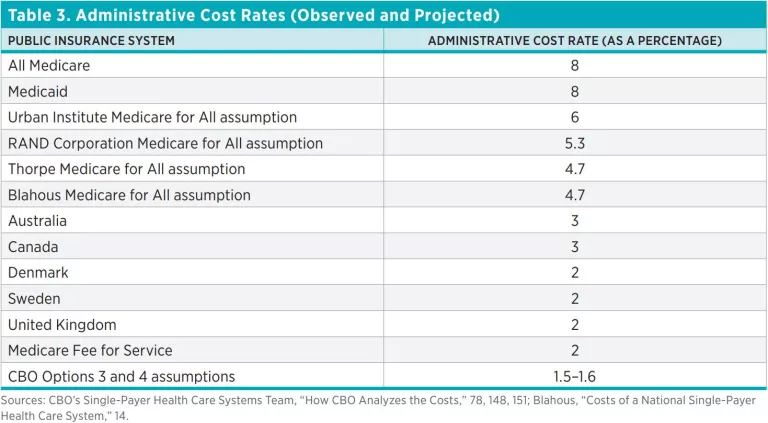
It’s also worth noting that the international single-payer systems shown in table 3 have many years of experience administering their programs and that other public insurance systems in the United States, such as Medicaid and Medicare Advantage, have substantially higher administrative cost rates than CBO assumes for M4A. Having reviewed the details of CBO’s administrative cost assumptions, I am persuaded that the potential for administrative cost savings may be larger than I previously assumed, yet the difference these potential savings can make to the overall estimates is limited. Were I to plug in the most aggressive assumption for administrative cost savings I would deem realistic after reading the CBO report, it would only change my estimate for total NHE under M4A by substantially less than 2 percent.
CBO’s assumptions for reductions in healthcare providers’ administrative duties are also aggressive. These assumptions are important because they affect the amount of care it is assumed providers can deliver when their time is not absorbed by administrative tasks. For example, CBO finds that nurses spend 23 percent of their time on administrative tasks, and assumes that under M4A, this administrative time would be reduced by 80 percent. For physicians, CBO’s corresponding numbers are not as great but still very large. CBO further assumes that time saved from administrative tasks would allow physicians and nurses to substantially increase the amount of healthcare they provide. These assumptions of provider administrative time savings thus feed into estimates of healthcare utilization under M4A.
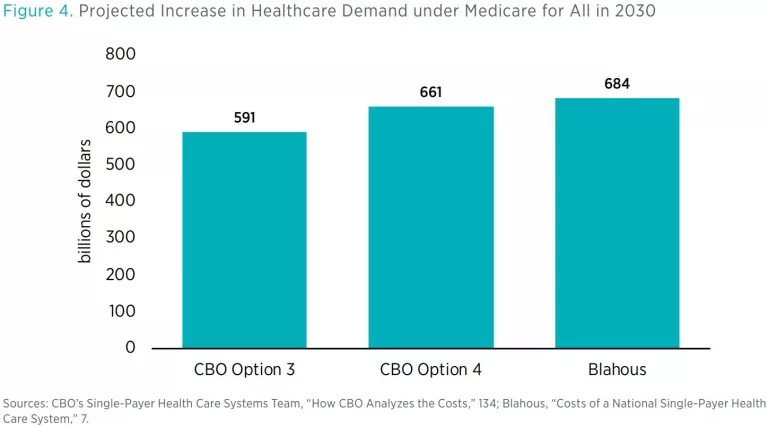
CBO’s estimates of utilization under M4A are substantially different from mine, even though our estimates of the increase in demand under M4A are quite similar. Like other experts, we foresee an increase in health service demand under M4A, because M4A would expand health insurance coverage and make coverage more generous for those who already have it. Our estimates of the total national demand increase are both in the range of 11–12 percent over current law (see figure 4).
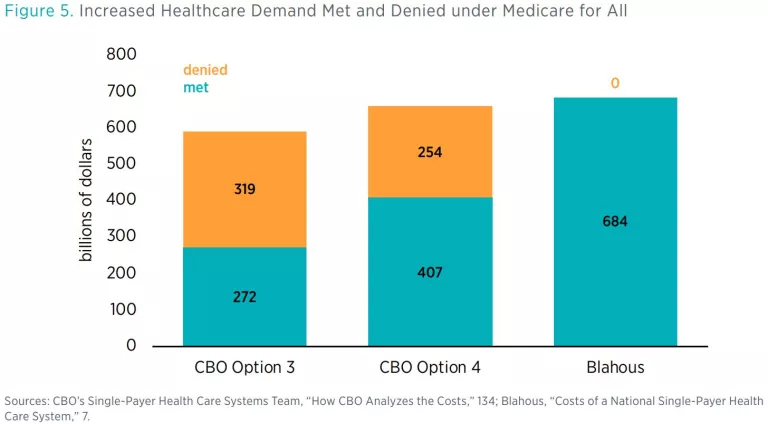
By contrast, CBO devoted a significant portion of its report to estimating the extent to which Americans would be denied care they sought under M4A. CBO projected that total healthcare would increase, but not by nearly as much as demand would increase. The demand increase under M4A would therefore produce two simultaneous phenomena: an increase in utilization and an increase in denial of care being sought. In sum, because of increased congestion in the healthcare system under M4A, there would be a substantial increase in the instances of Americans seeking healthcare without being able to receive it. Figure 5 provides the numbers.
Recall, however, CBO’s assumptions for physicians’ and nurses’ time saved from administrative tasks and its assumption that these time and resource savings would translate into increased care. For example, CBO assumed that 80 percent of nurses’ time spent on administrative activities would be eliminated. While I agree that M4A has the potential to reduce providers’ administrative activity, I am less certain that so great a percentage would be eliminated, especially in an environment where more time is required to prioritize patient access to an inadequate supply of care. It therefore seems important to know how much of the increased demand for care under M4A would go unmet if administrative activities are not reduced by as much as CBO assumed.
For figure 6, I have calculated how much of the increased healthcare demand under M4A would be met or denied, using the following assumptions:
- The healthcare demand increase is as projected in my 2018 study.
- Provider payment rates are set as in my 2018 study (e.g., Medicare payment rates in the lower-bound estimate, no provider cuts in the higher estimates) and CBO’s methodology is applied to determine the resulting effects on healthcare supply.
- The reduction in administrative activities is half as large as CBO assumes (e.g., 40 percent of nurses’ time saved rather than 80 percent).
- The supply of prescription drugs is fully able to meet increased demand (from the CBO report).
- Additional care is provided to those opting out of M4A (from the CBO report).
- Supply increases in unspecified ways to fill 15 percent of the resulting supply-demand gap (from the CBO report).
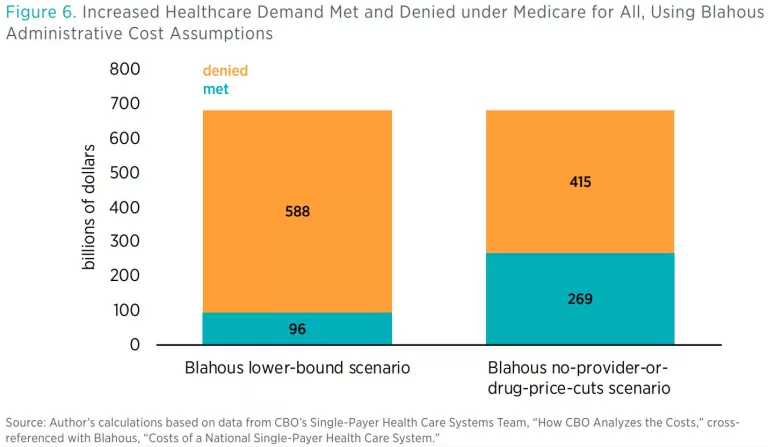
The details underlying these numbers only accentuate these concerns. In the left bar in figure 6, $81 billion of the $96 billion in increased healthcare supply consists of increased prescription drug supply, which CBO assumes can and will expand to fully meet demand. This means that under my modified calculation of less-complete administrative time eradication—and if M4A pays providers at Medicare rates—only about 2–3 percent of the increased demand for hospital, physician, and other healthcare services under M4A could be met, with the rest of the demand increase simply resulting in denial of care.
My 2018 study identifies my lower-bound cost estimate as an unlikely result and finds that actual costs under M4A would likely be substantially higher. CBO’s analysis provides a basis for stating that expectation more firmly. It does not seem plausible that Americans would accept the enormous new tax burdens associated with M4A only to see their resulting increased demand for healthcare services go almost entirely unmet. CBO’s analysis of the constraints on healthcare supply helps policymakers to understand more clearly why my lower-bound projection (and CBO’s Option 3) are almost certainly unrealistically low-cost estimates and why M4A would in practice cost far more.
Other Differences in the Cost Estimates
Other differences between CBO’s cost estimates and mine are mostly unrelated to M4A itself. Some of these involve differences in estimating federal health subsidies under current law or in estimating health spending by other payers under current law. Oftentimes the differences between our numbers reflect changes in current-law projections since my study’s publication. Other differences arise because CBO provides estimates for spending I did not attempt to quantify, such as spending on services by individuals seeking care outside the M4A system and certain other spending CBO concludes would continue to be done by other payers instead of being absorbed by M4A.
The previous sections of this brief quantified differences between CBO’s estimates and my own, with respect to the effects of M4A on NHE. The three remaining broad categories of differences between our projections are as follows.
Estimates of NHE under Current Law
Differences between CBO’s and my estimates of NHE under current law account for 24.9–26.5 percent of the total difference between our estimates, depending on the scenarios compared. M4A would require the federal government to assume responsibility for the vast majority of spending now done by others in the US healthcare system—for example, by private insurance, by state and local governments, and by individuals out of pocket. Because under M4A the federal government would absorb most of the NHE occurring under current law, a central task in estimating the new federal costs of M4A is projecting how much NHE there would be. The authoritative source for these NHE projections is the Centers for Medicare and Medicaid Services (CMS).
CMS’s projections for NHE have been lowered somewhat since my study was performed. My study relied on CMS projections extending as far as 2026, which I extrapolated beyond that date. CMS’s latest estimate of 2026 NHE is about $150 billion below the one I used. The gaps between the different projections widen in later years. An estimate for NHE in 2030 based on CMS’s most recent projections might be about $250 billion to $300 billion lower than the one I employed.
Additionally, CBO has derived its own estimates for NHE that are lower than those reported in CMS’s latest publications. Specifically, CBO projects slower health cost growth as part of the economic fallout of the pandemic. By 2028 CBO’s estimates for NHE are 4.4 percent lower than CMS’s—and, again, these differences widen over time. It’s reasonable to approximate that by 2030 CBO’s estimates might be about 5 percent lower than CMS’s. Thus, where CBO projects NHE of $6.6 trillion in 2030, a projection consistent with CMS’s most recently published estimates would likely be about $300 billion higher, or $6.9 trillion.
In summary, for my study, I used an estimate for NHE in 2030 of about $7.2 trillion, whereas CBO’s report estimates about $6.6 trillion. Roughly half of the difference between these NHE baselines appears to reflect downward revisions by CMS after my study was performed, and the other half reflects downward revisions by CBO relative to CMS. Our different starting points for NHE account for about a quarter of the total difference between my federal cost estimates and CBO’s.
Share of NHE Financed by the Federal Government under M4A
Differences between CBO’s and my estimates of the share of NHE financed by the federal government under M4A account for 32.5–35.4 percent of the total difference between our estimates, depending on the scenarios compared. This means that approximately one-third of the total difference between CBO’s federal cost estimates and mine pertains to spending that would continue to be done by payers outside the federal government. Note that this spending affects the federal cost estimates but does not change total NHE under M4A, because the spending would continue to occur through other channels.
CBO identified several categories of such health spending, including spending by state and local governments, by philanthropies, and at work sites, covering a wide range of health-related activities that include public health services and medical-sector investment. While I believe that some of this spending is likely to be absorbed or crowded out by M4A, I also believe that CBO is correct to conclude that some would continue outside the federal system.
Somewhat smaller but also affecting the calculations are divergences in the amount of spending assumed to occur out of pocket. My estimates of out-of-pocket spending were remarkably close to CBO’s in several areas, including out-of-pocket spending on LTSS and prescription drugs, as well as on cosmetic care that M4A would not cover. The primary differences between our out-of-pocket estimates are due to CBO projecting (reasonably) that a certain amount of physician and other healthcare services would be provided outside the M4A system. By contrast, I did not attempt to estimate how many providers would opt out of M4A. The remainder of the difference here involves the out-of-pocket costs of over-the-counter medication, which are part of NHE even though they would not be covered by M4A.
Also in this category are state Medicaid costs that would continue under M4A, most notably continued spending on LTSS under the options discussed here. However, these costs did not contribute appreciably to the difference between my cost estimates and CBO’s.
Federal Health Subsidies under Current Law
The last part of the difference between my estimates and CBO’s pertains to the starting point for federal health spending under current law. Any health spending that the federal government is already doing would lessen the net new costs of enacting M4A. CBO’s starting point for federal subsidies under current law is somewhat higher than mine. Differences between CBO’s and my estimates of federal health subsidies under current law account for 20.1–21.4 percent of the total difference between our estimates, depending on the scenarios compared.
Part of the difference here is simply due to legislative events subsequent to my study. For example, in December 2019, federal lawmakers repealed several taxes previously imposed in the Affordable Care Act, including the “Cadillac tax” on high-premium health insurance plans. Repealing this tax eliminated substantial direct revenue the federal government had projected to collect in the future, amounts that would have escalated in later years because of how the tax’s applicable thresholds were set. Eliminating this source of federal tax revenue increased the net health subsidies the federal government is now projected to provide. Repealing the Cadillac tax increased federal health subsidies in other ways as well. The tax had been projected to slow the growth of employer-provided health insurance premiums, thus increasing the share of worker compensation received in the form of taxable wages. By repealing the tax, federal lawmakers reduced workers’ projected taxable take-home pay, thereby reducing federal revenues and worsening budget deficits.
Other Affordable Care Act taxes repealed in late 2019 include a medical device tax and an annual fee for health insurance providers. The federal revenues eliminated by these various tax repeals are substantial, totaling to more than $75 billion in 2030 alone. One possibly useful way to conceptualize these actions is that, in effect, a part of my previous score for the federal costs of M4A has already been put on the federal books by lawmakers, via their subsequent actions to cut federal health-related taxes and thereby increase net federal health subsidies under current law.
Other differences between my previous estimates of current federal subsidies and the estimates in the CBO report involve subsidies not quantified in CBO’s annually updated health budget baseline projections, including tax preferences for employer-sponsored coverage of individuals older than 65, mandatory health spending through the US Department of Defense, federal employee health benefits, and discretionary appropriated health spending. CBO’s choice of the year 2030 for its report’s illustrative year also appears to be a small factor, because 2030 appears to be a year in which 13 monthly Medicare payments will occur rather than the usual 12. In sum, CBO’s report captures some current-law federal health subsidies that my previous estimates did not; these are not large enough to make a substantial difference in the projections, but they nevertheless do affect the final numbers.
Conclusion
CBO’s report on the costs of Medicare for All is a useful resource for lawmakers, academic researchers, and the general public. Although I expect that an update of my study would still produce larger federal cost estimates than CBO currently projects, CBO’s report demonstrates that new federal costs under M4A are likely somewhat smaller than I previously projected. Primary reasons for this include the amount of healthcare that Americans would continue to pay for in other ways and the fact that the federal government has taken on added health costs under current law. These factors decreasing the federal cost of M4A would be partially offset by other factors pushing costs upward, including long-term care benefits that are now common to M4A proposals, as well as increased evidence that M4A’s provider payment rates would be set substantially higher than in my previous lower-bound estimates. The most notable factor holding down total

