- | Monetary Policy Monetary Policy
- | Policy Briefs Policy Briefs
- |
The Economic Situation, March 2019
Goodbye, Goldilocks. Hello, Yellow Flag.
America is now well into 2019’s first quarter, and 2018’s much-celebrated Goldilocks economy seems to be a thing of the past. After a bruising government shutdown, and with ongoing trade war negotiations, a Federal Reserve (Fed) that seems to be changing horses—from higher to lower interest rates—midstream, and a slowing world economy, uncertainty is rising and forecasters are understandably trimming back expectations for the year. The most recent 2.6 percent reading for fourth-quarter GDP growth, which broke the previous 3.0 percent trend, may be an accurate harbinger of what Americans will see for the year.
Suddenly, it seems the Goldilocks economy, detected just 90 days ago, has hit some major potholes. Yes, the three bears did come home. Indeed, the bears appear to be in charge of things. After taking account of the government shutdown effects, a nervous Fed, trade wars, and a slower world economy, I have reduced my 2019 GDP growth estimate from the happier 3.1 percent reported in December to a possible 2.3 percent, though I still pull for 2.8 percent. (I haven’t quite given up on Goldilocks!) I should point out that the January 30th Congressional Budget Office’s annual assessment of the US economy indicated that 2019 would register 2.3 percent GDP growth and that 2020 would bring 1.7 percent. For a comparison, I note that Wells Fargo’s February 15th forecast calls for 2.5 percent growth in 2019 and 2.2 percent for 2020. No, 2019 isn’t what it used to be.
We have a yellow flag signaling caution. Will Goldilocks come back? Will the economy get even worse? What about a recession? Is one on the way?
These are typical questions I receive when making presentations on the economy. I have a quick answer, at least for now: “A recession is not in the data for 2019,” I respond. “But I can’t say about 2020.” I should add that the economy’s Goldilocks sheen isn’t completely eliminated; it’s just duller than what it was in November 2018.
In this report, I first provide more detail on the strong US economic performance where, until recently, things seemed “just right.” I then discuss the effects of the 35-day government shutdown, describe issues related to Fed policy controversies, and to illustrate how major industries are affected, I provide a brief assessment of auto industry challenges and discuss the relationship between gold and the price of oil. Our regular state spotlight, written by Patrick A. McLaughlin and Stephen Strosko, focuses on Nebraska, which is one of the country’s stronger state economies. The report ends with reviews of a couple of books from Yandle’s reading table.
Are the Bears in Charge?
Until the December financial market sell-off raised questions about the health of the real economy and caused consumer confidence to head south, some who keep a close eye on fundamental data thought the US economy was just right. As Kimberly Amadeo wrote in The Balance, “The GDP growth rate is expected to remain between the 2 percent and 3 percent ideal range. Unemployment is forecast to continue at the natural rate. There isn’t much inflation or deflation. That’s a Goldilocks economy.” Indeed, in some ways, it may have seemed even better than Goldilocks. After all, real GDP growth had accelerated from 1.6 percent in 2016 to 2.3 percent in 2017 and was expected to hit 3.0 percent in 2018. A few days before Amadeo’s happy September 2018 commentary, CNBC’s Art Cashin summarized Fed Chair Jerome Powell’s economic assessment this way: “Powell ‘pulled a Goldilocks’ and said policy is just right.” In addition, consumer confidence surveys showed strong readings for the current situation as well as for the future. We seemed to be on a roll. But something happened.
All these sunny assessments were a bit before President Trump expressed deep displeasure with Chair Powell and suggested that he was thinking about replacing him. Later, writing from the January Davos, Switzerland, conference, the Wall Street Journal’s Greg Ip took a longer view. He surmised that “a year ago the world looked like it would finally return to the boom times it enjoyed before the global financial crisis. Now the boom may be over before it even started.” Ip’s take on the situation reminds us of the bear part of the Goldilocks story.
What about those bears? What might they be? And are they really devouring part of 2019’s hoped-for GDP growth? I suggest there are three dark clouds in an otherwise sunny sky. Each one is of our own making, and therefore, hopefully, each one is temporary. The first is government shutdown, the second is monetary policy uncertainty, and the third is trade policy. Trade disruptions and related uncertainty are bringing major disturbances to farming and parts of the manufacturing economy that portend higher tariff-induced input prices and diminished Chinese markets owing to retaliatory tariffs. Instead of laying plans to buy new combines, having lost some of their Chinese market for soybean and grain, farmers are worried about paying for what they already own.
Data on manufacturing from the Bureau of Labor Statistics indicate that employers have accelerated their hiring of temporary workers. News from the auto industry tells us that major global producers are reshuffling plans for which cars to produce, where to produce those cars, and for which markets. These and other major industries are dinged by regime uncertainty; they cannot predict “what the king will do.” The warning flag is waving, and investment decision makers are hesitating.
As for monetary policy, there is no way to know at this point if the Fed’s actions over the next 12 months will be “just right.” While interest rate increases have already been promised, the Fed chair in November took a softer stance on the matter and ratified this position in January. The question is how the economy will react. If those increases turn out to be too “hard” (i.e., heavy-handed), then sectors that rely on long-term borrowing, such as construction, will take a blow. The economy will stumble and slower growth will take hold. Based on what I see and read now, I expect that we will experience at least a couple of Fed rate increases this year, with the first occurring in June. Higher interest rates do seem to be in the works, but the increases for the year should not add more than 50 basis points to the 10-year note.
Finally, government shutdown has both short- and long-term effects. On the short side, we see losses in GDP growth caused by delayed income for and associated spending by the more than one million affected government employees and contractors. As discussed next in the report, it’s possible that these effects will trim half a percent or more from GDP growth for the year’s first quarter. However, also as noted later, resumption of government activity and provisions of back pay will give a positive bump to second quarter’s growth.
The longer, more corrosive shutdown effect is real but far more difficult to measure. This relates to postponed investment and other economic activity that relies heavily on government permission and services. Ours is a government-intertwined economy. When the permit-issuing agencies are closed, affected activity moves to a standstill. And when government workers return, there is no back payment for lost opportunities.
Any one of these three bears, if angered—trade wars, Fed action, and shutdown—poses a threat to an otherwise happy situation. Two or three of them growling in tandem could push the economy into a mild recession. Until December 2018, strong GDP growth, the lowest unemployment rate in almost 50 years, and a stable price level were just right. Let’s look closer at the shutdown.
The Shutdown and Mr. Trump's Wall
In late January President Trump and Congress ended a drawn-out shutdown triggered by congressional reaction to the president’s promised $5.7 billion wall along the nation’s southern border. This was done with an indication that yet another shutdown might come unless the president and Congress reached an agreement for funding a security wall along the US-Mexico border. As it turns out, the second shutdown was avoided. At the time, the federal government had been partially shut down for 35 days, or roughly 10 percent of the year. This was a result of Mr. Trump’s refusal to sign a budget bill because it did not provide funding for the wall. House Democrats would not talk money as long as the government was shut down. Mr. Trump wouldn’t budge on reopening government until he got the wall he had promised when running for office. The partial government shutdown seriously affected 800,000 laid-off federal workers and was expected by some to take a meaningful bite from GDP growth.
Chairman of the Council of Economic Advisers Kevin Hassett predicted that some 0.13 percentage points would be subtracted from growth for each week while the shutdown was in effect. Five weeks meant GDP growth would be down by 0.65 percentage points. For a $20-trillion-plus economy, that’s $130 billion, on an annual basis. For just the 35 days of interrupted government service, the $130 billion becomes about $13 billion, which seems like a lot to pay for a $5.7 billion wall. Of course, once government is operating full bore again, and back pay is provided to federal workers, GDP growth will accelerate and at least partly offset the previous weaker period.
Hassett’s estimate was later confirmed by economists with the Congressional Budget Office. They estimated that the first quarter’s GDP growth would be reduced from 2.5 percent to 2.1 percent, which was quite a drop from 2018’s estimated 3.0 percent growth. Mark one for the three bears, zero for Goldilocks.
Since individuals do not get billed directly when GDP growth falls, the loss is both everyone’s and no one’s in particular. Maybe that’s why a running tally of the GDP penalty never made the evening news. Even though GDP growth will recover at least partly from the shutdown shock, its long-run potential cannot be made whole again. For example, patents that may have been issued 30 days earlier by the US Patent Office will arrive, but without making up for lost time and economic activity related to them. Merger approvals that might have been accomplished by the Federal Trade Commission will take place when work resumes, but the newly approved entity will not receive an extra shot of capital to make up for the lost time and revenue.
The same can be said about the pending passports and related vacations that were canceled, EPA construction permits and the affected factories, schools and hospitals that started late, arrangements for cancer victims to participate in trial medication, FDA drug approvals, national park camping trips, FCC removal of burdensome rules, late flights caused by missing FAA air traffic controllers, and reports on GDP growth from the Department of Commerce. Yes, the wheels of government will turn again, and GDP growth will resume. But because delays are costly and time is money, there will be no back pay for much of the lost growth caused by the extended shutdown.
Should such partial shutdowns of the federal government be used by presidents as leverage for getting their way? That is a tough and loaded question. Perhaps, a better approach to the issue is to require the Congressional Budget Office to provide weekly reports on the effect of government shutdowns whenever they occur.
I now focus on the next bear, interest rates and the Fed.
Interest Rates and the Fed
The relationship between presidents and central bankers is perhaps tense at best, and stormy all too often. Politicians who hope to keep their jobs like low interest rates to pass along to their constituents, especially just before elections. Central bankers, on the other hand, worry about price stability and long-term economic growth, not next year’s election. It’s no wonder, then, that President Trump is sending “I don’t like what you are doing” signals to Fed Chair Jerome Powell. After all, Mr. Powell had promised two to three additional interest rate increases over the next year. The stair-step increase is part of a plan to “normalize” interest rates following the near-zero rates set by the Fed to counter the Great Recession.
No matter the logic, the Fed’s plan does not please Mr. Trump. According to the president, Mr. Powell is “goofing up his numbers” and “almost looks like he’s happy raising interest rates.”
While Mr. Trump has his own special way of expressing anger at the central bank, I don’t think America has ever had a president who had a love affair with the Fed. George H. W. Bush, for example, blamed the Fed for raising rates at just the right moment to torpedo his efforts to win a second term. Harry Truman took Fed leadership to task over interest rate increases that were slowing the postwar economy and, of greater concern to him, diminishing the value of war bonds held by patriotic citizens who helped finance World War II.
Unfortunately, easy money and low interest rates, if pursued long enough, always lead to inflation and, perhaps paradoxically, higher interest rates later on. In extreme cases observed worldwide, following the political takeover of central banks, the high rates of inflation that follow destroy the purchasing power of savings, disrupt economic life, and eventually erase an affected nation’s wealth. The extent of disruption can be seen in escalating inflation rates.
According to Statista, 2017’s worldwide top 10 countries with the highest inflation based on year-over-year price level increases were Venezuela (653 percent), South Sudan (182 percent), Democratic Republic of the Congo (42 percent), Libya (32 percent), Angola (30 percent), Sudan (27 percent), Argentina (27 percent), Egypt (27 percent), Suriname (22 percent), and Yemen (20 percent).
If a lender were thinking about making a one-year loan in Egypt and considering what interest rate to charge, he would start by adding something to 27 percent. Inflation causes nominal interest rates to rise. And central bank behavior causes inflation.
We should give Mr. Trump credit for knowing all this, which suggests that his exchange with Chair Powell is more about differences of opinion regarding the need to raise rates at this time in order to nip inflation in the bud. Unfortunately, economic science doesn’t offer precise guidance on if and when to raise rates. While weak on this question, economic science is robust in predicting what happens to inflation when the money valves stay open for long periods.
The relative certainty about money and inflation combined with common sense regarding politicians’ affinity for easy money have led to the building of institutional safeguards that limit political access to central bank controls. In America’s case, the limits were set following World War II when the Fed and the US Treasury had cooperated in pegging long-term bond interest rates at 2.5 percent to fund the war. Once the war was over and inflation was rearing its ugly head, with 1948 Consumer Price Index inflation hitting 10 percent, the Fed and the Treasury sought to take an anti-inflation position and raise rates.
As mentioned earlier, President Truman was livid. He did not like it when war bond values started falling in association with higher interest rates. He felt the patriotic public was being robbed. Out of the controversy came what is called the Accord of 1951, an agreement between the Treasury and the Fed that the Fed would manage monetary policy and the Treasury would manage debt, with the Fed being kept independent from the other branches of government. The agreement has prevailed since then, except during the recent Great Recession, when the Fed and the Treasury cooperated in keeping rates low. Out of that Great Recession experience came a Fed balance sheet swollen to unprecedented levels, with more than $4 trillion in government and government agency bonds. Fed decisions regarding runoff at maturity of these assets is another version of decisions to raise rates. One is a substitute for the other.
America has now come full circle. Mr. Trump is troubled by the Fed’s intention to tighten credit and raise rates following the unusually low rates set after the Great Recession. The Fed believes the time has come to revert to its anti-inflation norms. Mr. Trump thinks otherwise. Inflation, whether it is accelerating or not, is critical to Fed behavior, given its modus operandi. But no matter the difference of viewpoints or the heat of the rhetoric, one thing is certain: Fed independence should not be compromised. Loss of independence is a win for the bears.
Autos and the Economy: GM, President Trump, and Adam Smith
Back in November, General Motors CEO Mary Berra announced the closing of five underutilized North American manufacturing plants and the planned termination of 15,000 employees. President Trump reacted in typical fashion: “Very disappointed with General Motors and their CEO, Mary Barra, for closing plants in Ohio, Michigan and Maryland,” Trump posted. “Nothing being closed in Mexico & China. The U.S. saved General Motors, and this is the THANKS we get! We are now looking at cutting all @GM subsidies, including . . . for electric cars.”
Later, cooler heads indicated that while a government bailout did cause GM to avoid bankruptcy, it did so without requiring assurances of future production and employment. Also, there are no direct GM electric car subsidies. Those go to consumers who purchase electric cars, not to auto producers. But of course, the subsidies matter a lot to the producers.
Obviously, CEO Berra faces a severe challenge: GM’s overall sales are falling. Auto consumers no longer line up to buy her company’s sedans and small economy cars. Trucks, SUVs, and crossovers are hot. The rest of her line is not.
And it’s not just a GM challenge. All major auto producers, to differing degrees, face a market-driven dilemma, one that has been brewing for a long time. When combined with cheap gas, pickups and other large, roomy, and safe truck-like vehicles are the toast of the town. Smaller, cramped, and less safe vehicles are just toast. For example, in January, Ford Motor Company, having reported poor financial results for 2018, announced restructuring plans. Like GM, Ford depends heavily on the sale of pickups and SUVs, but those sales are not enough to solve the firm’s fundamental economic problem. While dealing with the Brexit unknown and when hit heavily by tariffs on steel and aluminum, Ford must also discontinue some sedans and shutter some plants.
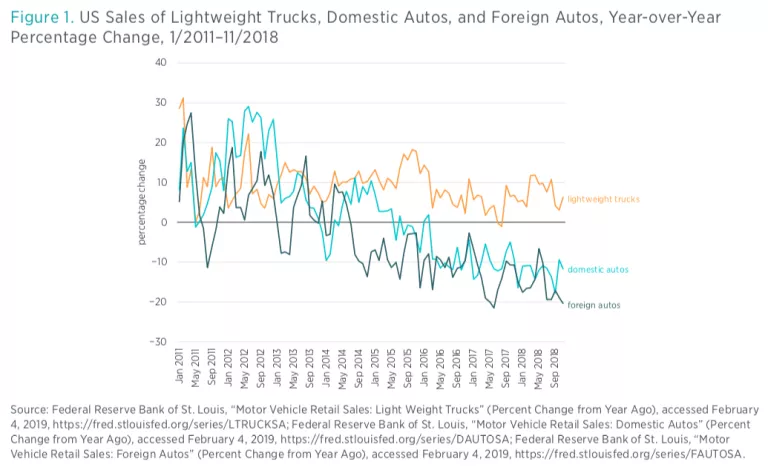
See figure 1, which shows US annual growth in unit sales of light trucks (which includes SUVs) and domestically and foreign-produced passenger cars from January 2011 through November 2018. Trucks and SUVs have maintained a positive growth path. Passenger cars have experienced sharply falling growth rates and, since 2015, increasingly negative rates of growth.
The US auto industry’s task is not to counter expanding shipments of foreign-produced passenger cars. All passenger car sales, no matter the origin, are caught in the same tailspin. Imposing tariffs on foreign sedans won’t get the job done. The real industry dilemma is how to produce more light trucks, or anything else that US consumers are happy to purchase.
Unlike the situation in the United States, Chinese consumers, located in the world’s largest auto market, have been eager to buy sedans and other passenger cars. And GM’s Buick brand is one of the hottest badges going. But China’s economic prospects have dimmed considerably in the past few quarters. Indeed, China’s auto producers are also wrestling with excess capacity.
The chart’s data help to explain Mary Berra’s market-driven logic for opening plants in China while shuttering US sedan production. GM does not produce cars in China primarily for export back to the United States. Plant locations are driven by country-market considerations; capital is not so footloose as to allow for a chess game in which pieces can be moved anywhere on the board to form winning strategies.
Yet Mr. Trump seems to view the situation as a chess game and suffers from a chess-board enigma that was described by Adam Smith in 1759: “The man of system . . . seems to imagine that he can arrange the different members of society with as much ease as the hand arranges the different pieces upon a chess-board; he does not consider that the pieces put upon the chess-board have no other principle of motion besides that which the hand impresses upon them; but that, in the great chess-board of human society, every single piece has a principle of motion of its own, altogether different from that which the legislature might choose to impress upon it.”
Yes, CEO Berra faces a challenge because she must find ways to satisfy consumers in markets who are free to pick and choose among a host of competing automotive products while searching for their happiness. World markets for automobiles are far more complex than most people can imagine. Mr. Trump faces a vast knowledge problem that cannot be communicated or resolved by sending out midnight tweets.
Meanwhile, Mary Berra is addressing her dilemma, while Mr. Trump’s top-down desire to move America’s chessmen continues unabated. The resulting mix of actions does not augur well for rising prosperity in America or elsewhere.
Oil and Gold
With crude oil prices down 25 percent in 2018, and with major OPEC producers struggling to find ways to charge more for crude, this may be a good time to examine an old relationship: oil and gold. What does it tell us about future price movements?
For years, crude oil gurus have argued that Arab oil traders think in terms of gold—not American dollars, German marks, British pounds, or other currencies—when pricing their product. In short, we can forget about exchange rates and inflation risk; it’s a commodity-for-commodity market.
In fact, those who see the oil market this way have identified a sort of golden rule. On average, since the price of gold was allowed to float in 1973, an ounce of gold has bought roughly 15 barrels of crude oil.
Yes, there are ups and downs, as with all actively traded markets, but after the zigs and zags are accounted for, the golden rule seems to prevail. While nothing but death and taxes is certain, when gold buys more than 15 barrels of oil for a spell, believers predict that prices will tumble later. And vice versa. They are just not very good at saying exactly when the reversals will occur.
Consider figure 2. Here I have plotted the number of barrels of oil purchased by an ounce of gold from November 1990 through December 2018. The chart contains a dotted line that marks the magic 15-barrel number. Notice that since 1990, the gold price of oil has oscillated around the dotted line.
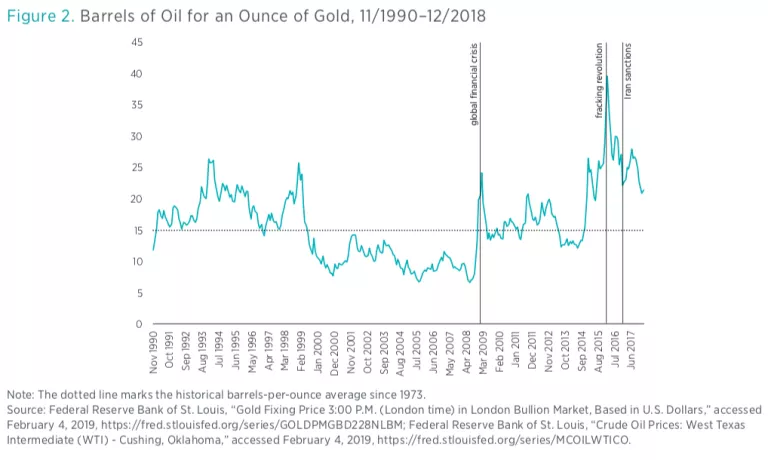
I also call attention to world events that have a bearing on oil production and shipments. There was severe Middle East turmoil after 9/11 and during the Iraq War. During those years, the number of barrels fetched by an ounce of gold fell to a low of seven and a fraction. Then, from 2009 through 2014, things perked up to a “normal” level, when the golden rule seems to have applied.
But 2014 brought the US shale oil and fracking revolution. After that, production soared and prices fell. With an ounce of gold in 2016, an oil trader could buy almost 40 barrels of oil! Since then, US production has become the global oil price hobgoblin.
But as in all historic periods, oil country monarchs and dictators are again struggling to tighten their production and national-revenue-preserving cartels. After all, crude oil revenues are critical to the budgets of OPEC members Algeria, Ecuador, Iran, Iraq, Libya, and Venezuela, where budget shortfalls yield political instability. Since 2016, the number of barrels fetched for an ounce of gold has headed, once again, toward the 15-barrel line.
So, what’s the forecast? Will the old golden rule once again prevail? Or has fracking technology fundamentally reset things to, say, 20 or 25 barrels for an ounce? I am of the opinion that, while 20 barrels may be the new normal for a decade or more, 16 barrels still beckons in the long run. But don’t ask me why. The answer lies in the data.
Nebraska in the Spotlight
Patrick McLaughlin, Senior Research Fellow and Director of Policy Analytics, Mercatus Center at George Mason University
Stephen Strosko, Data Engineer, Mercatus Center at George Mason University
Each quarter, we select one state and assess that state’s economic outlook and health. Last quarter, we put Hawaii in the spotlight. In previous quarters, we have examined Colorado, Illinois, Kentucky, Michigan, North Carolina, Oregon, and Utah. We focus on Nebraska this quarter.
The high-level picture of Nebraska’s economy shows that the state’s economy is extremely healthy. Different aspects of Nebraska’s economy will be discussed next, but relative to many other states covered in the state spotlight, Nebraska looks to be set up well for the present and the near future.
As of 2018, the largest industry in Nebraska is insurance and related activities, or industry 524 in the NAICS (North American Industry Classification System). This industry has doubled in size over the past five years as a percentage of Nebraska’s economy (GDP) and looks to be a continual point of future strength. A recent Deloitte report on the industry states that there could be some long-run concerns for the insurance industry owing to tariff and trade disputes, but the short-run picture for the industry is extremely optimistic. These positive trends will surely give a boost to Nebraska’s economy in 2019.
Manufacturing is another large Nebraska sector. As of 2016, 9.6 percent of Nebraska’s population was employed in manufacturing. Even though this was only slightly above the national median of 8.9 percent, Nebraska’s manufacturing industry accounted for over $26.6 billion and 26.9 percent of Nebraska’s GDP. The high percentage of GDP may owe to Nebraska’s specialization in high-end manufacturing. According to 2016 Bureau of Economic Analysis data, Nebraska’s largest durable goods manufacturing industry was computer and electronic product manufacturing. This aligns with the Nebraska state government’s claim that advanced manufacturing is an indus- try that plays to the state’s comparative advantage.
Strong industry growth could be playing directly into another strong labor statistic for Nebraska, the state’s rather low unemployment rate. As of December 2018, Nebraska’s unemployment rate was 2.8 percent, tying for the seventh-lowest unemployment rate across the US economy—and well below the national average. The low unemployment rate seems like a stable phenomenon for the state. The rate has not risen above 3.1 percent since September of 2014.
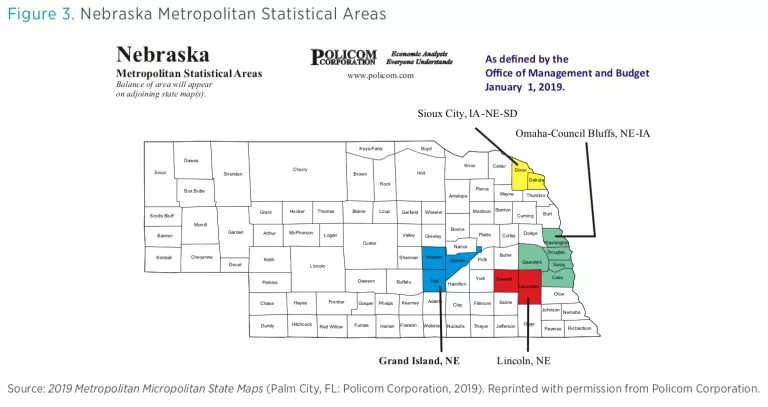
As of 2017, residents of Nebraska had a per capita personal income of $50,809. While this is not exceptionally high when compared to other states, a dollar spent in Nebraska goes much further than a dollar spent in many other states, as a dollar spent in Nebraska is worth $1.10 when cost of living is accounted for. While Nebraska is not experiencing a large growth rate in real income per capita, this figure is still positive and the trend is upwards. As defined by the Office of Management and Budget, Nebraska has four major metropolitan areas as outlined in figure 3.
These metropolitan areas include 12 different counties and are all located in the eastern portion of the state. The Policom Corporation ranks metropolitan areas by economic strength. Its ranking accounts for a variety of economic indicators including sector and industry growth, welfare programs, consistent wage growth, etc., across 383 metropolitan areas in the United States. Nebraska’s four metropolitan areas rank #81 (Omaha–Council Bluffs), #104 (Lincoln), #252 (Sioux City), and #262 (Grand Island) going into the year 2019. While Nebraska has many strong economic indicators going into the year 2019, the state’s metropolitan areas rank about average and could be a possible area to look to improve moving forward.
Fiscal health is another area that is extremely important when observing a state economy. Nebraska excels in the area of fiscal health, as shown by the Mercatus Center at George Mason University’s state fiscal health rankings, which rank Nebraska first out of all 50 states in fiscal health. These state fiscal rankings capture the fiscal health of every state by examining debt, obligations, solvency, healthcare benefits, and other financial indicators. The fiscal rankings cite Nebraska’s cash reserves as a major point of strength, stating that Nebraska has between 2.95 and 3.95 times the cash needed to cover short-term obligations, which is greater than the US average.
Very recent data on the 2017–2018 academic year show that some of Nebraska’s success may be driven by an extremely healthy and successful educational system. For the 2017–2018 academic year, Nebraska had the best high school graduation rate in the country, sitting at 93.7 percent. However, Nebraska may have trouble retaining some of that success when those students move into higher education. Exactly 30 percent of Nebraska’s population of individuals age 25 or older have a higher education degree. This is close to the national average.
Nebraska's Regulatory Outlook
Nebraska’s regulations are published online and can be found on the Secretary of State’s website. The state’s administrative code spans across approximately 74 different agencies and is generally organized based on agency publications. The 2017 edition of Nebraska’s regulatory code contained over 7.5 million words as counted by the RegData project at the Mercatus Center. Reading at a rate of 300 words per minute over a 40-hour work week, it would take an individual more than 10 weeks to read Nebraska’s entire code.
Out of the 26 state codes that have been analyzed by the Mercatus Center, Nebraska has the ninth largest, when ranking by number of regulatory restrictions. Regulatory restrictions are words that are legal and binding in nature, and they include terms such as shall, must, may not, prohibited, and required. Nebraska had 100,627 regulatory restrictions as of 2017.
The Department of Health and Human Services is the largest regulator in the state, publishing 37,592 regulatory restrictions, well over three times as much as the second-largest regulator, the Department of Environmental Quality. The most regulated industry in Nebraska’s code was found to be Ambulatory Healthcare Services, NAICS code 621. Every state is also affected by federal regulations. This effect varies based on the mixture of industries in each state economy. The Mercatus Center’s FRASE Index ranks Nebraska as experiencing the fifth-highest impact from federal regulations of all 50 states and the District of Columbia. This high rank is mostly owing to agriculture providing a large percentage of Nebraska’s GDP while also being an industry that is highly regulated by multiple agencies at the federal level.
Conclusion
While Nebraska may not have the healthiest regulatory environment, the state’s economy certainly has many healthy features. Even though the level of regulation in Nebraska is high, there are some aspects of regulation that Nebraska is handling well. For example, a consistently stable regulatory environment has been one of the main reasons why Nebraska’s insurance sector has been growing in recent years. Companies like Net Life, Fidelity National Title Group, Pacific Mutual, and many more all have moved to Nebraska in part owing to a consistent and favorable regulatory system. The Federal Reserve Bank of Philadelphia publishes leading indexes for each state, which predict economic growth over the next six months. Nebraska’s leading index paints a picture of average growth moving forward into 2019: Nebraska’s November 2018 indicator is 1.105, a slightly-below- average number that is also the state’s lowest since December 2016.
The New Economy Index produced by the Information Technology and Innovation Foundation provides a broader assessment. Its most recent report shows that Nebraska ranks 27th out of all the states with respect to knowledge jobs, economic dynamism, globalization, the digital economy, and innovation capacity. This index shows a positive increase in the aforementioned areas since 2014.
Yandle's Reading Table
Capitalism in America: A History (New York: Penguin Press, 2018) by Alan Greenspan and Adrian Wooldridge combines Greenspan’s formidable knowledge of the dynamics of the US economy and his remarkable ability and long experience in analyzing and presenting data with Wooldridge’s exceptional talent for telling stories about the economy. (Wooldridge, who holds an Oxford PhD in history, is an editor with the Economist.) The mixture yields a positive result for those looking for a highly readable and somewhat analytical review of American business history.
One does not have to venture far into the book to realize that the book may have been misnamed. Instead of defining, focusing on, and describing the evolution of American capitalism, the volume illustrates how Schumpeter’s story of creative destruction best portrays the American experience. In the authors’ words, “In telling this story, this book will focus on three organizing themes: productivity, creative destruction, and politics.” They go on to say that “politics deals with the fallout of creative destruction,” which is itself a fascinating explanation for the role of government in a rent-seeking society.
With 12 chapters, the book starts with the 1776 birth of the nation, deals with two pre–Civil War Americas—one organized around slave-based agriculture, and the other around manufacturing and commerce—and then focuses on a collection of special topics that include the age of the moguls and their expanded concern about government’s market interference, the imprint of the Great Depression, and America’s 1945–1970 “Golden Age of Growth.”
The authors are at their best when presenting data-rich explanations of business history moments. For example, in illustrating how the industrial north compared with the agricultural south, they note that “ninety-three percent of the important inventions patented in the United States between 1790 and 1860 were produced in the free states and nearly half in New England. Yankees applied their ingenuity to everything they touched. . . . A British visitor remarked that ‘every workman seems to be continually devising some new thing to assist him in his work, there being a strong desire, both with masters and workmen, throughout the New England States, to be posted up in every new improvement.’”
The book ends with three chapters that seek to show how the Great Recession led to another major burst of government regulation and how, at the same time, the kindling forces of creative destruction are in a state of decline. For a host of reasons, the authors show how, in the current period, falling geographic mobility, declining new venture capitalism, more common large firms—sometimes in cahoots with government—and growing monopoly power characterize America’s political economy so that larger firms are less likely to exit their industries.
When these features of 21st-century capitalism are combined with stagnating educational attainment, an aging population that adds fewer people to the workforce, a less inviting climate for highly productive immigrants, and a heavily subsidized entitlement society that encourages lots of consumption and little saving, the result is economic stagnation. Though the two authors are far from being optimistic about the future of US capitalism, they are not totally garbed in sackcloth and ashes. As they see it, there is a way out of the cage that we the people through our elected officials have created; but unlocking the cage—deregulating, reducing subsidies, and opening markets to more thoroughgoing competition—will require major changes in public policy and a huge surge in the willpower to make such changes. Unfortunately, economic history suggests that bringing such dramatic change is usually associated with recovery from severe economic shocks, which requires dramatic change.
Oxford University economist Paul Collier offers a very different take on capitalism in his scholarly examination of what might explain the sharply divided state of political economies across the industrial world. Collier’s The Future of Capitalism: Facing New Anxieties (New York: HarperCollins, 2018) is not a book for the casual reader. Though written extraordinarily well, almost every page carries hard-thinking content, such that it pays one to pause, think a bit, and reread before going forward. Collier’s book is autobiographical in that he examines changes in his British world that have occurred in his lifetime.
Having been born and reared in Sheffield, once a historic steel production center, Collier tells how older manufacturing centers, such as Sheffield, ceased to be economic mainsprings and became backwater communities with a weak economic pulse. This is compared with the rising dominance of cities populated by highly specialized and well-educated young specialists whose world-class earning capacity enabled them to live in a totally different bubble from that of the frustrated steel workers whose best years are well behind them. But don’t get the wrong idea: the book is not a collection of stories. It is a carefully built analysis that is reinforced by stories.
The book’s theme is captured by this early statement: “Deep rifts are tearing apart the fabric of our societies. They are bringing new anxieties and new anger to our people, and new passions to our politics. The social bases of these anxieties are geographic, educational and moral. It is regions rebelling against metropolis; northern England versus London; the heartlands versus the coasts. . . . It is the struggling workers rebelling against the ‘scroungers’ and ‘rent-seekers.’"
Characterizing the anxiety crisis as fundamentally a moral or ethical matter, Collier argues that in the decade of the 1970s and before, the logical acceptance of a social norm of reciprocal duties gave definition to moral communities where people beneficially looked after one another, either privately or buttressed by public support. There were rich and poor and good and bad, and there were differences between the standards of living in urban versus rural areas, but hardworking families in any setting could respect themselves and command respect from others. But as technical change became more rapid, as individuals became more specialized as knowledge workers, and as the leveling forces of global competition concentrated industrial production of some product groups in particular locations and eliminated it in others, the assumption of reciprocal duties no longer seemed to work. At the same time, the prosperity gap between rich and poor regions, and urban and rural areas, became larger.
With this background, Collier argues that two sets of moral or political groups entered to address the disturbed social fabric. He labels one group “utilitarian.” This group focuses on efficiency, or one might say the use of benefit-cost analysis and free-market forces in correcting society’s brokenness. The second group, which he labels “Rawlsian,” looks to bring justice to the situation and strives to correct newly stressed income inequality and to develop social programs that distribute goods and services to those who do not drink from the waters of the prosperity fountains. The utilitarians also look to redistribute consumption based on perceived needs; they work to form national programs to provide housing, healthcare, and nutrition to individuals and families that no longer have to promote reciprocal obligation to care for one another. The two politically active groups, one on the right, the other on the left, push for top-down policy changes that address the new anxieties.
It is in this context that Collier addresses the challenge of restoring ethics for the state, firm, family, and world, and then speaks to restoring what he terms “the inclusive society.” He finally deals directly with politics and addresses how to make the political process more inclusive.
Recognizing that I cannot do justice to the book in my effort here to describe its contents and contribution, I leave with the reader with this summary: This book offers one of the most cogent assessments of the rise of today’s divided society and how divisive forces may be meaningfully addressed. There is too much in it to absorb in one reading. It should be read, studied, discussed, and read again.

