- | Low Interest Rates and the Economy: A Mercatus Colloquium Low Interest Rates and the Economy: A Mercatus Colloquium
- | Monetary Policy Monetary Policy
- | Research Papers Research Papers
- |
The Fall and Future Rise of Interest Rates
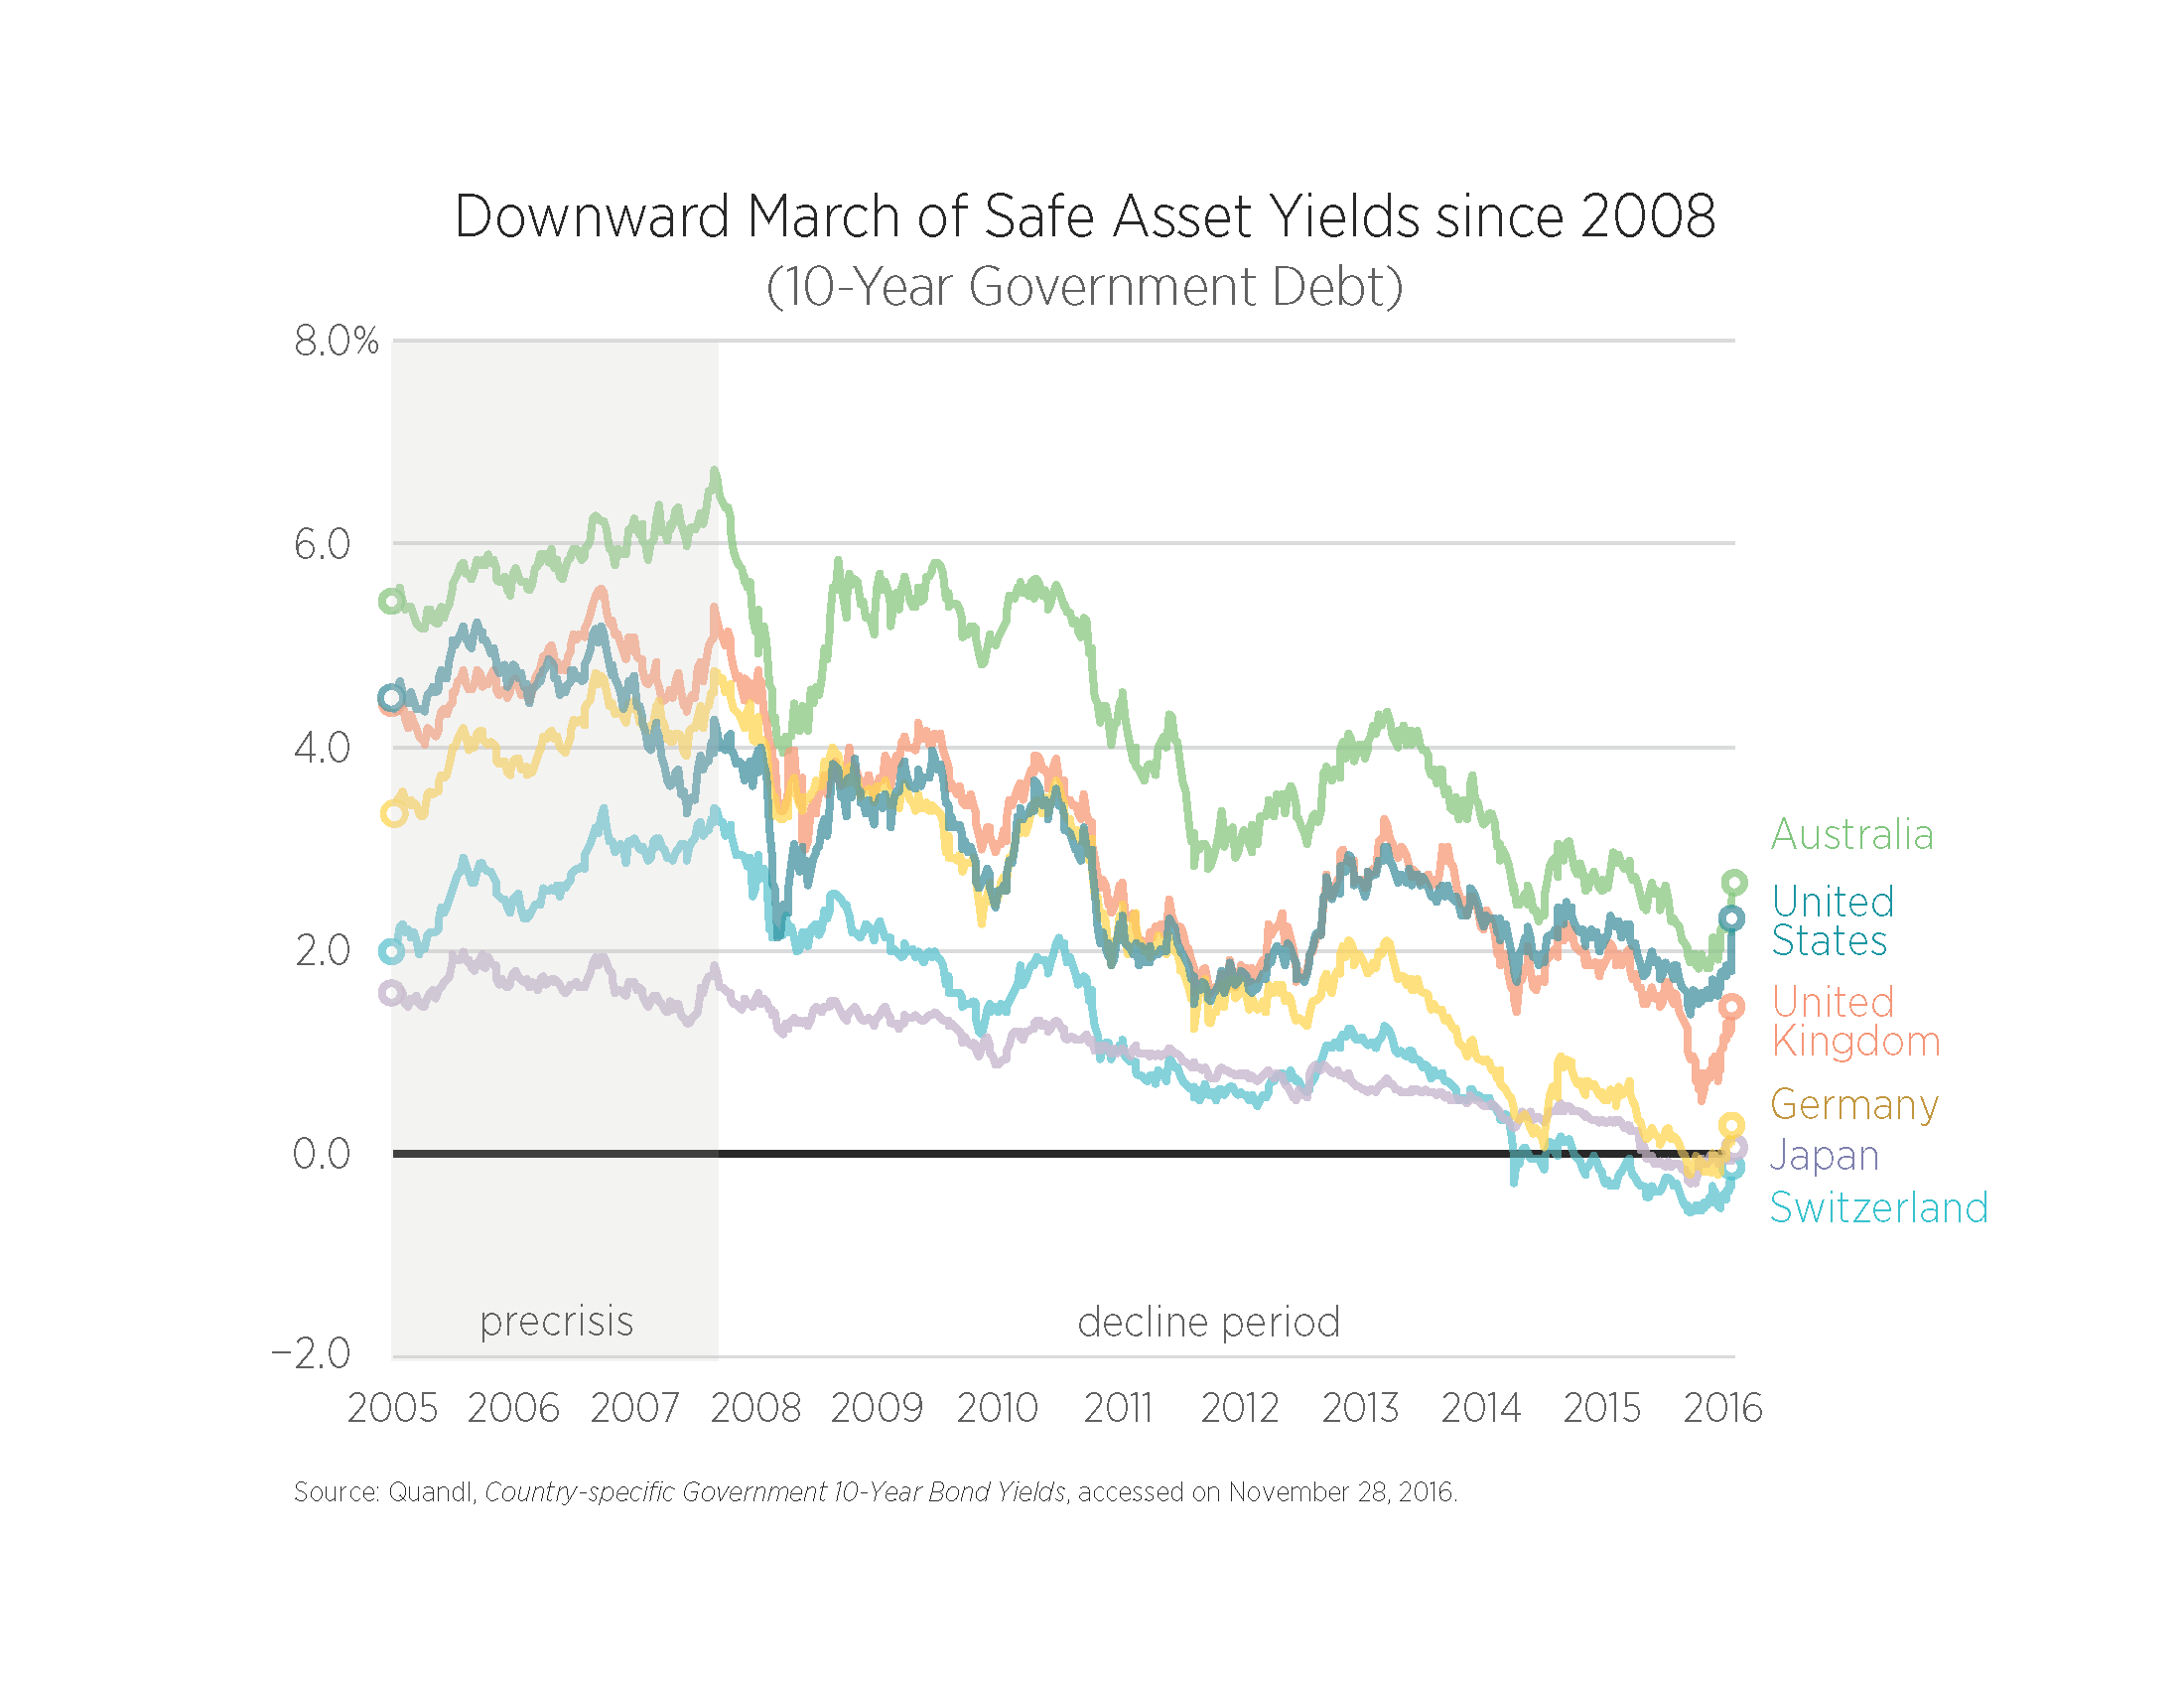
Bellwether interest rates across the world began declining in 2008 and reached historically low levels in 2016. Some, such as 10-year German and Swiss bonds, hit negative values. For now, these safe-asset interest rates appear to have bottomed out, as seen in figure 1. The colloquium asks us to make sense of this downward trend in benchmark interest rates and to consider what it would mean if the trend were reversed.
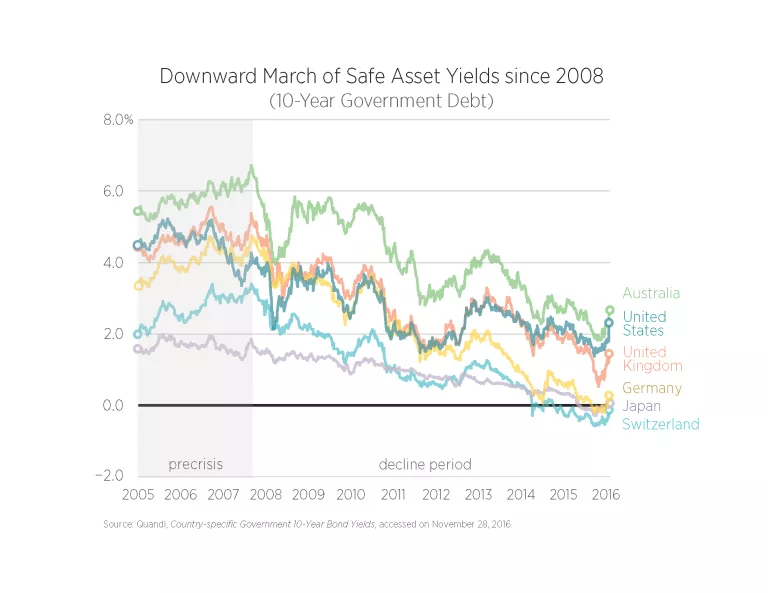
This essay sheds light on these issues by looking closely at the most important benchmark interest rate, the yield on the 10-year US Treasury (see figure 1), and decomposing it into subcomponents. The analysis shows that the 10-year Treasury yield has fallen more as a result of business-cycle pressures and policy uncertainty than because of structural changes like demographics. Consequently, more normal levels of interest rates are likely to prevail in the future.
The Post-2007 Decline in Yields
To understand the decline in long-term interest rates after 2007, it is useful to draw on the expectations hypothesis of interest rates. The theory maintains that arbitrage pressures cause the following relationship to exist between long-term interest rates (iLT) and short-term interest rates (iST):
(1) iLT = avg.expected iST + term premium
That is, the 10-year Treasury yield (iLT) should equal the expected path of short-term interest rates (iST) over the same time period, plus a term premium.
The assumption is that if holding a long-term Treasury bond were no riskier than holding a short-term Treasury bond, then investors would be indifferent between investing in a long-term Treasury bond and a run of short-term Treasury bonds over the same period.
There is, however, extra risk to holding long-term Treasury bonds, so investors demand additional compensation for it. This compensation, the term premium, is shaped by uncertainty, regulations, and central bank actions. For example, if investors are worried that the Eurozone debt crisis is about to erupt again, and if they desire more long-term US Treasuries, they will demand less compensation to hold those investments. This move will drive down the term premium.
Likewise, new regulations requiring banks to hold more long-term Treasuries, or large-scale asset purchases by central banks that increase the demand for Treasuries, will lower the term premium. In short, any change in the demand for Treasury securities not driven by the expected path of short-term interest rates affects the term premium.
The average expected short-term interest rate (iST) itself can be broken down using the Fisher equation:
(2) avg. expected iST = avg. expected rST + avg. expected π,
where rST is the short-term, risk-free, real interest rate and π is inflation. The rST can also be viewed as the short-run natural interest rate that follows the health of the economy. Substituting equation (2) back into equation (1) gives this decomposition of the long-term Treasury interest rate:
(3) iLT = avg. expected rST + avg. expected π + term premium
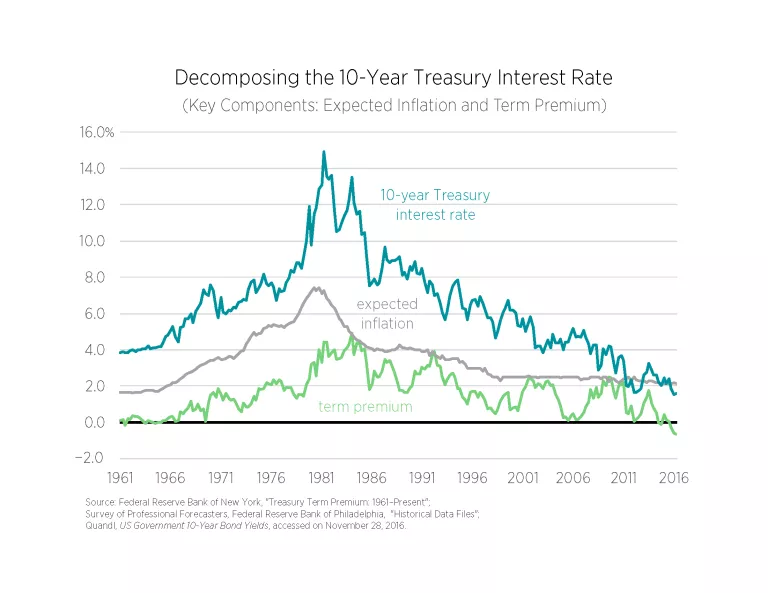
Equation (3) can now be used to assess long-term interest rate declines since 2008. Figure 2 analyzes this approach by looking at the expected inflation (gray line) and the term premium (green line) components for the 10-year Treasury over a long historical period. Both series show a pronounced upward trend that begins in the mid-1960s and peaks by the early 1980s. This analysis reflects the Great Inflation period during which a combination of overly loose monetary and fiscal policies caused inflation expectations to become unmoored and caused policy uncertainty to rise. The latter development, in turn, caused the term premium to rise. Starting in the early 1980s, expected inflation and the term premium both began a slow decline as macroeconomic policy improved and became more predictable.
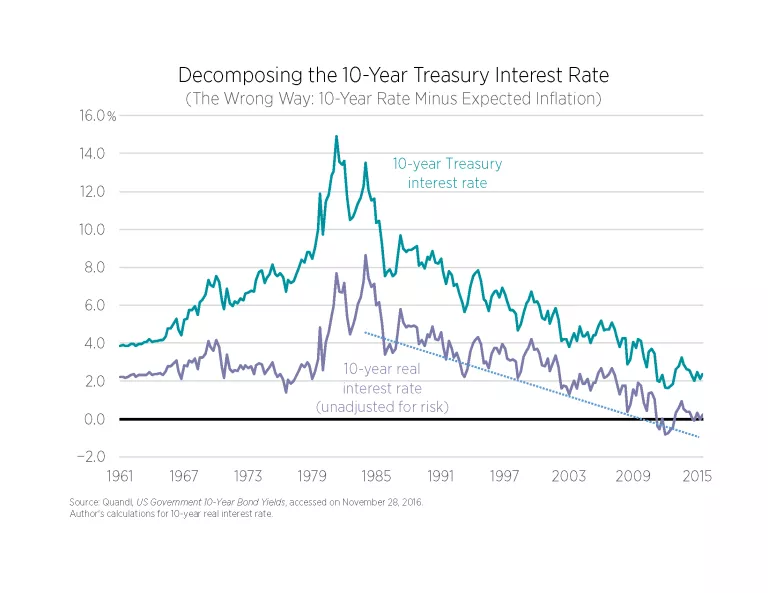
Although most observers are aware of the gradual decline of inflation expectations since the 1980s, far fewer recognize the similar decline in the term premium. Failure to acknowledge the decline in the term premium has led many to conclude incorrectly that real interest rates have been declining for 30 years. Simply subtracting the expected inflation rate from the 10-year Treasury interest rate gives a real interest rate that is unadjusted for the change in the term premium. Figure 3 demonstrates just such a calculation; it misleadingly shows a downward trend in real interest rates by ignoring the decline in the term premium.
To get the short-term, risk-free, real interest rate—which is rST —one must also subtract the term premium from the 10-year Treasury interest rate or
(4) avg. expected rST = iLT - (avg. expected π + term premium)
This real interest rate is the one that really matters for macroeconomic analysis—it is the natural interest rate. It is shown in figure 4 as the 10-year, risk-free, real interest rate; please note that it deviates around a fairly stable trend. There is now no evidence of a downward trend since the 1980s. The downward trend found in many estimates of real interest rates is simply the residual risk component that has been declining as macroeconomic policy has improved.
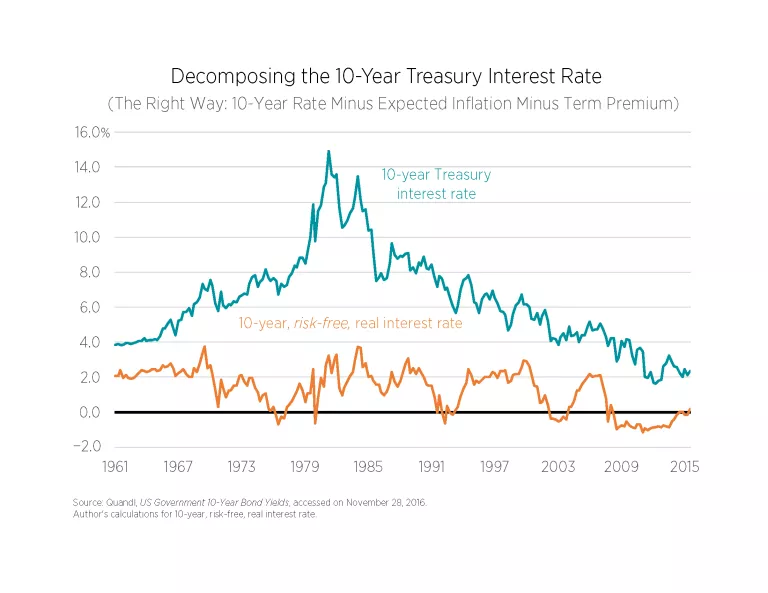
Figure 5 shows the deviations of the risk-free real interest rate around its trend for the more recent period of 1985–2016. It also reports the Congressional Budget Office’s (CBO) output gap measure, a measure of the business cycle. There is a close relationship between the deviations of this real interest rate measure and the business cycle (R2 is 63 percent). This relationship makes sense because, as previously noted, the risk-free real interest rate rST is the natural interest rate. It follows a trend but deviates around it based on the health of the economy. If the economy overheats (cools down), it rises above (falls below) its trend path, which is why it tracks the output gap so well.
Figure 5 also shows a slow recovery for the output gap. Consequently, the average expected should also be slow to recover. This is a key reason that the 10-year Treasury yield has been low for so long. Figure 5 also reveals that the recovery appears to begin sputtering around mid-2014; since then, the output gap has remained just under –2 percent. Unsurprisingly, the risk-free real interest rate has followed suit.
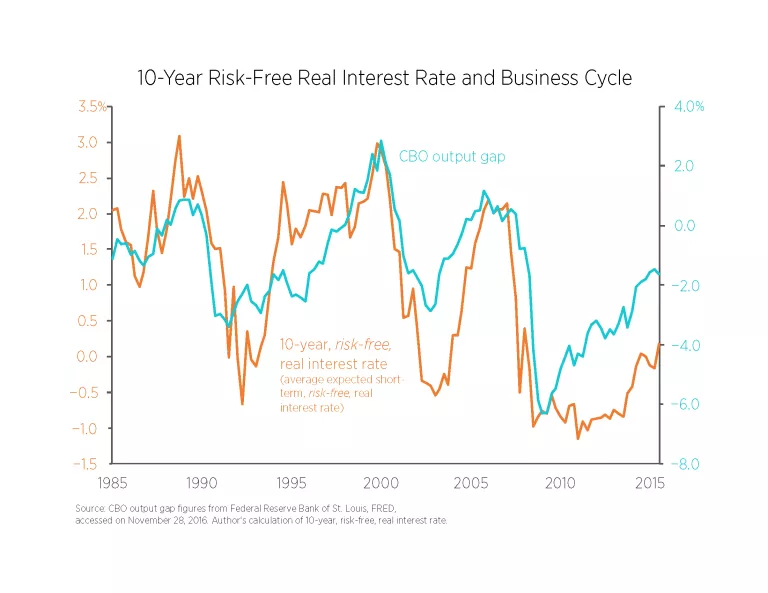
On the basis of regression of the two series in figure 5, the risk-free real interest rate should return to 1.65 percent once the output gap reaches zero. If one assumes that this estimated relationship holds up, then the only other drag on the 10-year Treasury is the term premium. As figure 2 shows, the term premium has plummeted since 2013. Why has it fallen so sharply?
There are several answers. New regulations requiring financial firms to hold a greater amount of safe assets have increased the demand for long-term Treasury bonds. The aging of populations in advanced economies has also increased the demand for long-term Treasury securities. Large-scale asset purchases by central banks may also be a factor. Additionally, both ongoing policy uncertainty caused by Brexit and the rise of populist political forces raise the demand for safe assets.
On this latter point, the University of Chicago’s Global Economic Policy Uncertainty Index has been a near-mirror image of the term premium since 2009. This observation suggests that increased policy uncertainty over the past few years has played a significant role in lowering the term premium. Moreover, figure 2 shows that the term premium did return to normal levels in 2009–2011 and again in 2013. This essay contends that although new regulations and demographic changes are relevant, they are not as meaningful as the other developments.
Where Will Interest Rates Go?
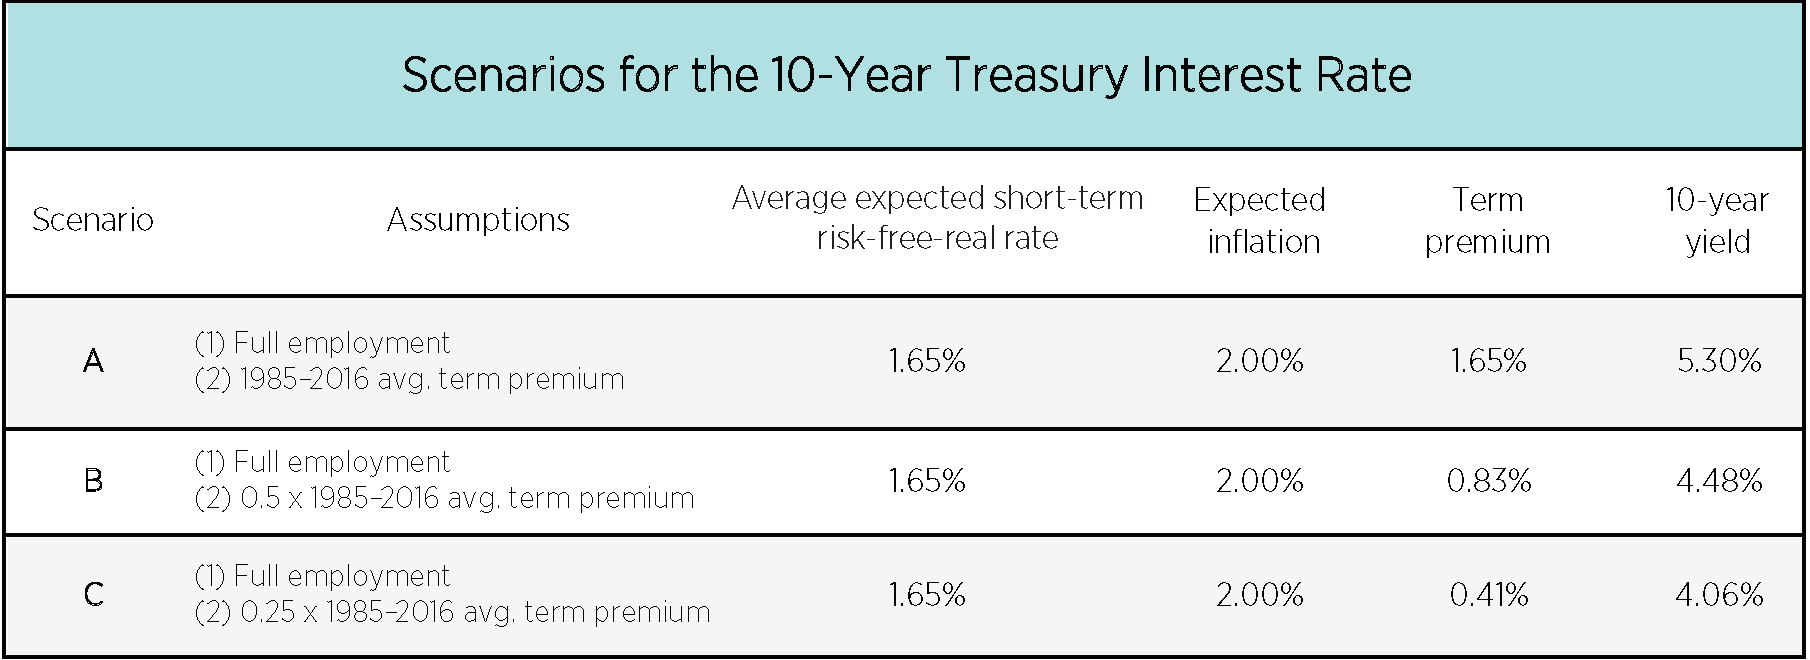
Table 1 provides three estimates that are based on different scenarios for the term premium. Those estimates show what the 10-year Treasury yield will be once the economy returns to full employment. The first scenario assumes the term premium fully returns to its 1985–2016 average, the second assumes a 50 percent return, and the third assumes only a 25 percent return.
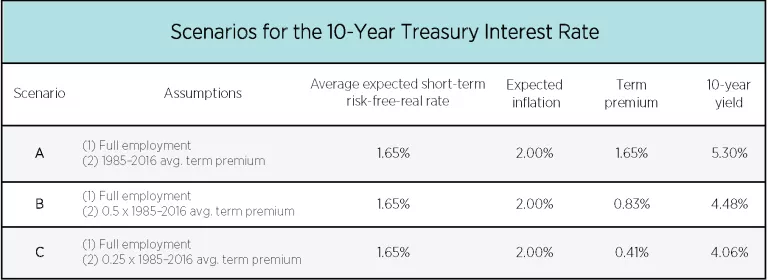
The first scenario returns the 10-year Treasury to 5.30 percent, a value consistent with the precrisis range; however, it assumes no lasting change in the term premium. The second scenario results in a 4.5 percent yield, while the third scenario produces a 4.1 percent yield. The first scenario is unlikely given the new financial regulations and demographic changes. The most feasible outcome is that the 10-year Treasury interest rate will probably hit somewhere in the 4.0 percent to 4.5 percent range. Although this rate is not as high as precrisis values, it is far above the 3 percent predicted by the Federal Open Market Committee in its summary of economic projections.
This conclusion that the 10-year Treasury interest rate will return to more normal levels finds support in the aftermath of Donald Trump’s election to the presidency. Since then the 10-year Treasury yield has risen almost half a percent. The increase has come from a higher risk-free real interest rate, higher expected inflation, and a higher term premium. All of these developments are consistent with the bond market expecting increased economic growth under President Trump. This understanding is corroborated by the corresponding rise in the stock market during the same time. It is too early to know for sure, but these developments point to rising yields going forward and a return to more normal interest rates. A low interest rate environment will not last forever.
Series Information
This essay is the first in a twelve-essay colloquium on the effect of low interest rates on the economy. To read other essays in the series, click here.

