- | Regulation Regulation
- | State Testimonies State Testimonies
- |
Cutting Red Tape in Kansas
Testimony before the Kansas Senate Committee on Assessment and Taxation and Kansas Joint Committee on Administrative Rules and Regulations
Chairwoman Tyson, Chairman Highland, and members of the committees:
Thank you for allowing me to present this testimony today with regard to the regulatory environment in Kansas. My name is James Broughel, and I am a senior research fellow at the Mercatus Center at George Mason University, as well as an adjunct professor of law and economics at George Mason University. My research focuses on state regulatory institutions, economic growth, and the economic analysis of regulations.
My message today can be summarized in three points:
- Kansas has a significant amount of regulation on its books in absolute terms, but has a relatively light regulatory burden when compared to other US states.
- Nonetheless, the accumulation of unnecessary regulations can be a drag on economic growth and prosperity in a state.
- Creating a budget, or inventory, system for regulations would help the Kansas economy grow, lock in the state’s competitive edge, and encourage recurring periodic review of the thousands of existing regulations affecting state residents.
Quantifying Regulation at the State Level
Generally speaking, state regulatory codes are too large for any single individual to read from start to finish. For example, the online version of the Kansas Administrative Regulations (KAR) contained 3.2 million words as of early 2019. It would take an ordinary person about 180 hours—or 4.5 weeks—to read the entire KAR, assuming the person reads regulations 40 hours per week as a full-time job. At the Mercatus Center, my colleagues and I have launched State RegData, a first-of-its-kind effort to quantify regulation across the 50 states. State RegData uses text analysis technology to scan through bodies of legal text—in this case state administrative codes. Modern technology is allowing us to overcome some of the barriers traditionally associated with parsing millions of words of regulatory text.
As part of our project, we pull key information from state codes, including word counts and counts of regulatory restrictions, which are instances of the terms shall, must, may not, prohibited, and required. These restrictions can signify legal constraints and obligations of various kinds. We are also able to estimate which industries are most targeted by state regulation and assess which types of regulation are most prevalent.
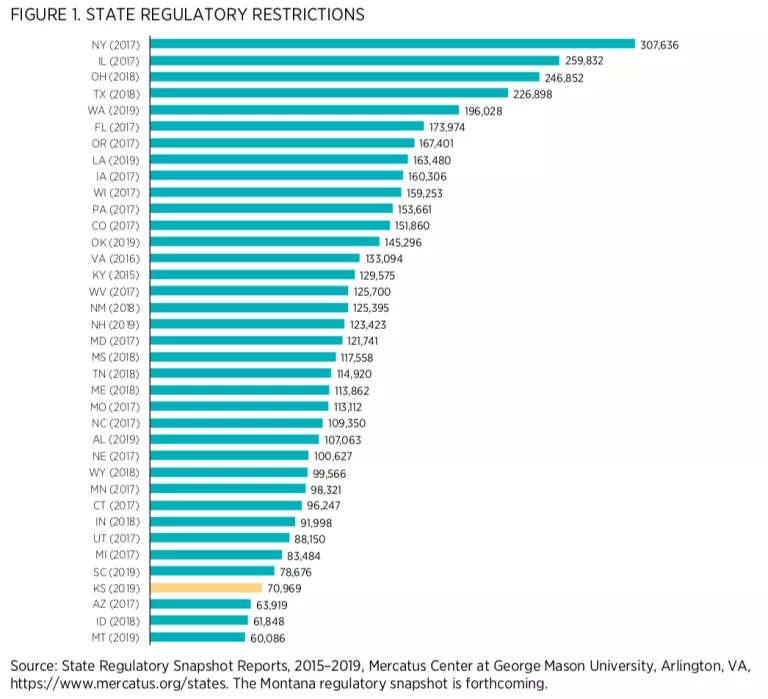
Kansas had 70,969 regulatory restrictions in its administrative code as of early 2019. To put that in context, Kansas’s administrative code contains the fourth-smallest count of regulatory restrictions of any state reviewed thus far by the State RegData project. The average state has roughly 134,000 restrictions, nearly double what Kansas has, but Kansas has roughly 10,000 more restrictions in its regulatory code than Montana, the least regulated state by our measure. New York, the most regulated state by our measure to date, has more than four times as many regulatory restrictions as Kansas (see figure 1).
Despite Kansas having a relatively light-touch regulatory approach compared to other US states, the United States in general appears to have significantly more regulation than some other countries, such as Canada. According to Mercatus estimates, the average province in Canada has just 26,800 regulatory restrictions, far fewer than Kansas (see figure 2 for Canada’s top 10 provinces in terms of regulatory restrictions). Similarly, the national government in Canada had just 71,801 active restrictions in its regulations as of 2018, roughly the same as Kansas. While these numbers may not be completely comparable (since many Canadian requirements show up outside of regulation in statutes and various policy documents), they nonetheless are fairly striking, considering that roughly 1.1 million restrictions show up in the US Code of Federal Regulations, more than 15 times the corresponding national estimate for Canada.

Why Regulatory Accumulation Matters
The accumulated body of regulations in a state has an effect on the economy that is greater than the sum of the effects of each individual regulation. Michael Mandel and Diana Carew of the Progressive Policy Institute in Washington, DC, liken the effect of regulation on the economy to dropping pebbles in a stream. The first pebble is insignificant, a thousand pebbles may slow the flow, but a hundred thousand pebbles could dam the stream even when that last pebble was, by itself, also insignificant.
The empirical connection between regulation, economic growth, and the known contributors to economic growth has been made many times in the peer-reviewed academic literature:
- A 2013 study in the Journal of Economic Growth estimates that federal regulation slowed the growth of the US economy by 2 percentage points per year on average from 1949 to 2005. This estimate suggests that, had regulation remained at its 1949 level, 2011 GDP would have been about $39 trillion, or 3.5 times higher than it actually was.
- A study published by the Mercatus Center estimates that growth has been slowed by 0.8 percentage points per year on average by federal regulations implemented since 1980. That number may sound small, but in fact it suggests that had the federal government imposed a cap on regulation levels in 1980, then by 2012 the economy would have been $4 trillion larger, which amounts to $13,000 per person in the United States.
- Researchers at the World Bank estimate that the economies of countries with the least burdensome business regulations grow 2.3 percentage points faster annually than countries with the most burdensome regulations.
- The authors of one study, published in the Quarterly Journal of Economics, a top-ranked economics journal, say the following about gains (or lack thereof) from more stringent regulation: “We do not find that stricter regulation of entry is associated with higher quality products, better pollution records or health outcomes, or keener competition. But stricter regulation of entry is associated with sharply higher levels of corruption, and a greater relative size of the unofficial economy.”
Numerous other academic studies have confirmed the negative effects that product market regulations can have on important contributors to economic growth, including investment rates, innovation and research and development spending efficacy, employment, and productivity growth.
In addition to a robust empirical literature, leading applied welfare economists readily admit their preference that policy aim for a rate of growth below the economy’s maximum sustainable rate of growth. Why? Because many economists prefer to redistribute wealth from the future to the present (i.e., for the present generation to consume at the expense of future generations), believing this would bring about a more equitable distribution of wealth across generations. In other words, they are willing to accept a slower rate of economic growth in exchange for policy interventions that they perceive as advancing equity. Unfortunately, many economists allow their own values to enter analysis when they should be focused on making honest assessments of the economic tradeoffs policies present.
Connecting Economic Growth and Well-Being
A few lost percentage points in growth may not sound like a lot, but consider this: From 2007 to 2017, the compound annual growth rate of Kansas real GDP was just 0.9 percent (the rate for the nation was 1.5 percent). In 2017, Kansas real GDP grew 0.2 percent, while the 2016–2017 national change was 2.2 percent.
If the past decade is a good indicator, it will take about 78 years for the state’s economy to double in size. This was approximately the life expectancy at birth for an American born in 2007. By contrast, if Kansas’s economy were to grow 3 percent per year, it would take just 24 years for its real GDP to double. This small difference in growth rates is roughly the difference between the economy doubling once in a lifetime and doubling three times in the same time period.
Growth rates of 3 percentage points or more per year are plausible and are being achieved in some states right now. By contrast, states with slower growth will see incomes and wages for state residents that are much lower than they could otherwise be. Reversing this trend would boost innovation, bring increased employment opportunities for Kansans, and improve living conditions for state residents now and in the future.
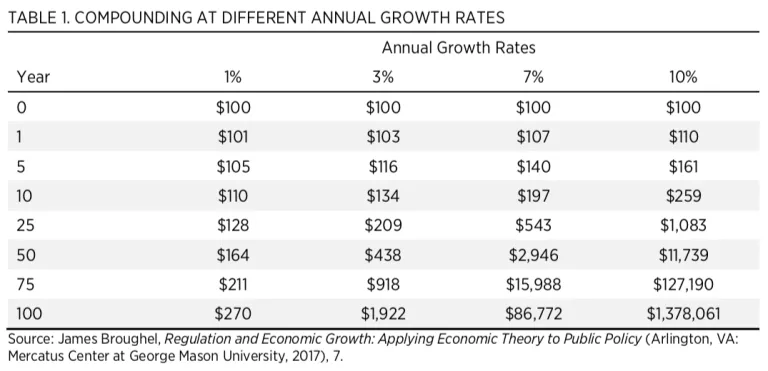
The miracle of compound growth becomes more evident when considering longer time horizons. Table 1 presents how a theoretical $100 investment would grow over time at various annual rates of return. As should be clear, the difference between 1 percent annual growth and 10 percent annual growth is beyond night and day. While national or state economic growth on the order of 7 to 10 percent annually is unrealistically high, growth in the range of 3 to 4 percent is not.
It is difficult to even conceive of what the US economy would be like were it two to four times as large as it is today. The benefits in terms of technology, wealth, and opportunity stretch the bounds of the imagination. While GDP does not measure all aspects of human well-being, the income generated by a vibrant and growing economy can improve living standards in countless ways. With more wealth, Kansans would have far greater opportunity to increase investments in health and education, pass along bequests to their children, and pursue the kind of life they and their families think is best.
At some point, an economy that grows consistently faster than another economy is so much richer in terms of wealth, technology, and opportunity, that one can say that it is objectively better off in terms of human well-being. Every state in the country should be concerned about growth, especially Kansas, with growth rates below the national rate.
Establishing a Budget for Regulations
Kansas has a strong track record of pursuing regulatory reforms in recent years, but more work remains. Just as a closet can gradually overflow with clothing that is out of style or otherwise unessential, the regulatory system is periodically in need of a little spring cleaning. That’s why one reform that is worth considering is creating a budgeting system for regulations. A regulatory budget can prevent excessive regulatory accumulation while also preserving the flexibility regulators need to maintain a modern regulatory system. Some benefits to this approach include the following:
- Limiting regulatory accumulation. A budget provides a check on the inertial growth of regulations—it helps prevent too many pebbles from clogging the stream.
- Demonstrated success. A budgeting approach has been tried and proven effective in other places, most notably in Canada; and similar efforts are underway in states such as Virginia.
- Maintaining state competitiveness. Based on restriction counts, Kansas looks like an attractive place for businesses compared to neighboring states. A regulatory budget could be used to lock in the state’s competitive edge, keeping barriers to entrepreneurship low and attracting ambitious young people and firms from around the country.
- A culture change at state agencies. After the Canadian province of British Columbia instituted a simple regulatory budget in the early 2000s, one public official noted that it changed her role from a regulation “maker,” who simply adds new rules, to a regulation “manager,” who oversees and cares for a portfolio of rules.
In 2001, British Columbia successfully instituted a reform with a goal of reducing regulation levels by one-third within three years. Subsequently, British Columbia implemented a policy whereby one regulatory requirement would be eliminated for every new one introduced, ensuring that regulatory creep would not return. Regular reporting played an important role in providing the necessary transparency about how many requirements were added or removed over time and where requirements were coming from. Regulation levels have fallen further in the province since the “one-in, one-out” policy was established. It is likely that regulatory reform has contributed to British Columbia’s strong economy in recent years, as an economic turnaround coincided with the reduction in regulation.
The success of the province’s regulatory effort inspired a similar national law in Canada, which passed the Canadian parliament overwhelmingly by a margin of 245 “yes” votes to just one “no” vote. US states such as Kentucky have also been inspired by the reforms in British Columbia and are currently implementing red tape reduction programs.
British Columbia was able to achieve its goals in part because government employees counted the number of regulatory requirements in place and committed to tracking this statistic across time. A similar inventory system is now being set up in Virginia as part of the 2018 Regulatory Reduction Pilot Program. By July 1, 2020, all executive branch agencies in Virginia that are subject to the state Administrative Process Act must develop a baseline regulatory catalog and report their catalog data. Two states agencies, the Department of Professional and Occupation Regulation and the Department of Criminal Justice Services, must, by July of 2021, initiate reforms that produce a 25 percent reduction of the rules and requirements under their purview.
It is not surprising that Virginia is combining substantive efforts to reduce regulatory burdens with licensing and criminal justice reforms. The negative effects of occupational licensing laws are well known. These restrictions often disproportionately burden low-income individuals, as well as other vulnerable populations such as minorities, military spouses, and immigrants, all of whom are trying to better provide for their families. Recent analysis also suggests recidivism, the likelihood that former prisoners will reoffend and return to prison, can also be reduced by reforming occupational licensing laws. Other states may be following Virginia’s lead, and Kansas could follow a similar path. Like with the national law in Canada, Virginia’s law is notable for its bipartisan nature. In fact, CNBC recently named Virginia one of America’s top states for business, citing the new regulatory reduction law as a major reason for Virginia’s strong placement in the rankings.
Conclusion
The state of Kansas has nearly 71,000 regulatory restrictions on its books as of early 2019. It has about as much regulation as the national government in Canada, based on estimates from the Mercatus Center. A budgeting system for regulations could help prevent unwanted regulatory accumulation in Kansas while also granting state regulators the flexibility to address new and evolving problems. The successful experience of British Columbia since 2001 offers a roadmap for how to implement such a reform. Other US states such as Kentucky and Virginia are following British Columbia’s successful example.
If Kansas can consistently increase its economic growth rate each year, this would have profound implications for the opportunities available to state residents, both in the near term as well as far into the future. Establishing a regulatory budget is a smart step toward achieving this goal.
Thank you again for your time and the opportunity to submit this testimony. I am happy to answer any questions you may have.

